Crypto Trading with Chaikin Money Flow Indicator || Crypto Academy S4W6 || Homework Post for @kouba01
"Trading is not for the dabblers, the dreamers, or the desperate. It requires, above all, one steadfast trait of dedication. So if you are going to trade, trade like you mean it."
Rod Casilli

Image edited with PicsArt
Crypto Trading with Chaikin Money Flow Indicator || Crypto Academy S4W6 || Homework Post for @kouba01

In your own words, give a simplified explanation of the CMF indicator with an example of how to calculate its value?
As we well know, Chaking Money Flow is an indicator that allows to measure and know the flow of funds in a specific time frame developed by Marc Chaikin. Thus, this accumulation represents the movement of said funds in a retroactive period of 20 to 21 days, so that it becomes the distribution base of such accumulated funds together with the sum of the Money Flow Volume, so the MFV represents only the trace of the cumulative distribution.
Now, as a result of said sum of volume and price information, oscillations are obtained as a sample of the indicator that represent, depending on the case, a sustained accumulation production, either above or below a zero line, this being its central value, where it takes the values given as the balance between sales and purchases.
Thus, it uses the degree of pressure that exists, both in the purchase and in the sale, to choose the final price thanks to the relationship that occurs in the period chosen between the highest and lowest points. That is, the equilibrium between both pressures is measured with the absolute level of flow, whether it is a purchase, which occurs when it has a positive final value since it closes in the upper half in the period in question, or is a sale , by having a closing price in the lower half of the range. Where in addition, it can be used in order to look for crosses above or below the zero line to determine the changes that occur in the flow and thus indicate a possible future trend reversal.
However, these possible crosses, in addition to being very easy to determine, can generate false signals for the operator since brief crosses can often occur that change the values and this in turn produces a lack of follow-up in the price, which causes a wrong buy or sell indication.
On the other hand, if we seek to determine the value of the CMF, we have two options, as the teacher explains, however, I consider the option of the 3 steps more easily since it is possible to better visualize the steps to follow to achieve a successful calculation. It is only necessary: firstly, calculate the Money Flow Multiplier of each session according to the period considered of the crypto asset using the following formula:
MFM = [(P.C – P.m) – (P.M – P.C)] / (P.M – P.m)
Once this is done, the Money Flow Volume results thanks to the multiplication of the previous result by the volume of said period as follows:
Money Flow Volume = MFM x Volume of the session in the assigned period
And finally we obtain the final result of the CMF by means of the sum of the MFV divided by the total number of operations carried out, as follows:
Chaikin Money Flow = sum (MFV) / total sessions
Therefore, we can see how the Chaikin Money Flow depends absolutely on the result of the MFV and this in turn of the MFM. Likewise, I consider it important to highlight that this factor adjusts the volume instability for the sessions, so that if the multiplier is equal to 1 at the time of closing it means that it is the maximum of the session while, if on the contrary it is - 1, is the minimum of the session.
Demonstrate how to add the indicator to the chart on a platform other than the tradingview, highlighting how to modify the settings of the period
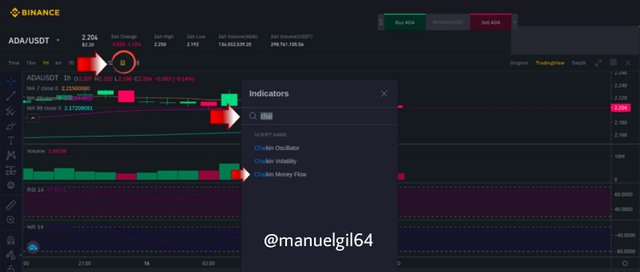
To add the Chaikin Money Flow indicator on Binance, we select the Indicators option, and search for it. This adds the indicator for a period of 20 by default, since 20 and 21 days is recommended at the standard level.</div
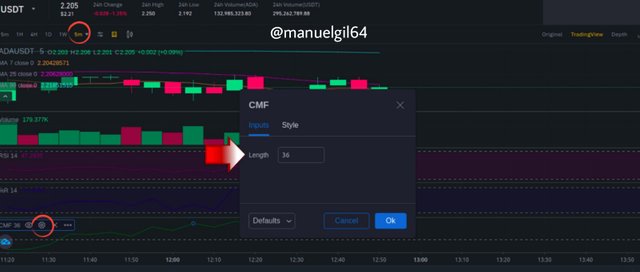
However, we are going to configure the period from 20 days to 36 to be able to work with 5-minute candles, since as the teacher mentions in his post, it is advisable to work under this configuration of periods in these candles and consequently, the most optimal
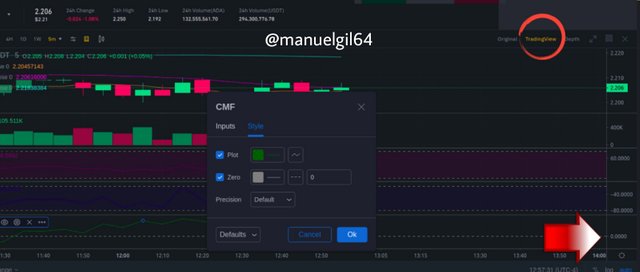
And as a technical indicator, it is possible to customize the styles in the tab next to the Inputs in the same settings. Another two points to highlight in the following image is that we use the TradingView tab within Binance, and the arrow that indicates where the value 0 is located, which is where the indicator will be oscillating to give us the respective signals.
What is the indicator’s role in confirming the direction of trend and determining entry and exit points (buy/sell)?
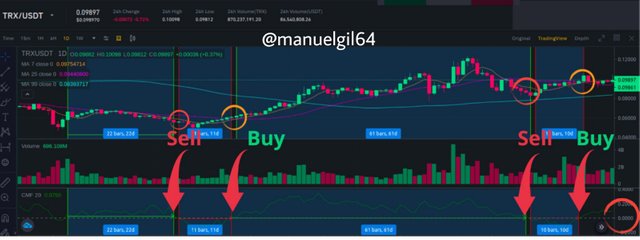
Chaiking Money Flow (CMF) is an oscillator that will cross the line of value 0 as can be seen in the image and will generally be oscillating between +1 and -1, and in this way it indicates the strength of a trend.
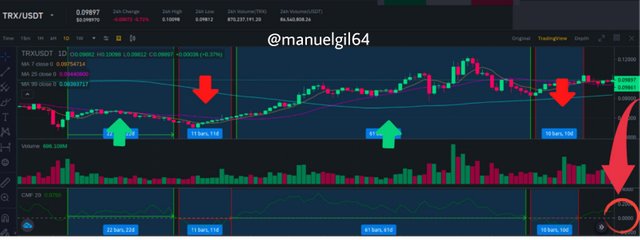
As the professor mentions in his post, when the closing price is very close to the highest, it indicates that there has been a large accumulation, a buying pressure is generated so the CMF indicator will be positive. As can be seen in the image of the TRX - USDT chart, when the CMF indicator crosses the line marked by 0 and grows, being closer to +1, the buying pressure is greater and consequently the price increases.
Otherwise, when it starts to approach -1, the selling pressure is greater and the price falls. This is because the CMF, having negative values, indicates that a greater distribution has been generated and generates a selling pressure in the trend.
Now, with this information that the CMF indicator gives us, we can determine possible buy and sell signals. Analyzing the same image of TRX - USDT, we can basically observe that: When the indicator goes from negative to positive, it is a buy signal, while when the indicator goes from negative to positive, it is a sell signal.
However, many times it is not convenient to carry out an entry - exit as soon as a change of the indicator to positive - negative, or negative - positive has been achieved. Because a case like in the following image can also happen from TRX - USDT
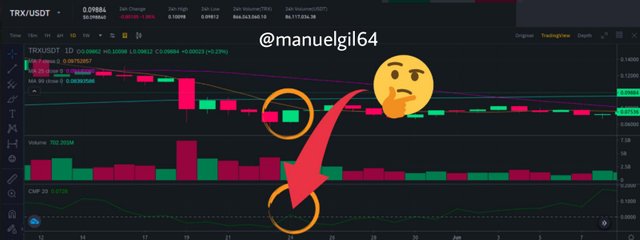
At the point where it is marked, the CMF indicator goes from negative to positive for a brief moment, but then it changes direction and decreases.
So it was a good entry point? In my opinion, no, because with this abrupt change in direction there is a risk that the price changes direction and continues to fall (in addition, it is not a good idea to consider a single indicator, a good trader knows that you have to use several).
For what the professor mentions again in his article, it is smart to handle the signals with wider lines, which could be between +/- 0.1, +/- 0.15 or +/- 0.2, which seeks that the signal has greater robustness.
Trade with a crossover signal between the CMF and wider lines such as +/- 0.1 or +/- 0.15 or it can also be +/- 0.2, identify the most important signals that can be extracted using several examples
Now, as we mentioned before, it is not a good idea to carry out an entry - exit as soon as the CMF indicator crosses the 0 line, it is convenient to wait in a range of 0.1, 0.15 or 0.2 with respect to the 0 axis to obtain greater robustness of the signal.
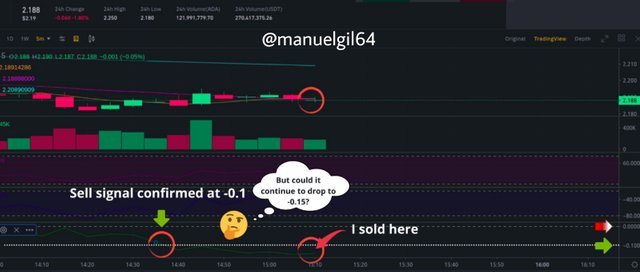
In this example with the ADA - USDT chart, in 5-minute candles and the 36-period configuration of the CMF, we can see how around 1:00 p.m. the price fell and crossed the zero line, the indicator already obtaining a negative value, however I decided to wait for the price to fall below -0.10 to make the sale of 8.5 Cardanos (ADA).

However, despite the fact that it was able to pass from -0.10, I decided to keep waiting in case it continued to fall below -0.10, and in fact, just at that moment a divergence occurred: The price began to rise while the indicator fell, until that at a point near -0.15 I made the sale.

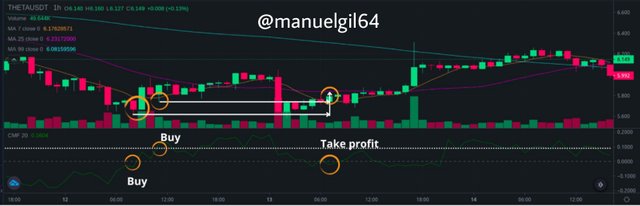
On October 12, I made two buy operations on the THETA_USDT chart, one when the price was at $ 5,680 as soon as the CMF indicator went from negative to positive at 08:33, and another at 13:25 at $ 5,776 when the CMF indicator went up from +0.1 to +0.15, however at +0.12 it began to recede and there I go back in, waiting for an increase again, which then happens. My take profit was executed on October 13 selling Theta at the price of $ 5,888 and $ 5,828.
Two important things that I want to highlight in this operation were: My entry strategy was divided into two: One entering only the CMF crossed from negative to positive, and another below +0.15, and although it did not arrive, at least I entered above + 0, 10. Then the price goes down along with the CMF chart, so before having zero profit or loss, there could have been an opportunity to sell just as the indicator went from positive to negative, however I decided to wait, taking advantage of the divergence between the indicators. CMF (went down) and the price (went up), even at one point the indicator went from negative to positive for an instant, then it decreased and when the indicator turned negative, I decided to sell.

How to trade with divergence between the CMF and the price line? Does this trading strategy produce false signals?
We can consider the divergences as an aggregate observed in the CMF as well as in many other indicators, which, whether trending up or down, represent a possible change in price, since the momentum can be transformed exactly into the reverse trend.
So, by observing the divergences between the volume of securities and the price in our indicator, we can have some assurance that the value of the price weakens and the reversal becomes a fact, as we saw it in past classes.
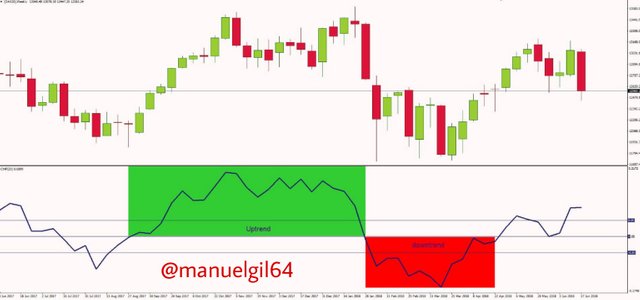
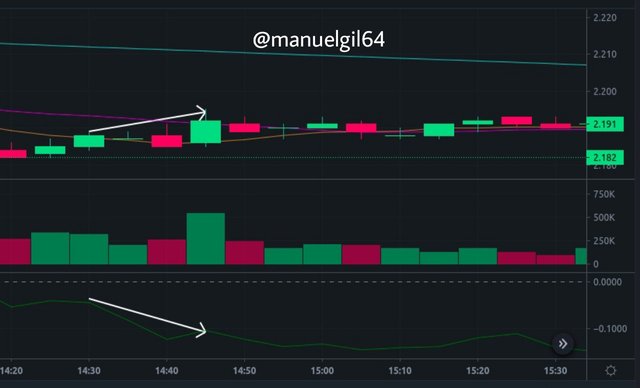
In this way, if we observe for example that the value of the CMF registers a divergence when having high points while the price is low, we can expect an uptrend to be created since the previous one is losing momentum. As we can apply the same logic in the opposite case, where we will see how a turn can be generated and obtain a downtrend, as we can see in the following image.
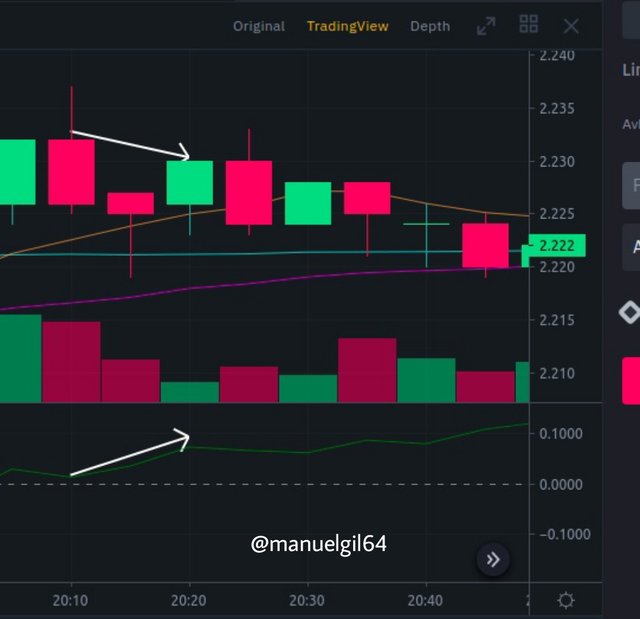
Therefore, we can affirm that as there is a large volume that is observed in the values of the trend, we will see a new price in the reading that reflects the CMF which can give us good opportunities.
On the other hand, it could not ensure that they provide false signals because as can be seen in the charts, when a divergence occurs we observe that a trend change follows, so we could interpret it as an additional contribution of the indicator since it alerts us of future changes.
However, as a good trader, I consider that we cannot fully trust an indicator since each one carries its risks, so it must be taken into account that, if there were to be a bullish divergence, we should not rush and make immediate decisions as the selling pressure can be positioned at the bottom, so you have to wait for it to enter the top and thus take it as a buying pressure.
Conclusions
Finally, as we have seen in this article, the Chaikin Money Flow indicator helps us measure the accumulated amount of existing money flow as well as changes in the volume balance, so that we can use it to determine the buying pressure or sale that best suits, depending on the situation that arises, and thus we can better visualize by locating the central zero line and understanding the indications that it presents thanks to the price values, positive or negative, that are developed.
Likewise, it is considered an indicator that provides profitable strategies thanks to the detection of possible trend changes, such as with the use of divergences, in the same way that it uses the impulse of large trends, which produces greater credibility at the time of operate and expect satisfactory results.
However, the use of other fundamental indicators can be added to this indicator so as to reduce the possibility of false signals and increase profits according to the action taken, due to the mix of tools that operate under it. idea of operation, it can be a very efficient strategy that shows fluctuations in the flow of money thanks to the combination of non-independent indicators.
This is my Homework Post for Crypto Trading with Chaikin Money Flow Indicator || Crypto Academy S4W6 || Professor @kouba01


twitter-promotion
Hello @manuelgil64,
Thank you for participating in the 6th Week Crypto Course in its 4th season and for your efforts to complete the suggested tasks, you deserve a Total|6/10 rating, according to the following scale:
My review :
Work with acceptable content. It was possible to go deeper into the ideas presented and provide several examples. Here are some notes that I bring to you.
You did not provide a clear example of how to calculate the value of CMF.
You did not interpet how to choose the appropriate settings for the periods.
You did not go into depth in answering the second question, as you did not explain how to determine the entry and exit points.
Thanks again for your effort, and we look forward to reading your next work.
Sincerely,@kouba01
Congratulations, your post has been upvoted by @dsc-r2cornell, which is the curating account for @R2cornell's Discord Community.
Enhorabuena, su "post" ha sido "up-voted" por @dsc-r2cornell, que es la "cuenta curating" de la Comunidad de la Discordia de @R2cornell.