Steemit Crypto Academy Week 14 - Homework Post for @fendit | by @mandate
ELLIOT WAVE THEORY (EWT)
Elliot wave theory which acronym is EWT is another technical analysis tool that was developed by Raphel Elliot Nelson, in the 1930s. He came about this theory after he observed the trend of the market for a very long period of time and noticed a certain pattern in the market.
The theory became quite popular in 1935 when Elliot made a market prediction which was pleasing to the eyes of investors and traders. He then later published a book as regards the theory.
This theory is based on the psychological reasoning of investors which gives the pattern of wave in the market. This theory enables one to predict the price of a asset in the market or to get a signal for traders.
This theory is further splitted into two which is the
1 impulsive waves and
2 the corrective waves.
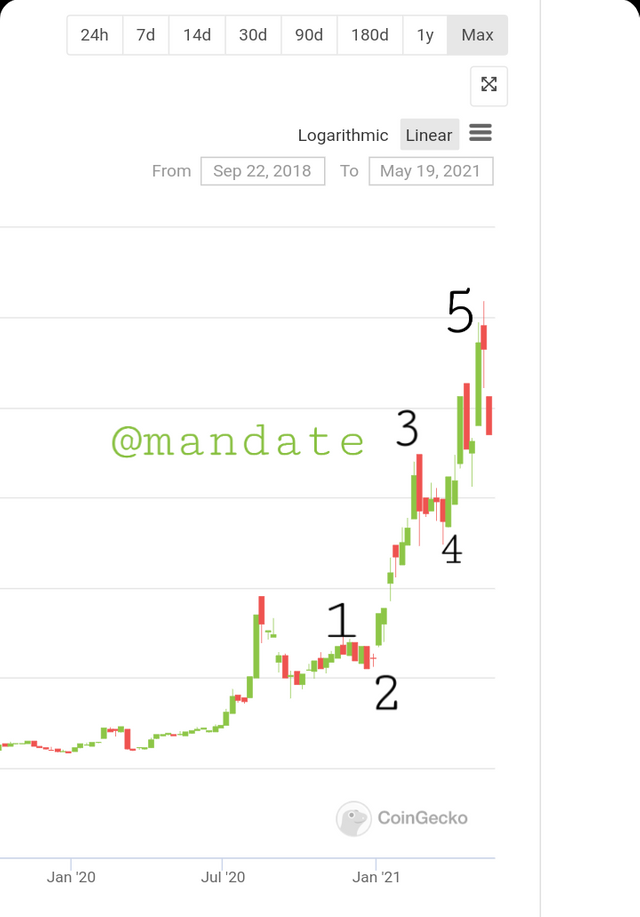
Impulsive waves
The impulsive waves according to Elliot consist of five movement in the same direction called sub wave.
This can either be in regards to a bearish or bullish market and its the most common motive and very easy to spot. There are three rules which guide this impulsive waves.
1 Wave 2 cannot move lower than wave 1on it's downward movement
2 Wave 3 is always the longest wave among wave 1, 3 and 5
3 Wave 4 can't go any lower than wave 3 in any case.
Note: if studying a trend and any of these rules are broken the trend isn't an impulsive wave.
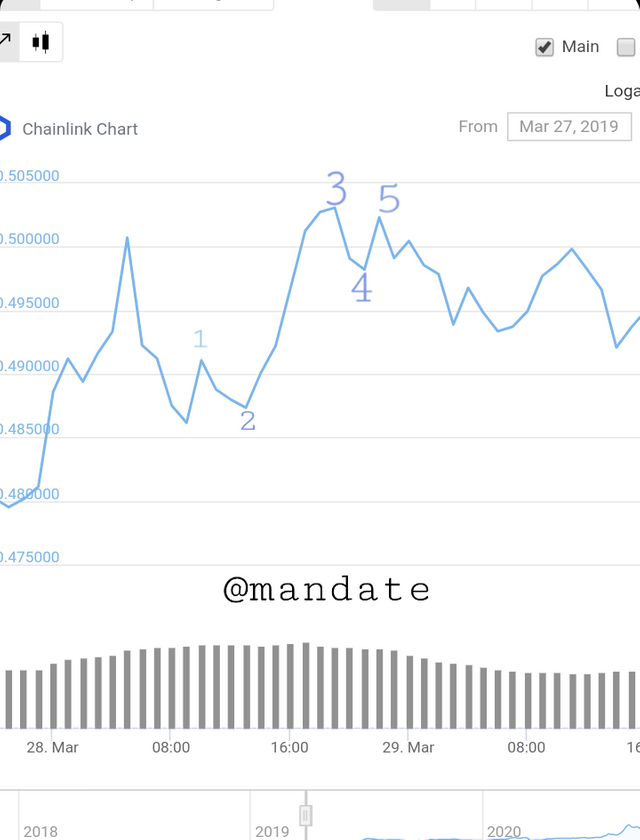
Interpretation of the Waves
Wave 1: this is caused by early investors who gets the news about the coin first and invest in it which causes a rise in price.
Wave 2: the investors takes profit from the market which causes a little regression in the price of the coin.
Wave 3: the news about the coin is flying which will bring in more investors, this cause a very high rise in the price because alot of people are rushing to get the coin.
Wave 4: there will be a fall in price again due to investors taking profits from the market, at this point there are traders and investors who don't what to miss out and are eager to join in which leads to
Wave 5: there is a little rush in the market by those who FOMO which makes the price goes up agin, unfortunately these set of people are buying high.
Corrective wave
This is the following sub waves after the impulsive waves. They are usually in the direct opposite of the impulsive waves.
The corrective waves are represented by the letter a.b and c above. The waves can be in 3 forms.
Zig zag; this is the easiest to spot and the most popular. In this case wave B is always the shortest of all and A and C goes in the same direction.
Flat: this is when the waves are of the same length.
Triangle; this signifies that there is reduction in volatility and volume of the coin.
NOTE: The corrective waves comes after the impulsive which are usually the following 3 waves of the trend movement.
The 8 movement makes up what is called EWT.
APPLICATION OF ELLIOT WAVE THEORY
The main application or use of Elliot wave theory is trading assets. This theory helps to identify two things
1 When you buy an asset: if the trend is carefully studied a trader will know when it is a good buy or not. The trader will know when he is about to buy at the top and won't enter the trade so as not to incur loss.
2 It also helps to know when to sell am asset: it prevents the trader from buying high and selling low. Most traders aren't always careful and end up selling lower than they bought due to some reasons.
This theory also helps a trader to know when to place a stop loss when trading.
Conclusion
Elliot wave theory is a great tool which every trader should learn how to use. This tool is effective in giving a trader the signal of taking a long position in a market at a particular time following the trend of the market and also allows the trader to know when the market will retract back and go short as well.
Indicators similar to Elliot theory has been made by analyst and it's available on most trading platforms for traders.
.
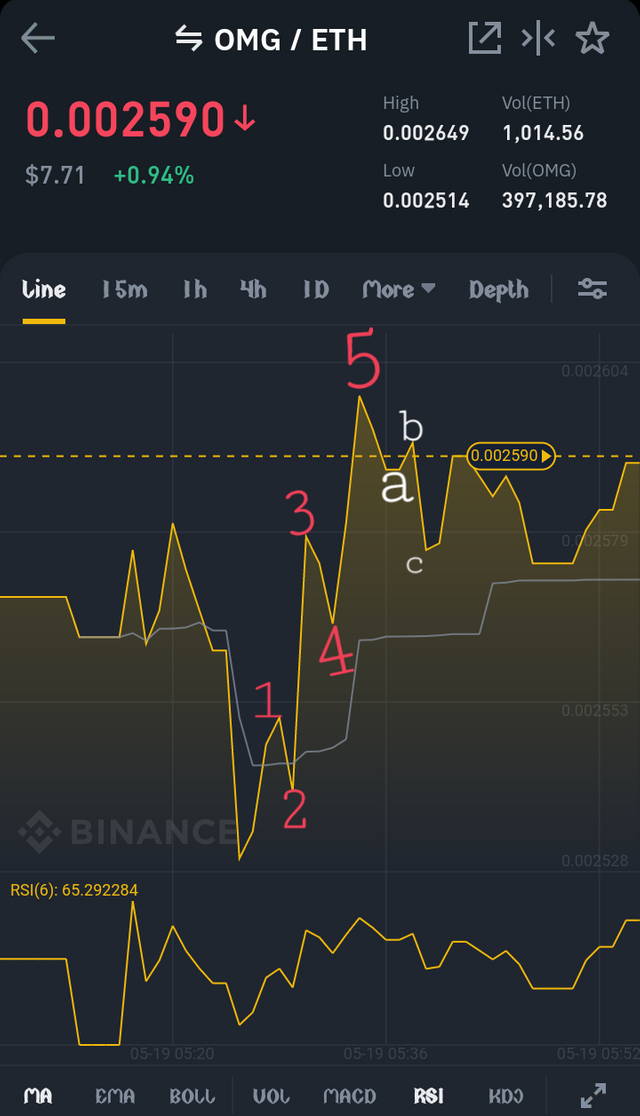
COINCHART FOR OMGETH

This coin chart is the one for OMGETH pair. It is a chart for may 19 2021 showing a uptrend, this is a typical Elliot wave theory which was displayed by the pair this morning. It shows how the trade did a rapid rise due to investors taking advantage of the dip in the previous market, after the investors invested there was a sharp rise in the and traders took their profit which is shown in wave 2.
Then traders bought into the market again this time a great number of traders bought into it which caused a high rise in the price of the pair then traders took profit from the market. Immediately there was a dip the market was bought again by other traders who missed the first door which also caused another rise in the price of the pair as shown in wave 5.
Then the corrective waves came in, by stabilizing the market back to it's normal level. A drop in wave A then a sharp rise and then another drop in wave c. This chart has shown that anyone who wants to trade after the corrective wave c can opt in the market.
Thank you for stopping by to read my article.
If you actually like what you see😃😄😉,watch📷📺📸 and read📖📋 I would equally be grateful for an upvote♥️⚡ a very cool comment under my comment box or a reblog 🌀😏 for everyone to see ... and perhaps maybe you would like to follow me for more of my Post to show on your own feeds. Don't miss any of my Post.🔝. Special thanks to all who put big smiles on my face with Auto Upvote for always being supportive to me 💞💯.
Best regards
Written by @mandate
THANK YOU!
Hello professor @fendit
My post have not yet been verified @fendit
@fendit
@fendit
@fendit
@fendit
My post will payout soon but still yet to be verified