Trading with Contractile Diagonals - Crypto Academy /S4W3 - Homework Post for Professor @allbert.
Hello everyone, a warm salute to this week's lesson series. The lesson taught by professor @allbert was about Trading with Contractile Diagonals. In this post, I present the homework given at the end of the class.
1- Define in your own words what a contractile diagonal is and why it is important to study it. Explain what happens in the market for this chart pattern to occur. (Screenshot required / Bitcoin not allowed)
In Financial markets, a trend reversal phenomenon that occurs can be called a contractile diagonal. Price movement tends to converge at a near point before reversing in the opposite direction. As with all indicators, the contractile diagonal setup must meet certain conditions before it can be considered a high-quality trade setup.
The contractile diagonal contains two lines drawn diagonally, such that either both or one of the lines is converging. Ideally, the contractile diagonal is similar to the Elliott wave, where price formation constitutes waves 1,2,3,4,5. Wave Points 1,3,5 is set apart by impulsive moves (trend moves) that correspond with the current trend, while wave Points 2,4 are set apart by corrective movements (pullbacks) that move in the opposite direction.
This pattern is a great tool used to predict price action. After showing you the contraction in price action, there is always a sizeable uptrend or downtrend. Contractile diagonal usually signifies a reversal in the trend of a given asset, hence why we study it.
In a Bullish trend, the contractile diagonal waves form, such that Points 1,3 and 5 make higher highs, with Point 3 higher than Point 1 and Point 5 is higher than Point 3. Similarly, point 2 and 4 make higher lows meaning Point 4 is higher than Point 2. Therefore, this creates a compressing price formation with each bullish wave getting smaller before a bearish breakout below the lower diagonal line.
In a bearish trend, the contractile diagonal waves form, such that points 1,3,5 make lower highs, with point 3 lower than Point 1 and Point 5 is lower than Point 3. Similarly, point 2 and 4 make lower lows, with Point 4 lower than wave 2. As a result, a compressing price formation with each bearish wave getting smaller before a bullish breakout above the upper diagonal line.
What happens in the market for contractile diagonal to occur?
Occurrences in charts usually tell us something about market participants. When we are in an uptrend, it means that buyers are taking control of the market, and when we are in a downtrend, it means that sellers are more dominant in the market. But when contractile diagonal occurs, the market is not solidly dominating in one direction, as they are indecision by market participants. As the market condenses, traders get demented on the way the market will go next. Pressure begins to mount when buyers and sellers are both vigorously participating. So, when indecision constantly loads up in the market, contractile diagonal tends to occur in a chart.
2- Give an example of a Contractile Diagonal that meets the criteria of operability and an example of a Contractile Diagonal that does NOT meet the criteria. (Screenshot required / Bitcoin not allowed)
Contractile Diagonal Criteria
Below is a criterion for a contractile diagonal pattern to be operable that's to say;
Operable Contractile Diagonal
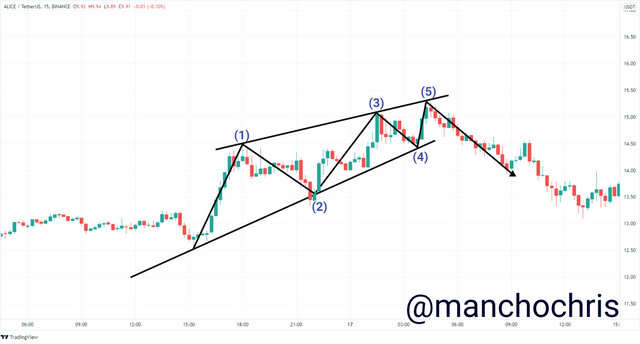
The Operable contractile diagonal are formations that satisfy all the above-listed criteria. To illustrate this, observe the chart below.
From the above chart, we can all agree that the contractile diagonal satisfied the required criteria. Point 3 makes a higher high compared to Point 1. Point 5 also makes a higher high compared to Points 3 and 1. Similarly, Point 4 makes a higher low compared to Point 2. The diagonal line traced between Points 1 and 3 is perfectly joined. While the diagonal line traced between Point 2 and 4 is also perfectly joined. Finally, Points 1, 3, 5 and Points 2, 4 are converging upwards. Therefore, the compressing formation of price symbolizes the reducing strength of buyers in the market.
Non-Operable Contractile Diagonal
The Non-Operable contractile diagonal are formations that do not necessarily satisfy all the above-listed criteria. To illustrate this, observe the chart below:
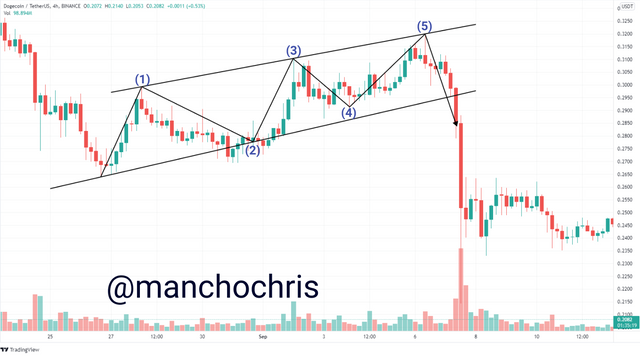
From the above chart, it's clear that Point 1 is lower than Point 3, which nullifies the satisfaction of the criteria required of a contractile diagonal. As seen, the trend reversal after the establishment of the contractile diagonal played out as anticipated. However, this didn't fulfil the required criteria.
3- Through your Verified exchange account, perform one REAL buy operation (15 USD minimum), through the Contractile Diagonal method. Explain the process and demonstrate the results and graphical analysis through screenshots. Your purchase data must match your analysis data: such as cryptocurrency and entry price.
Buy Order AVAXUSDT:
From the technical analysis, which I made on the AVAXUSDT chart using this indicator. I entered a buy order on the AVAXUSDT market.
From the image above, I identified a falling contractile diagonal pattern on the AVAXUSDT chart. After drawing the diagonal lines, the wave patterns were confirmed and numbered 1-2-3-4-5. The contractile diagonal satisfied the criteria for a verifiable contractile diagonal pattern.
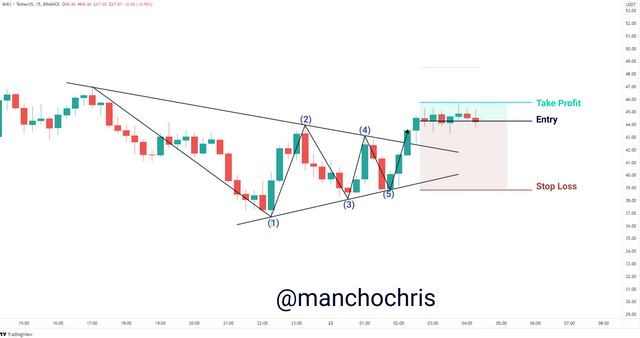
As expected, the price on the chart broke the trendline to signal a trend reversal. Therefore, I entered a buy order after the breakout candle.
4- Through a DEMO account, perform one sell operation, through the Contractile Diagonal method. Explain the process and demonstrate the results and graphical analysis through screenshots. Bitcoin is not allowed.
Sell Order AVAXUSDT:
From the technical analysis, which I made on the AVAXUSDT chart using this indicator. I entered a sell order on the AVAXUSDT market.
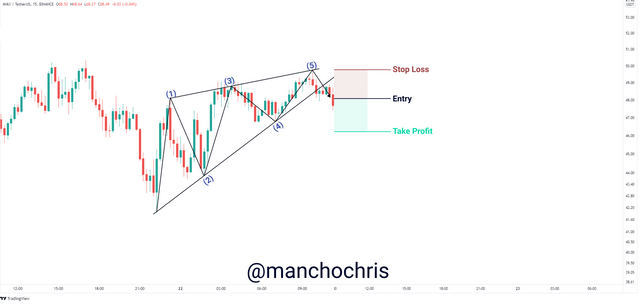
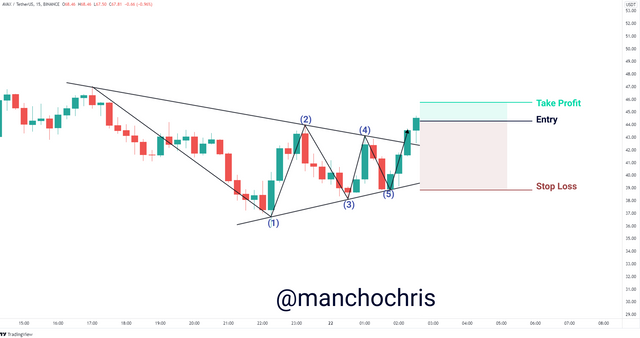
From the image above, I drew a contractile diagonal on the AVAXUSDT chart. After which, the wave patterns numbered 1-2-3-4-5 were formed. The contractile diagonal satisfied the criteria for a valid contractile diagonal pattern.
As expected, the price on the chart broke the trendline to signal a trend reversal. Therefore, I entered a sell order after the breakout candle. Stop-loss was set at Point 5 and Take-profit somewhat above Point 2, as shown below.
5- Explain and develop why not all contractile diagonals are operative from a practical point of view. (Screenshot required / Bitcoin not allowed)
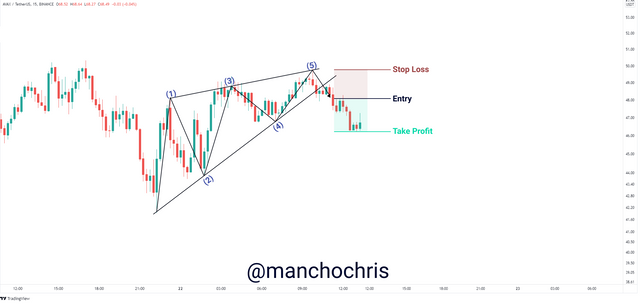
In trading, it is obvious to plan to make more than what you risk, and anything other than that is not a good risk management practice. When it comes to contractile diagonal, the purpose is to find a high-quality setup that will increase your chances of Profit. Although some contractile diagonal patterns meet the criteria, they are not operative as they give an unfavourable risk/reward(R/R) ratio.
The stop-loss and take-profit are fixed at strategic
points since contractile diagonal does not use the typical 1:1 R/R ratio. For this reason, it produces an unfavourable risk to reward ratio. Therefore, the operability of contractile diagonal in some setups is much risk for the trader.
In the above diagram, the contractile diagonal satisfies the requirements addressed. However, it is not operative because the stop-loss is about three times the take Profit, making it an adverse R/R ratio which is not practically a favourable risk management trading.
Conclusion:
Contractile diagonals are technical analysis indicators used to predict trend reversals in financial markets. The patterns have requirements that a high-quality setup must follow to make it operative. However, this indicator may sometimes produce a structure that is not favourable to the trader as the risk may be higher than the reward.
You have been curated by @yohan2on, a country representative (Uganda). We are curating using the steemcurator04 curator account to support steemians in Africa.
Keep creating good content on Steemit.
Always follow @ steemitblog for updates on steemit