[Heikin-Ashi Trading Strategy]-Steemit Crypto Academy | S4W2 | Homework Post for @reddileep
Hello, fellow Steemians!
Welcome to yet another exciting week of the crypto academy. This week I attended a lesson by professor @reddileepon about the Heikin-Ashi Trading Strategy. In this post, I discuss the homework given by the professor at the end of his lesson.
Define Heikin-Ashi Technique in your own words.
Let's first understand the keywords that are Heiken and Asi. In Japan, the word Heiken means average for balance, Asi means bar per foot. Heikin-Ashi means average bar resonating with the trading technique that uses the typical price of an asset.
So, we will define the Heikin-Ashi Technique as a visual representation that clearly shows trends, consolidations, and reversals. More importantly, it's a quantifiable technique that's easy to implement and use. This system uses average price data to filter the worth noise of an asset. The absence of price noise; results in a transparent illustration of price trends and direction that helps determine potential price movements.
This trading technique assists traders in identifying once they should hold on to a trade, pause, or see if a reversal is close to occurring.
Make your own research and differentiate between the traditional candlestick chart and the Heikin-Ashi chart. (Screenshots required from both chart patterns)
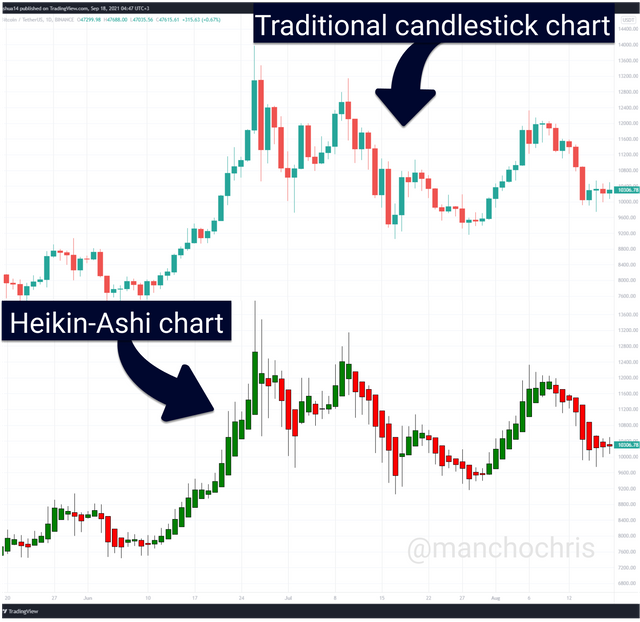
From the above diagram, one can easily spot the difference between the Heikin-Ashi chart and the traditional Japanese candlestick chart without that much focus. In this part of the post am going to talk about the difference between the two charts:
The traditional candlestick chart and the Heikin-Ashi chart are different in that the latter candlesticks are created as a result of mathematical calculations and the traditional candlesticks are created basing on the opening and closing price of an asset in a specified time frame.
From the above diagram, the Heikin-Ashi chart makes it easier for a trader to spot trends and reversals because it filters out price noise resulting in trends, consolidations, and reversals are more visible to the naked eye. Meanwhile, spotting trends and reversals on a traditional candlestick chart is a bit difficult.
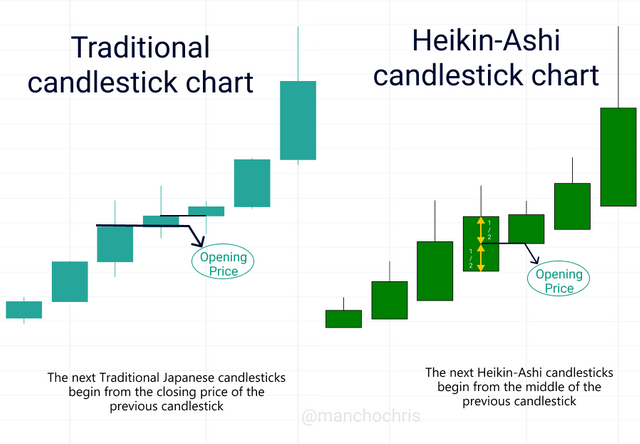
The other difference between the Heikin-Ashi and the traditional Japanese candlestick chart is the way each candlestick is displayed in relation to the previous. The Heikin-Ashi candlesticks begin from the middle of the previous candlestick and not from the closing price of the previous candlestick as the traditional Japanese candlestick chart shows. The Heikin-Ashi candlesticks are displayed that way because the prices in the Heikin-Ashi chart are expressed as the averages of the previous candlestick prices.
In a Japanese candlesticks chart, the colours change more frequently as they depend on the open and close price of a single candle in a specific time frame. Whereas, in the Heikin-Ashi chart, the colours only change if there is a reversal in the market trend with greater clarity.
Explain the Heikin-Ashi Formula. (In addition to simply stating the formula, you should provide a clear explanation about the calculation)
In our previous question, we talked about Heikin-Aish candlesticks being calculated based on the price of the current period. So, it is time to dig deeper and understand these formulas used in the calculation of the Heikin-Aish candlesticks.
Recall:

From the formula above, we can now see why the open price of the next candle always starts halfway from the previous candle. The reason is the Open price of the new candle is an average of the open and close of the previous candle. This formula, therefore, helps to differentiate the Heikin-Aish candlestick chart from the traditional candlestick chart.
Recall:

The Heikin-Aish High is not computed any different from the way it is calculated in the traditional candlestick chart. So, it’s, therefore, the highest price an asset has reached in a specific time frame. This price is computed by comparing the Open, Close, and High prices of the current candlestick on the traditional candlestick chart for the highest price/value.
Recall:

The Heikin-Aish Low is simply the opposite of the Heikin-Aish High. So here we are looking for the lowest price an asset has been sold or bought at in a given time-frame (say H1, H4 and others). It is computed by determining the lowest price/value among these three prices; Open, Close, and Low prices of the current candlestick on the traditional candlestick chart.
Recall:

Finally, we shall talk about the Heikin-Aish Close price. As seen from the formula, the Closing price is expressed as an average of the Open, Close, High and Low of the current candlestick on the traditional candlestick chart.
Graphically explain trends and buying opportunities through Heikin-Ashi Candles. (Screenshots required)
Recall from our discussion of question 2 in this homework:
Heikin-Ashi chart makes it easier for a trader to identify trends and reversals because it filters out price noise leading to trends, consolidations, and reversals being more visible to the eye.
Let’s talk more about these trends in detail.
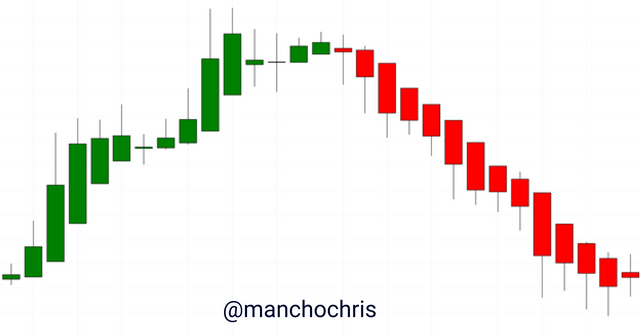
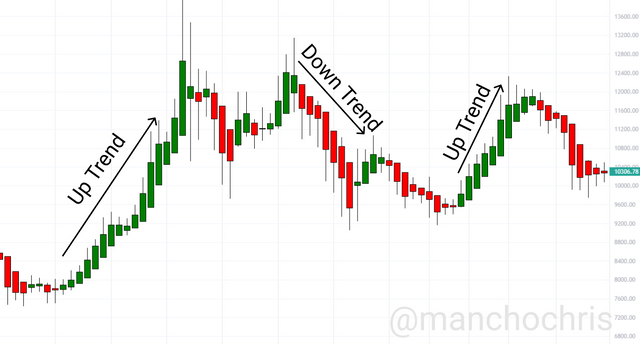
Uptrend:
This is often when the candlesticks on the Heikin-Aish are making higher highs and higher lows. In this scenario, the simplest trades to be made are long trades. That’s to mention, the trader buys an asset with expectations of its increase.
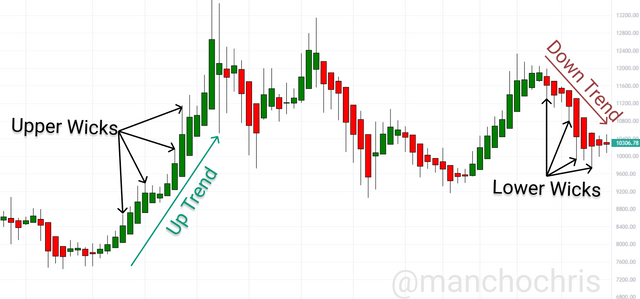
During an uptrend, the candles have upper wicks which are on top of every candlestick as the trend weakens with time. The Bearish candles begin to draw lower wicks. This could therefore be an indicator to the trader that the trend is close to change so he/she should get out of the trade. However, the trader should wait for two consecutive candles of a special color (in this case red candlesticks) to be formed so as he/she can end the trade.
Downtrend:
This type of trend occurs when the candlesticks on the Heikin-Aish chart are making lower highs and lower lows. during this trend, the simplest trades to be made are short trades. That’s to mention, the trader sells a commodity with expectations of a price decline within the near future.
During a downtrend, the candles have lower wicks which may be found at the rock bottom of every candlestick as the trend weakens with time, the Bullish candles begin to urge upper wicks. this could therefore be an indicator to the trader that the trend is close to change so he/she should get out of the trade. However, the trader should wait for two consecutive candles of a special color (in this case green candlesticks) to be formed so as he/she can end the trade.
Below is a chart that will briefly summary whatever I have been talking about above.
Is it possible to transact only with signals received using the Heikin-Ashi Technique? Explain the reasons for your answer.
Yes, it is possible to transact only with signals received using the Heikin-Aish Technique. However, this will not always yield a high-quality trades setup. This means that some signals may give you a wrong interpretation or may be inaccurate, hence leading to losses as trades will not be going to your plan.
So, to increase the accuracy of the Heikin-Ashi Technique signals, we need to add on an indicator called the Exponential Moving Average (EMA). The 21-EMA and 55-EMA will help the trader to confirm the signal from the Heikin-Aish indicator. Since they say two heads are better than one, so is the Heikin-Aish and EMA indicators combined.
By using a Demo account, perform both Buy and Sell orders using Heikin-Ashi+ 55 EMA+21 EMA.
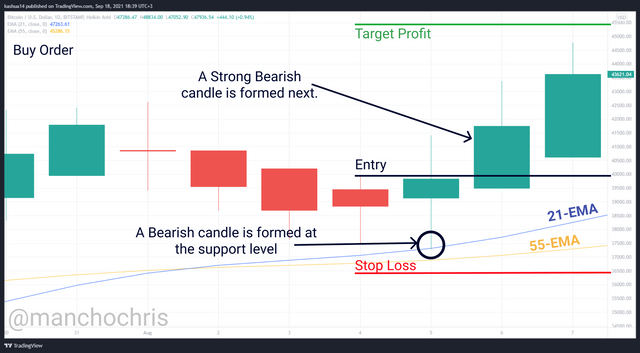
Buy Order:
From the BTC/ USD chart below, if you look closely, you will notice a high-quality trade whereby a bearish candle just touches the support level (21-EMA). Since the 21-EMA is greater than the 55-EMA and a bearish candle is formed at the support level (21-EMA). This may indicate a buy signal.
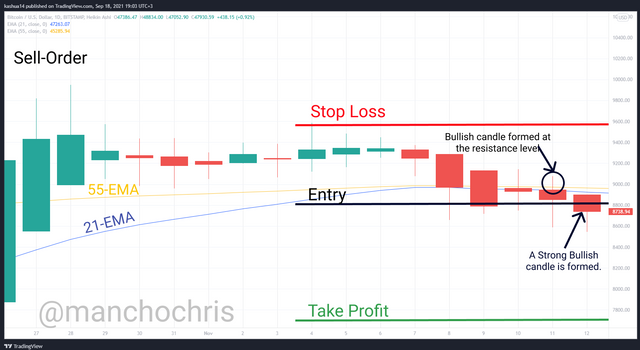
Sell Order:
From the BTC/ USD chart below, if you look closely, you will notice a high-quality trade whereby a bullish candle just seats at the resistance level (55-EMA). Since the 21-EMA is less than the 55-EMA and a bullish candle is formed at the resistance level (55-EMA). This may indicate a sell signal.
Conclusion:
I have enjoyed this lesson on the Heikin-Ashi chart for its clarity and cleanliness. Thank you, Professor @reddileep, for giving me the chance to indulge it. The strong bullish or bearish clarity of this chart allows the trader to possess greater confidence with the decision of a buy or sell entry. However, it is always good to not rush and consider other indicators like the 55-EMA and 21-EMA.