Crypto Trading Using TRIX indicator || Steemit Crypto academy || S6W3 || Homework post for prof @kouba01 by @malikusman1


Discuss in your own words Trix as a trading indicator and how it works.

The TRIX indicator was created by Jack Hutson. In the early 1980s, he designed it to display the rate of change in a triple exponentially smoothed moving average. The triple exponential average (TRIX) indicator is a momentum indicator that can be used to identify oversold and overbought markets. Many analysts feel that the TRIX delivers a buy signal when it crosses above the zero line and a sell signal when it closes below the zero line.
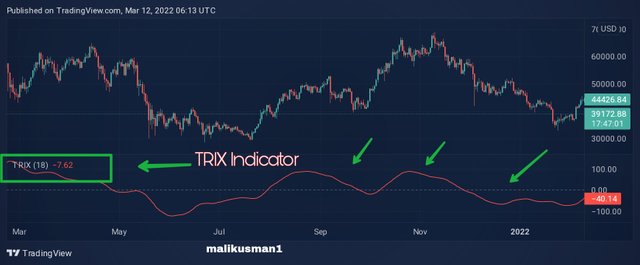
The triple exponential average (TRIX) is also a momentum indicator that shows the percentage change in a moving average that has been smoothed exponentially three times. It is used by technical traders. Price changes that are regarded small or irrelevant are filtered out using the triple smoothing of moving averages. Technical traders use TRIX to provide signals that are similar in nature to the moving average convergence divergence (MACD).
For the current bar, TRIX generates a triple exponential moving average of the log of the price input over the time period indicated by the length input. The value of the current bar is deducted from the value of the preceding bar. This stops the indicator from considering cycles that are shorter than the time indicated by the length parameter.
- Working
TRIX is a powerful oscillator indicator that may be used to identify markets that are oversold or overbought, as well as a momentum indicator. TRIX oscillates around a 0 line, as do many oscillators. An extreme positive value suggests an overbought market, whereas an extreme negative value indicates an oversold market when employed as an oscillator.
A positive result for TRIX indicator show that momentum is rising, while a negative value show that momentum is reducing. Many analysts feel that the TRIX delivers a buy signal when it crosses above the zero line and a sell signal when it closes below the zero line. Any gap between price and TRIX can also signal key market turning events.

Show how one can calculate the value of this indicator by giving a graphically justified example? how to configure it and is it advisable to change its default setting? (Screenshot required)

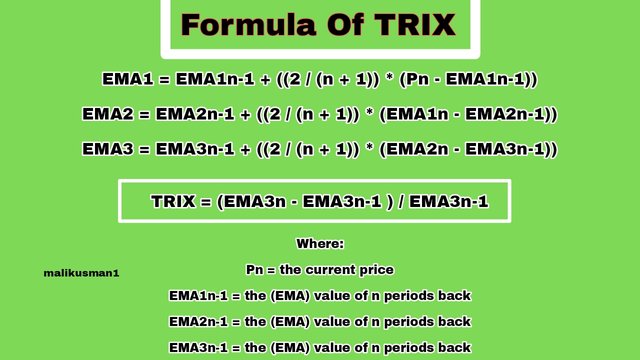
Technical indicators in crypto, stock, and other financial markets, as we all know, are based on calculations derived from various points in the past data. So, let's see how we can calculate the TRIX indication now. The TRIX indicator is made up of three exponential moving averages, as I previously described. So, now I calculate the formula of TRIX.
- Formula of TRIX Indicator:
Exponential moving average 1 = EMA1n-1 + ((2 / (n + 1)) * (Pn - EMA1n-1))
Exponential moving average 2 = EMA2n-1 + ((2 / (n + 1)) * (EMA1n - EMA2n-1))
Exponential moving average 3 = EMA3n-1 + ((2 / (n + 1)) * (EMA2n - EMA3n-1))
TRIX Calculation = (EMA3n - EMA3n-1 ) / EMA3n-1
Where:
Pn = the current value
EMA1n-1 = the exponential moving average (EMA)value of n periods back
EMA2n-1 = the exponential moving average (EMA) value of n periods back
EMA3n-1 = the exponential moving average (EMA) value of n periods back
- Chart Setting
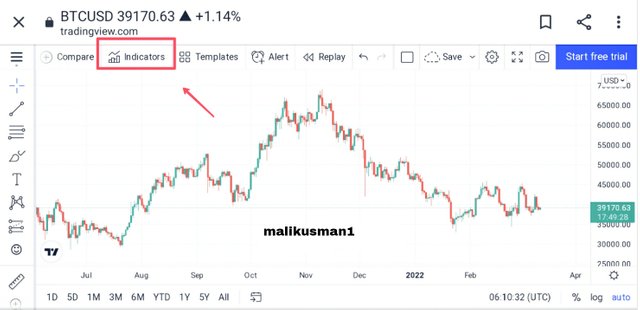
I open the Tradingview website to configure the TRIX indicator on the chart.
I then go to the BTC/USD chart and select the indicators option.
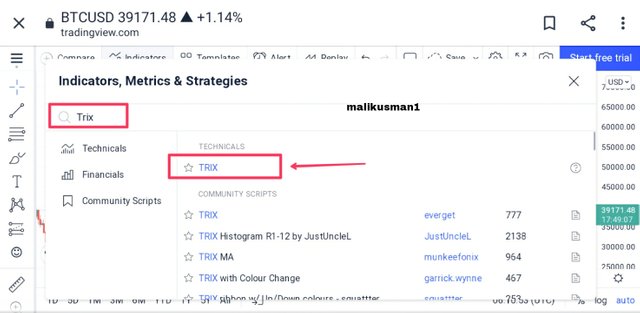
Next, I use the search bar to find TRIX indicator and open it.
After that, I choose this indication setting and enter 18 as the length.
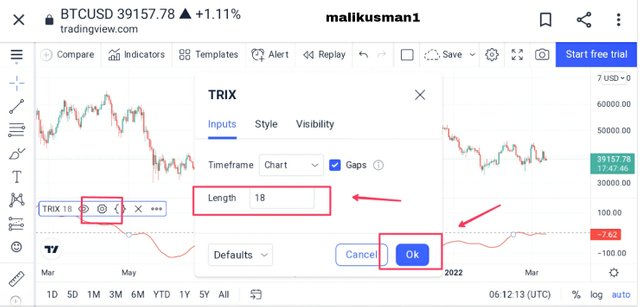
After that I has successfully draw the TRIX indicator on the BTC/USD chart.
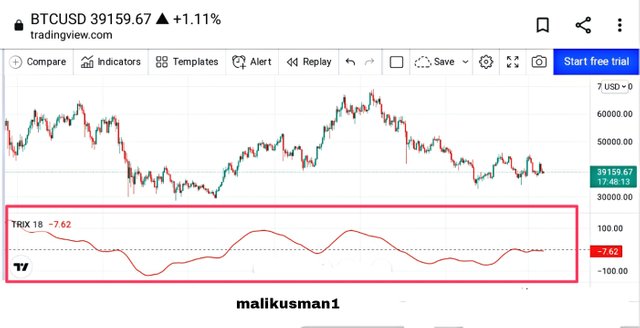
So, this is the setting of TRIX indicator on the BTC/USD chart that i do. Though, unless you are an experienced trader who has used this indicator before, I do not recommend changing these parameters.

Based on the use of the Trix indicator, how can one predict whether the trend will be bullish or bearish and determine the buy/sell points in the short term and show its limits in the medium and long term.(screenshot required)

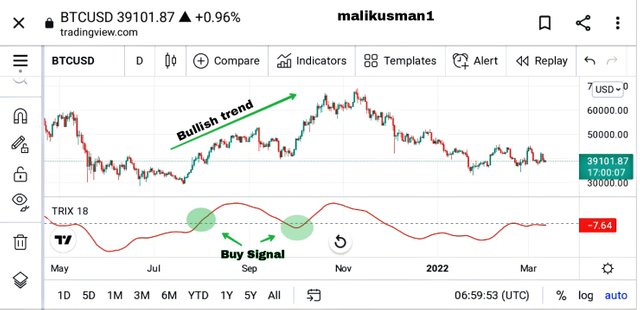
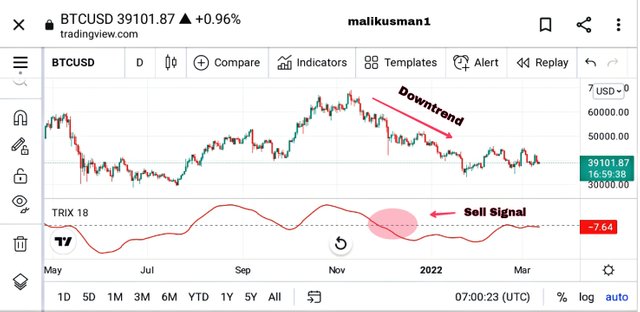
By merely looking at the crossing of the Trix line over and below the centre point, which is zero, the Trix indicator can be used to anticipate whether the trend will be positive or negative. The Trix line above the point zero indicates that the trend will be positive, while the Trix line below the point zero indicates that the trend will be negative.
When the Trix line crosses and moves above the middle point, it is a signal to place a buy order. As you can see in the screenshot below, the TRIX line is above zero, indicating that it is time to buy.
When the Trix line crosses and moves below the middle point zero, it is a signal to place a sell order. As you can see in the screenshot below, the TRIX line is below zero, indicating that it is time to sell.
- Trix Indicator for short, medium, and long term basis
Seeing the Trix indicator over a short period of time, such as 5, 15, and 30 minutes, might be highly confusing. The reason for this is that a large number of signals will be generated in close proximity to one another, making them difficult to decipher.
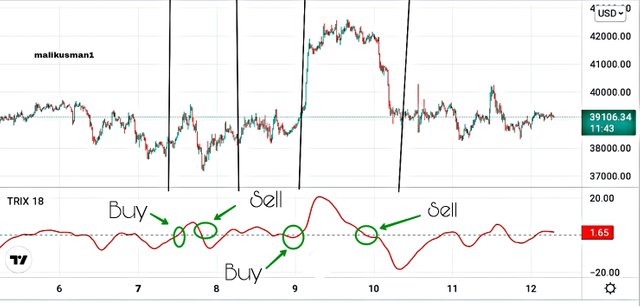
The screenshot above depicts a price chart with a short time frame of 30 minutes and numerous buy and sell signals. Traders typically use this interval for short-term profit and trading.
When looking at the Trix indicator on a longer time frame, such as period 18 or 1 day time frame, it can be a more apparent trade because in huge time frame exit and entry points are more obvious than small time frame.
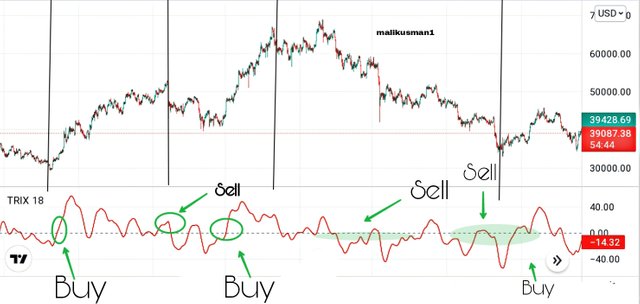
The screenshot above shows a medium to long time frame price chart with periods of 18 and 1 day. Only the major points of buy and sell orders are considered in the chart, and all other minor points are discarded. Traders make a greater profit in this scenario, but it takes a lot of time.

By comparing the Trix indicator with the MACD indicator, show the usefulness of pairing it with the EMA indicator by highlighting the different signals of this combination. (screenshot required)

We discovered some crucial signal points utilising the Trix indicator in the previous questions. This can be accomplished by filtering the signal with a 9-period EMA of the Trix indicator. We can get a line signal that is similar to the MACD using this method. On the Trix indicator, we'll take the same strategy as the MACD crossover signal.
To see the difference between the two indicators, let's compare the signal information discussed with that of MACD. So, using a fifteen period Trix, I'll be utilising a nine period moving average signal line. The chart will be compared to the moving average convergence divergence (MACD) with default periods of (12, 26, 9) as shown in the chart beĺow.
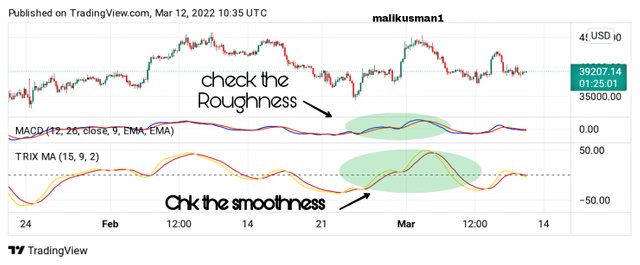
The Trix indicator has a smoother line signal than the MACD indicator, as shown in the chart above. The MACD signal line is rough as compared with Trix indicator line, which is caused by market noise and unneeded price swings. As we have a clear and smooth signal line, the Trix indicator filters out the noise and price variations. As a result, the Trix indicator signals are smoother than the moving average convergence divergence (MACD) signals.

Interpret how the combination of zero line cutoff and divergences makes Trix operationally very strong. (screenshot required)

The Trix's zero line plays an important role in creating signal information. When the Trix line oscillates above and below the zero line, it indicates a shift in trend from bullish to bearish.
Traders can utilise the Triple Exponential Average to predict when key market turning moments will occur. They can do this by examining divergences. When the price moves in the opposite direction of the TRIX indicator, this is known as a divergence. When price makes higher highs but the TRIX makes lower highs, the uptrend is waning and a bearish reversal is forming. When the value of an asset makes lower lows but the TRIX indicator makes higher lows, it signals the start of a positive reversal.
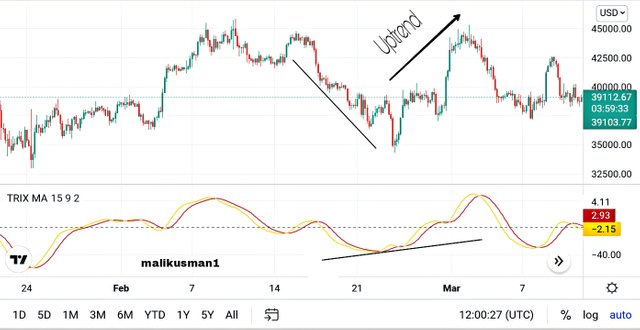
During a decline, we can notice a positive divergence on the Trix indicator, as shown in the screenshot above. After a few rime, the Trix signal line crosses above the zero line, signalling a bullish reversal. The divergence is a first-hand signal to quit a sell trade and look for a prospective long position, since the Trix signal line passed above the zero line.

Is it necessary to pair another indicator for this indicator to work better as a filter and help eliminate false signals? Give an example (indicator) to support your answer. (screenshot required)

The TRIX, being an EMA-based indicator, generates leading signals. As a result, it must be used in conjunction with other technical indicators. When tracking a price, this can assist traders in selecting high-probability opportunities. As a result, I employ the RSI in conjunction with the TRIX indicator.
The Relative Strength Index (RSI) is a tool for determining the strength and velocity of a trend. When used in conjunction with TRIX, RSI can help provide accurate buy and sell signals. When the price of an underlying asset is range-bound, it emits various signals. When both the RSI and the TRIX are in the oversold range, a strong buy signal is generated, indicating a possible reversal. When both the RSI and the TRIX are overbought, a strong sell signal appears, indicating a possible reversal.
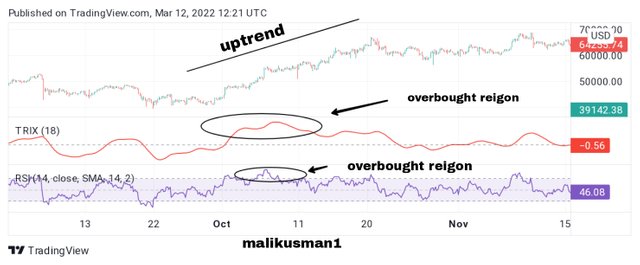
The lines of the TRIX and RSI indicators are in overbought territory in the screenshot above, and we can observe an uptrend movement from there. As a result, we may utilise the RSI indicator in conjunction with TRIX to filter out spurious signals. Many other indicators, such as aroon with TRIX, can also be used.

List the pros and cons of the Trix indicator

Its strong market noise filtering and Its proclivity towards being a leading indication.
TRIX uses a triple exponential average method to filter out market noise. Minor short-term cycles that imply a change in market direction are thus eliminated.
- Because it gauges the difference between the smoothed versions of each bar's price information, it can lead a market. The TRIX indicator is best used in conjunction with other market-timing indicators when understood as a leading indicator. This lessen the number of wrong positives.
- The indicator begins to overlap when price activity coils the three EMAs. This generates a close range in the indicator, resulting in crosses under and over the zero line without a important price movement.
- This is when the problems with these indicators begin. As a result, if a crypto or market is not moving in an impulsive trend, the indicator begins to send out erroneous indications.

Conclusion

The TRIX oscillator combines trend and momentum. The trend is covered by the triple smoothed moving average, while momentum is measured by the one-period percentage change. As a result, TRIX resembles MACD and PPO.
Shorter timeframes are better for traders who want more sensitivity. The indicator will become more volatile as a result, and it will be better suited for centerline crossovers. A larger duration is recommended for traders who want less sensitivity.
The indication will be smoothed out and more suited for signal line crossovers as a result of this. Traders should utilise TRIX in conjunction with other aspects of technical analysis, such as chart patterns, as they do with any technical indicators.

NOTE -- Some photos are design and edit by me on Canva and Picsart. Remaining all unsourced photos or screenshots taken from Tradingview and Coinmarketcap website and the grammer check from grammarly.

SUBMITTED TO DEAR PROFESSOR:
@kouba01
SUBMITTED BY :
@malikusman1
THE END 😇

Hello @malikusman1,
Thank you for participating in the 3rd Week Crypto Course in its 6th season and for your efforts to complete the suggested tasks, you deserve a Total|5/10 rating, according to the following scale:
My review:
An acceptable article in which you touched on all the questions with interpretation and analysis, with some variation in the effectiveness of the answers.
You have demonstrated an acceptable understanding of the TRIX indicator as a crypto trading indicator as well as how it works.
In the second question, you did not give an example of how the indicator value was calculated at time t, also you interpreted the indicator's period setting briefly.
On the third question, a clear explanation on how to predict whether the trend will be bullish or bearish and determine the buy/sell points in the short term and in the medium/long term.
In the fourth question, you compared the two indicators Trix and MACD well.
For question 5, you have satisfactorily shown that the combination of zero line cutoff and divergences makes Trix operationally very sound.
In question 6, you combined Trix with RSI to explain how it will improve the functioning of the indicator as a filter and help eliminate false signals, but you did not elaborate on the idea.
Note: Please use the right hashtag indicate which club you belong to ,respecting the rules of each club
#club75.
We thank you again for your effort and we look forward to reading your next work.
Sincerely, @kouba01
Thank you professor @kouba01 for your kind review. But dear professor i am a member of club75 but you cut my 1 mark.
Look what you put here :
Sorry for my mistake but now i power up my all steems dear professor . Now i am a part of club 100 you can also chk my wallet.
You can put #club100 in your next post.