Steemit Crypto Academy | Season 2: week 7 - The Swing trading style
Hello friends,hope you are all fine. Today i am writing my homework post for professor @yohan2on which is about the swing trading style.
Lets first understand what actually is swing trading?
Swing trading is something which can be considered to be in between day trading & trend trading.This type of trading can last from few days to few weeks until the desired profit percentage is achieved,the desired profit can vary from trader to trader.Every trading system has its pros and cons.So does this one
PROS
GOOD SUCCESS RATE.
MORE ACCURATE.
ONE DOESN’T HAVE TO WAIT FOR MARKET.
TO DIP DOWN.
LESS STRESSFUL.
MORE CHANCES OF PROFIT.
BEGINNER FRIENDLY.
CONS
OVER-NIGHT RISK.
NEEDS HIGH LEVEL OF PATIENCE.
FUNDAMENTAL ANALYSIS SHOULD BE CORRECT.
one needs to see a good asset.looking for good asset is more important then looking for a good price.

MY ENTRY AND EXIT STRATEGY
First of all i will choose any crypto asset pair.It can be any one (BTC/ETH,BTC/USDT,TRX/USDT,SBD/STEEM)i chose BTC/USDT.
So after i choose a crypto asset pair.i will study its behaviour. I have to study both big time frame chart & small time frame chart.The limitation here is that i will study the big time from upto monthly not more then that & the small time frame hourly (1 hourly to be precise).Then i will start by seeing the trend in each of these time period’s
After i analyse the trends i will be waiting for a downtrend which extends upto the the support of the previous trend or below then that.once i see such trend i will buy the crypto and hold it untill it crosses the resistance level.
TRENDS OF BTC/USDT
| TIME PERIOD | MARKET TREND |
|---|---|
| MONTHLY | UPTREND |
| WEEKLY | DOWNTREND |
| DAILY | DOWNTREND |
| 4 HOURLY | DOWNTREND |
| HOURLY | UPTREND |
MULTIPLE TIME FRAME ANALYSIS
The trends can be analysed by by looking into the chart.
If the chart makes higher highs and higher lows,the trend is upwards.
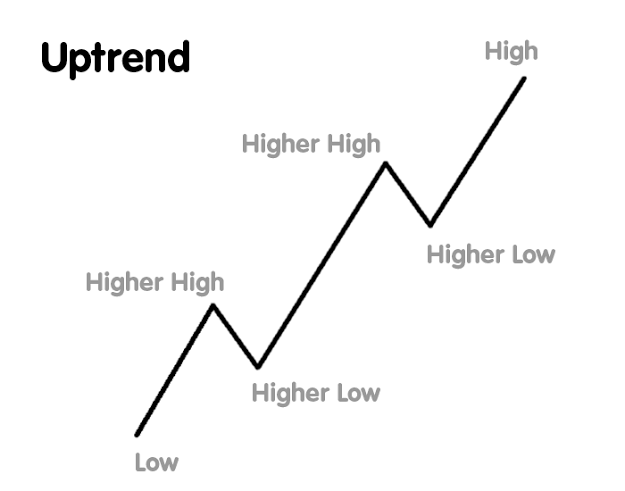
uptrend
If a trend makes lower highs and lower lows,it means the trend is downtrend.
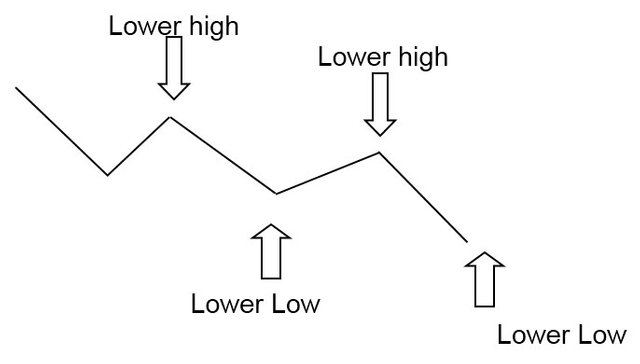
downtrend
There is also a third type of trend that is called as sideways trend,but that is not seen very often.
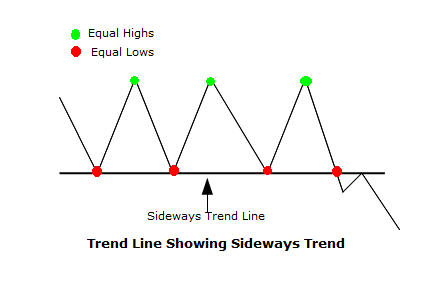
sideways
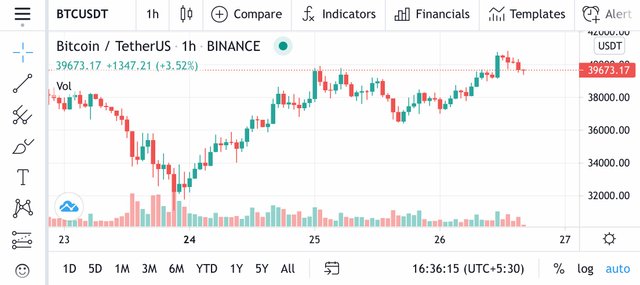
BTC/USDT HOURLY CHART
In this chart each candle represents a whole hour and by looking at each candle one can analyse the market movements.
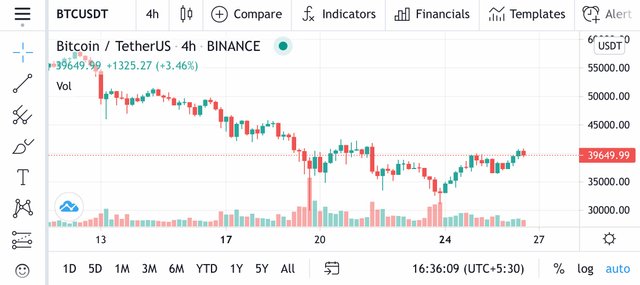
BTC/USDT 4 HOURLY CHART
In this chart each candle represents a time interval of 4 hours.Each candle represents 4hours means after every 4 hours new candle will form
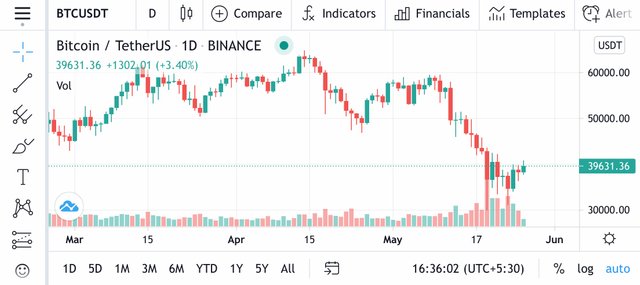
BTC/USDT DAILY
In this chart each time interval represents a whole day.one day means one candle in daily time frame.charts above day level are used by traders who are looking for a long time trade.
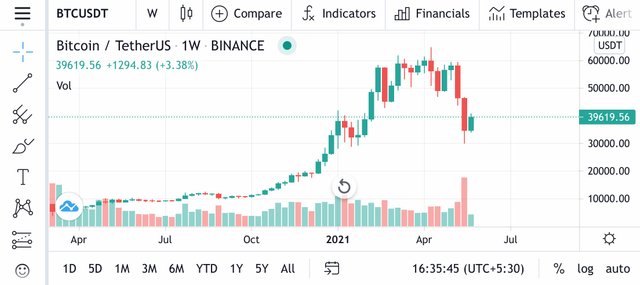
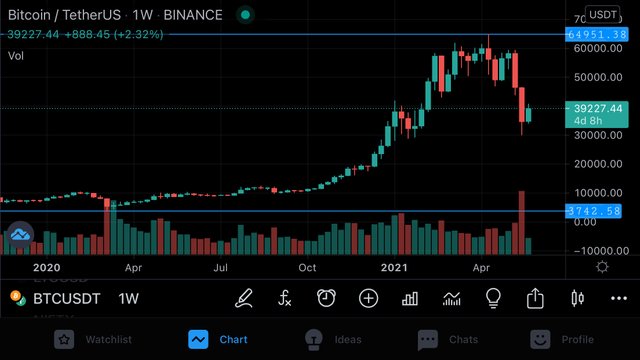
BTC/USDT WEEKLY
In this chart each candle represents a week. it is collection of 7 day candles,merge them together to form a single candle.you will get a weekly chart.One candle represents the market movement in a week
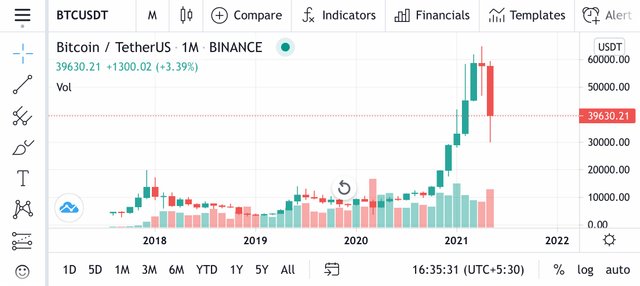
BTC/USDT MONTHLY
In this chart each bar represents each month of the year,irrespective of the days.Feb,Mar,Apr have got different day count but still all of them have only one candle in the monthly candle chart.
CANDLESTICK ANALYSIS AND USE OF RSI(RELEVANT SUPPORTING INDICATORS) FOR TRADE DECISION.
First lets understand candlestick
The candlestick can represent an hour,day,week,month,it’s completely in the hands of the trader what candlestick he wants see.
Understanding different candlesticks
There are two types of candlesticks,The green one and the red one
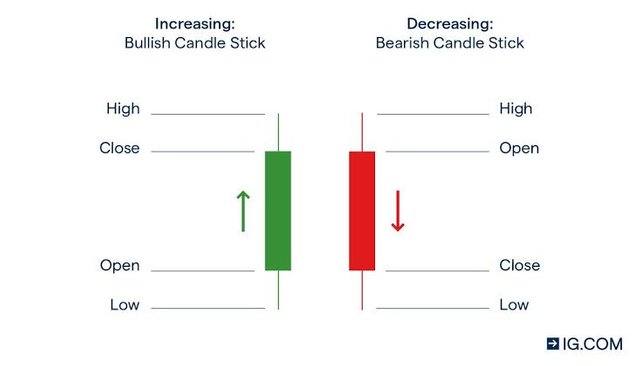
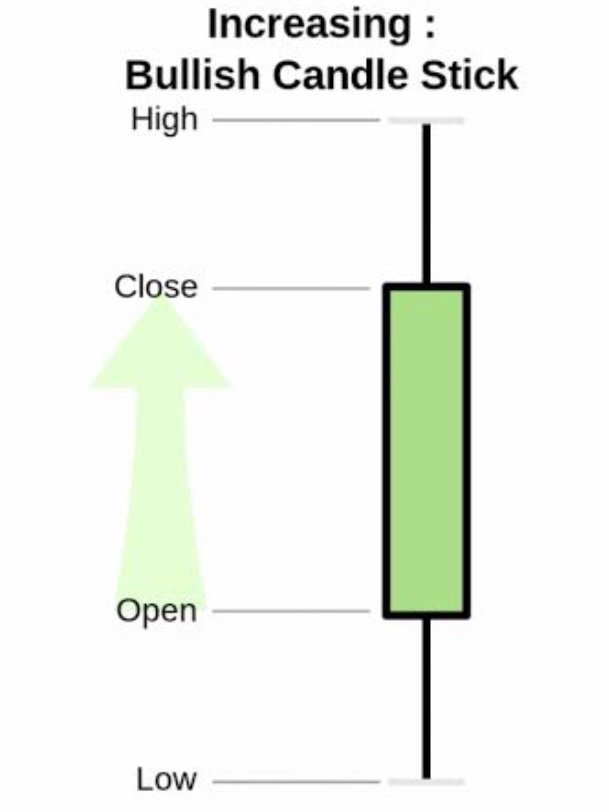
GREEN CANDLESTICK
The green candlestick represents the market is going in upwards direction
RED CANDLESTICK
The red candlestick represents the market is going in downwards direction
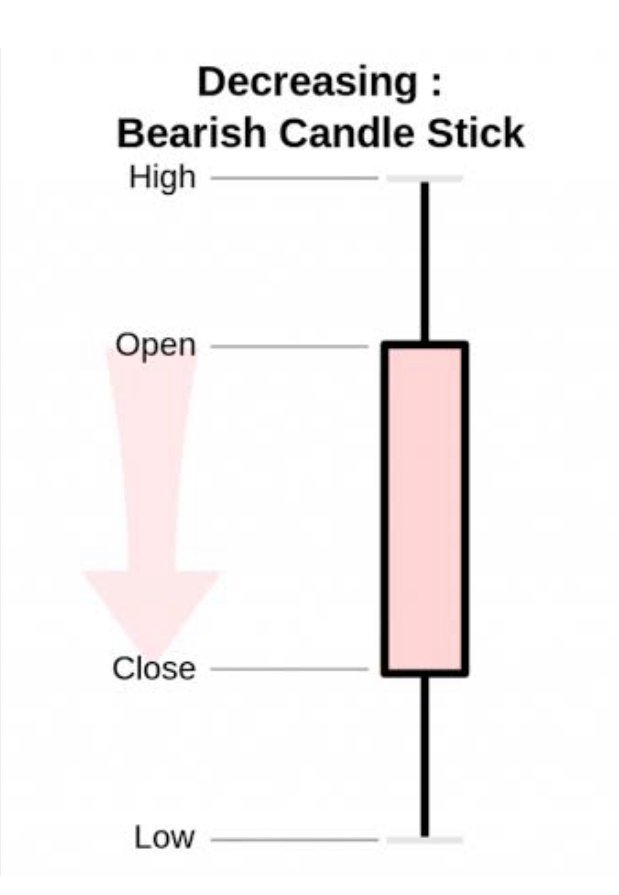
The thin line on the red side which extends above and below the coloured block.This is all time high and all time low in the particular time period.The red line has same criteria,The uppermost thin-line shows all time high and the lower thin-line shows all time high in a particular time interval.The upper side of red block shows market open price & the lower side shows market close price.
I used the weekly time frame,for analysis.it is better as compared all other time frames,so i checked from starting 2020 to 26-05-2021.i was able to see that the lowest was on 09-03-2020 which was 3742.58 USDT and highest was on 12-04-2021 which raised up to 64951.39 USDT. We can see the market was in upward trend from the beginning of 2020 untill april 2021. After april the whole market started to crash after the bitcoin fell down.Lets not go into the cause,why did that happened.So today the BTC is at an average of 34000 USDT-42000 USDT.
After analysing the market i will look for the trend,whether it repeats or not if it repeats it is favourable to trade if doesn’t/breakdown occurs,one has to wait untill the market forms a shape.After doing all this after making support and resistance bands.
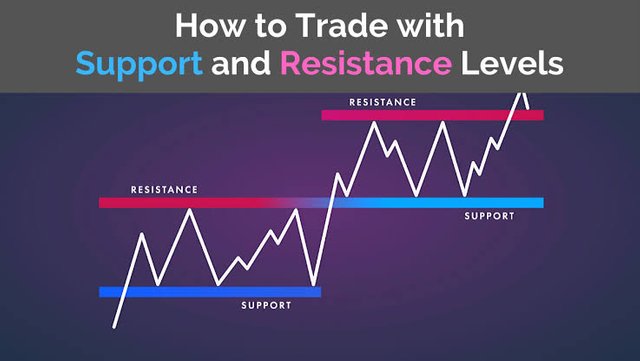
SUPPORT
As the name suggests it supports,meaning it is a place where the trader buy his stock.If the price of the stock fell below the support it will bounce back.If the stock shows uptrend then the resistance becomes support and it increases untill breakdown.
RESISTANCE
It is a point where the trader sells his stock.the stock is expected to show downtrend after reaching the resistance,but as we know no trading technique is perfect,so it can go on rising.But resistance is such a point where the profit percentage is enough.Less risk and good profit is needed.
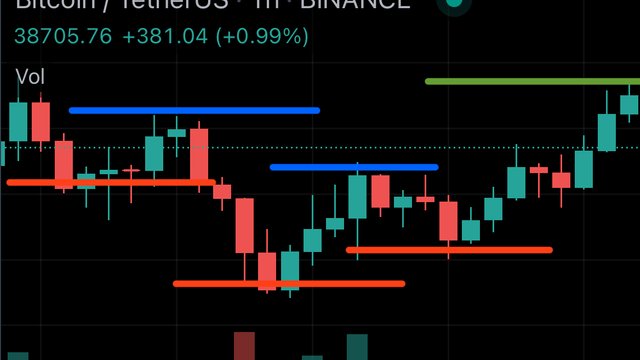
We will see BTC/USDT in hourly time frame it shows that it is gradually increasing.So at this time it is moving almost in sideways,once it moves above green(final resistance line).the resistance becomes the support. the red and blue lines are resistance and support for a small amount of time which can be negligible if you choose a bog time frame.after i figure out the trend.I will make an investment when stock reaches support and sell it once it crosses resistance.Doing so repeatedly makes you a swing trader.
TRADE MANAGEMENT
Stop loss is needed,if the market goes down,opposite to what you thought.To save myself from a greater loss we use stop loss.i will use stop loss 2% under the current value.
i will set the trade profit at 5% above the current price
VERDICT
This is my trading plan.No trading plan is loss proof,loss is as important as profit,But it can be minimised by used knowledge.

Hello @magmuz,
Thank you for participating in the 7th Week Crypto Course in its second season and for your efforts to complete the suggested tasks, you deserve a 4.5/10 rating, according to the following scale:
My review :
An article with sub-average content in which multiple information on the topic is presented. What is lacking in the work is the existence of a methodology in writing, where we find a group of separate paragraphs without a sequence of ideas. The results presented also for trading through Swing trading strategy that is limited to determining the direction of the market, although it was possible to rely on many indicators to extract several other signals. Hence your graphical analysis is more accurate.
Thanks again for your effort, and we look forward to reading your next work.
Sincerely,@kouba01
Sir,as per originality is concerned,i think you should reconsider it because I haven’t use a single plagiarised word here.@kouba01
Plagiarism is prohibited in our academy, which concerns originality is a criterion that assesses the following points:
Interesting to know about swing trading, it's looks very complicated to me though.