Crypto Academy Week11 Homework Post for [ @kouba01]..Trading with RSI.
Happy to continue learning in cryptoacademy lecture series. Today on 07 may 2021 , i am writing homework task for professor @kouba01, which is about RSI indicator. The topic has been covered in great depth by professor. I got to learn many new things. So let's do homework.
What is the Relative Strength Index - RSI and How is it Calculated?
RSI is an oscillator Momentum indicator. Oscillator indicator is a type of technical indicator that has two extreme values and a mean value. The indicator keeps on moving between the two extremes. In case of RSI , the two extreme values are zero and hundred and the mean value is 50. If the value of RSI is above 50, it indicates bullish trend of the market. If value is below 30 , it indicates the asset is overbought. If the value of RSI is below 50, it indicates bearish trend of the market and if it is below 30, it indicates that the asset is oversold.
How to calculate RSI.
Taking formula of RSI from class of professor @kouba01.
For beginners, here it is:
RSI = 100 - 100 / (1 + RS)
What is RS?
Well, it is:
Average earnings over a high period over a given period / Average loss over a high period during this period
Let's try to analyse above formula. Taking example of a bullish market. Let's say @magmuz invested $100 in BTC for 14 days ( In RSI, 14 periods are taken by default) . What i saw is that, BTC value increased to 104$ after one week and than decreased to 102$ in next week.So i still had gained $2. Let's see, if above formula follows or not. So we had average gain of 4% during first week and average loss of 2% during 2nd week.
RSI = 100 - 100 / (1 + RS)
So RSI, 100 - 100/ (1+4/2)
RSai = 100- 100/3 = 66.66 (that is > 50= bullish}.
So RSI also shows that market is bullish. Had it crossed 70 , we would have called it overbought.
Can we trust the RSI on cryptocurrency trading and why?
Technical indicators are developed by trading specialist who have ample experience in the trading field. The point that I want to convey here is, that these indicators do not come in market on their own. There are think tanks behind all these indicators. So these are trustworthy indicators but they cannot be wholly and solely relied upon.
As we know that in case of RSI , false signal generation is not uncommon thing. RSI generates false signals in a volatile market. It continues to remain in overbought or oversold zone, even when price momentum of the asset is not concording with RSI at that point of time. So support of other confidence factors when taken along, RSI can prove a very useful tool in hands of traders.
Keeping the price volatility of the cryptocurrencies in view, RSI when used with other factors like STOPLOSS, MOVING AVERAGES, MACD etc can be trusted with good results.
How do you configure the RSI indicator on the chart and what does the length parameter mean? Why is it equal to 14 by default? Can we change it? (Screen capture required)
Let's talk about length of RSI graph. As mentioned above, length is 14 by default. However amplitude depends upon time unit selected. Suppose if hour is chosen as unit of time, RSI will show trend of 14 hours. Similarly, if day is choosen, RSI will show 14 days trend. Length of RSIi can be changed as per one's will.
How to configure.
I find tradinfg view free version a bit user unfriendly. So i started with mobile app of tradiny. It is very simple to use. Go to the app, select crypto pair and chart will load automatically. Just below chart, configure option like time interval and length are shown.
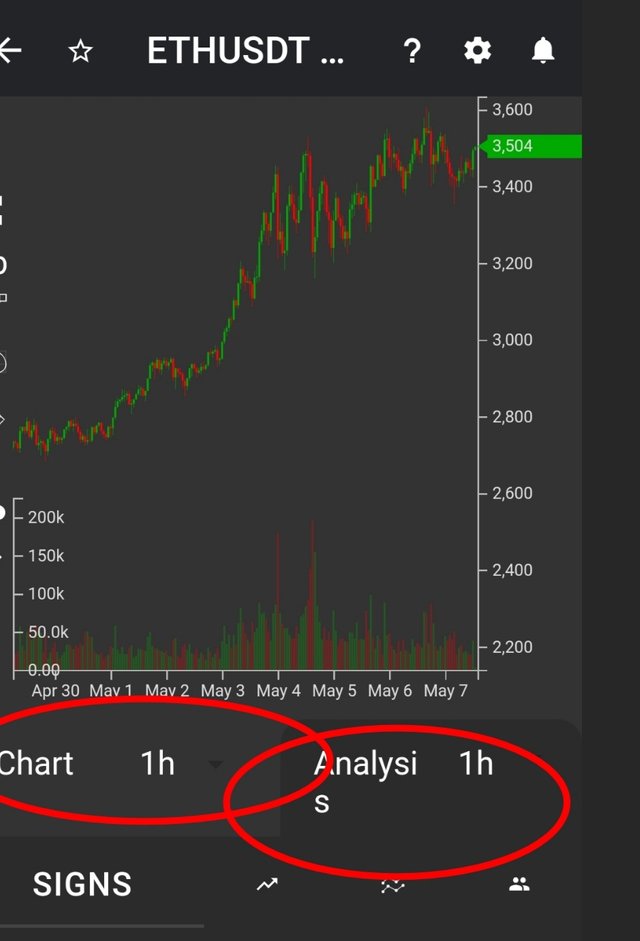
Other configuration setting like font, precision level, opening /closing price etc are not available in free version of app.
How do you interpret the overbought and oversold signals when trading cryptocurrencies? (Screen capture required)
Theoretically we say, if RSI is above 70, the asset is said to be overbought and if RSI is less than 30, it is said to be oversold.
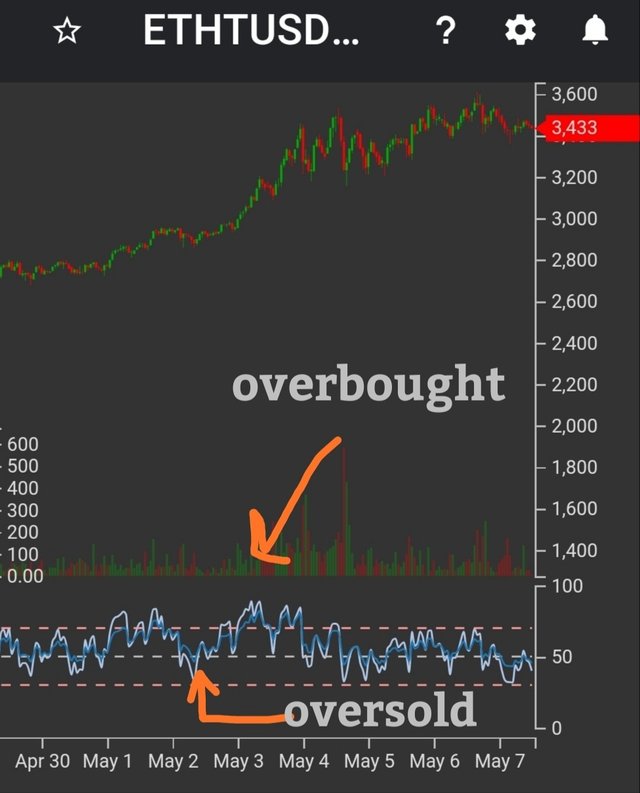
ETH/USD graph today showing eversold and overbought points as per RSI
How do we filter RSI signals to distinguish and recognize true signals from false signals. (Screen capture required)
To filter false signals from true signals RSI indicator will have to be taken into consideration alongside other indicators like Bullish divergence and bearish divergence, support Resistance, MACD, STOPLOSS. The graph of bullish and bearish divergence will be shown at end.
In bullish divergence, the market price of token is bearish but RSI pattern is bullish. On the contrary, in bearish divergence, maeket price of token is bullish but RSI shows bearish trend at the point of time.
Review the chart of any pair (eg TRX / USD) and present the various signals from the RSI. (Screen capture required)
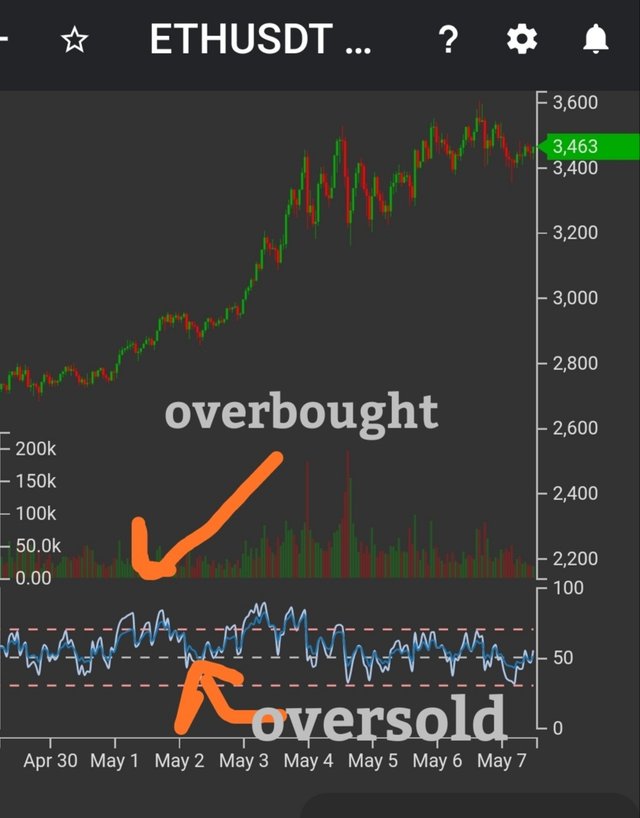
Overbought - RSI 100 and oversold RSI 25
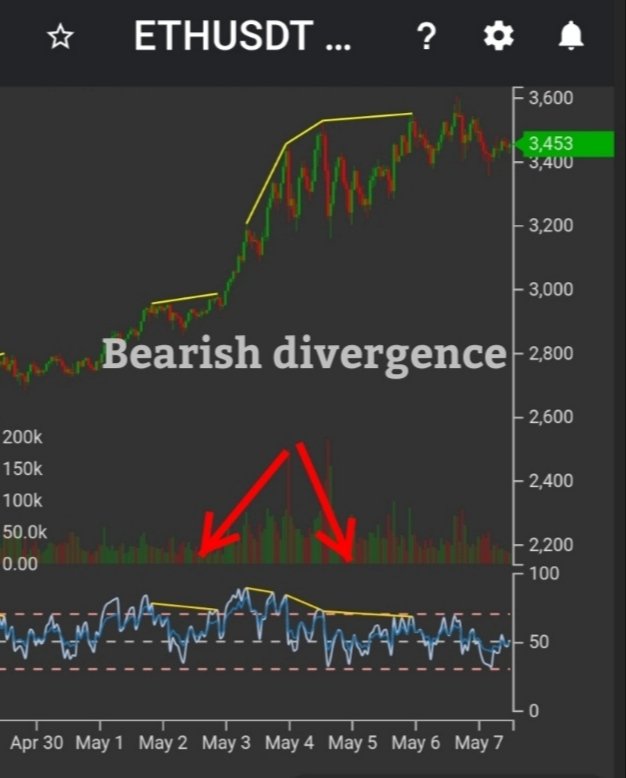
Bearish divergence
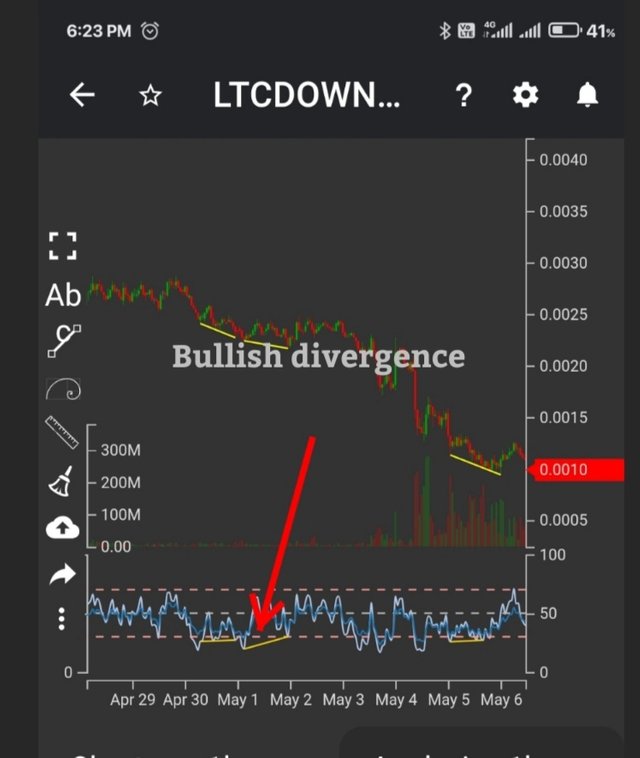
Bullish divergenceThanks
cHello @magmuz,
Thank you for participating in the 4th Week Crypto Course in its second season and for your efforts to complete the suggested tasks, you deserve a 5/10 rating, according to the following scale:
My review :
Medium content, it lacks accuracy in answering some questions and analyzing some important points due to not being well understood. Try to take your time researching the basics of the RSI and their uses.
Thanks again for your effort, and we look forward to reading your next work.
Sincerely,@kouba01
Thank you.