Understanding Trends II - Crypto Academy / S5W3- Homework Post for @reminiscence01


1. a) Explain your Understanding of Trend Reversal. What is the benefit of identifying reversal patterns in the Market?
The term trend reversal comes from technical analysis and describes the point at which the prevailing trend ends and reverses. This is the case, for example, when a bear market turns into a bull market.
It can be said that the price breaking through the trend line is one of the earliest signs of a reversal. If there are no signs of this, then it is likely that the trend is still being maintained and trading against the trend will have a low probability of success.
In fact, reversals often occur when a trend moves so quickly and strongly that it is easy for the price to break through the trend line. A shot back after the first signal of the trend's first reversal is usually quite shallow, the trend will likely reverse very high so traders under the trend will be more cautious, while traders trading against the trend will be more confident. So in this case you will see a short pullback which will rush towards breaking the trendline.
The benefits of identifying reversal patterns in the Market are :
- The benefit of identifying trend reversals is that we know sudden changes in direction are frequent and unavoidable. You should wait for the trend to reach its goal, restrain sideways movement and volatility.
- The benefit or advantage of us identifying a trend reversal, we can get out of most people and see a bigger profit opportunity, because most of the traders who identify the trend believe that it is safe to side with more people, so we can also take profit or can minimize future losses.
b) How can a fake reversal signal be avoided in the market? (Screenshot needed).
Over the years of the existence of the exchange market, a number of classic chart patterns have been identified that allow one to predict future price movements quite accurately. If your trade idea contains a test of a certain technical pattern, this increases the chances of its success. It is quite easy to use this analysis in trading - you need to know the pattern itself and the consequences of its appearance - trend continuation (see Parallel Channels - Trends section) or reversal. You need to open a deal after the last candlestick of the pattern closes to avoid false signals.
There are many ways to detect false signals, for this time I detected them using indicators.
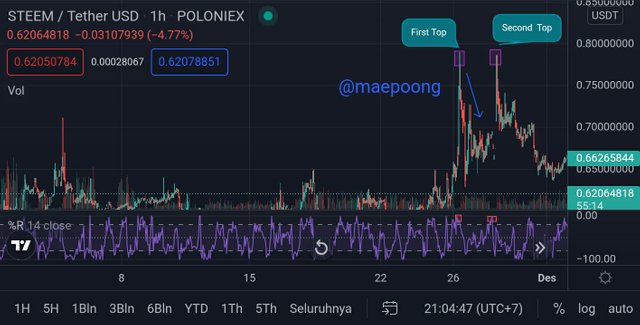
This is a false signal, because it does not match the signals on the charts and indicators, so we must avoid these false signals.
2. Give a detailed explanation on the following Trend reversal identification and back up your explanation using the original chart. Do this for both bullish and bearish trends (Screenshots required).
a).Break of market structure.
Most often, a breakout is accompanied by strong volume, in most cases a short squeeze is a fairly common occurrence in a market where you can trade both ups and downs. This is the time when the bears close their short positions by buying and raising the price upwards.
Let me explain, when we trade up, we first buy, then sell, when down, respectively, first sell, then buy.
The situation with squeezing in the long direction is exactly the same, quite the opposite.
rebound from level
A bounce occurs when buyers, or they are also called "Bulls", can't or just don't want to buy an asset, they are like a cyclist going uphill and at some point weakens and backs off.
Bullish trend reversal
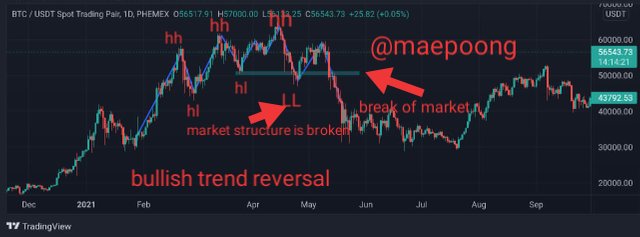
As seen in the screenshot above, this is a bullish market structure which then violates the trend conditions so that a trend reversal occurs, as can be seen in the chart the market continues to form new Higher highs and new Higher lows, then we can see that the market structure is starting to break down. , it happened after the new low was lower than the previous period, then we can see that the market broke and the bullish trend started to turn into bearish, this is what happened in the market so we have to be careful.
Bearish trend reversal
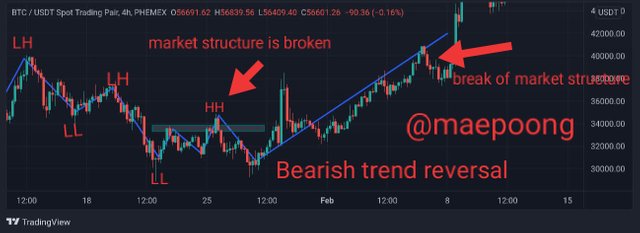
The opposite of a bullish trend reversal, a bearish trend reversal is that the high and low prices must be lower than the previous period, then what happens is that the market structure is damaged, there will be a trend reversal in the market, as seen in the screenshot above that the market forms a higher high and lower low from the previous period, what happened next in the market violated its conditions by creating a higher high from the previous period, what happened next, the market responded with a trend reversal from bearish to bullish, this is a trend reversal in the market.
b).Break of Trendline.
Trendline is a fundamental tool in technical analysis. It highlights a trend or range of price movements.
If you know that support and resistance are horizontal areas on the chart to represent potential buying and selling pressure, the same goes for trend lines, the concepts are quite similar. The difference is that the trend line is diagonal.
Instead of looking at past performance and trading principles, analysts look for trends in price action. Trendlines help them analyze the direction and speed of market prices.
Bullish trendline
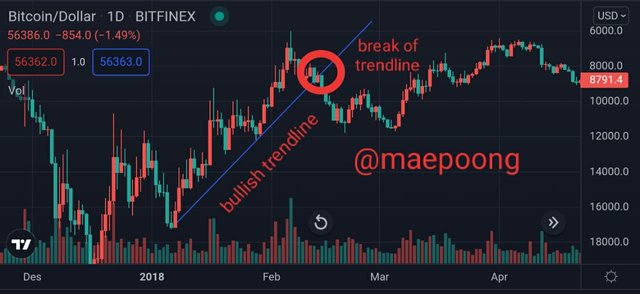
Based on the chart above, we can conclude that the candle is above the trend line from time to time because it is a bullish trend that is going on. all points are above the trend line, but what happens at the fourth point of the candle crosses the trend line which can be understood as a signal that a trend reversal will occur, then the market structure breaks and the market immediately changes direction from bullish to bearish this is a trend reversal.
Bearish trendline
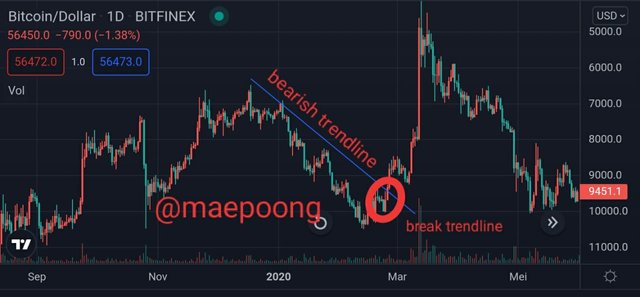
As we explained above, a bullish trendline reversal is identified with a candle that breaks from top to bottom, while in a bearish trendline the opposite occurs, namely a candle that breaks from below to above the trendline on the chart. So this can be ascertained as a very strong trend reversal signal, such as what we see in the chart above is that the candle is below the bearish trendline, then the next candle broke above the trendline and a very significant trend reversal occurred in the market.
c).Divergence.
Divergences are deviations between price developments and their indicators. If the price falls to a new low and the indicator has not shown a new low, it is a divergence.
Trading divergences are easy to ignore at a glance at the chart. Divergences can be recognized through indicators. They indicate that there are deviations in the graph.
Divergences are strong technical signals that experienced traders often use to identify trend reversals. The courses and indicators used must move in opposite directions at the extreme points. Such signals can often be a sign of a trend reversal. It therefore makes sense to use such trading divergences for trading.
Divergence is not a guarantee that you will actually make a profit. They allow for more accuracy in trading and can provide important trading signals. Due to the high volatility, losses can always occur, as the price can quickly develop in different directions
In the case of a divergence trade, a distinction is made between a bullish and a bearish divergence.
Bullish divergence
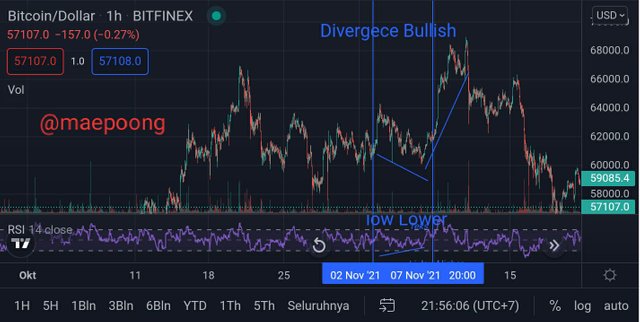
A bullish divergence will occur when the price makes new lows than before. The indicator should show higher lows at the same time. An oscillator indicates when the price is oversold. If the new lows are already higher, this indicates a price increase.
Bearish divergence
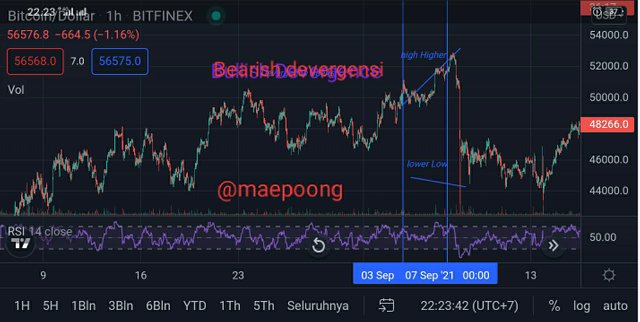
A bearish divergence indicates that a low is in progress. It indicates a decrease in price. Signals from the oscillator are more informative and indicate an impending trend reversal.
d).Double top and Double bottom.
The Double top pattern usually occurs during periods of strong price increases and there will be many investors rushing to chase the top because they think the price is too high and can't go up again. However, this action is not at all recommended because you are stopping a trend. And if you are not a market maker then this will never work out well, on the contrary there are better approaches than identifying the Double top pattern. The double top shape helps you identify market trend reversals accurately with high accuracy.
Double top
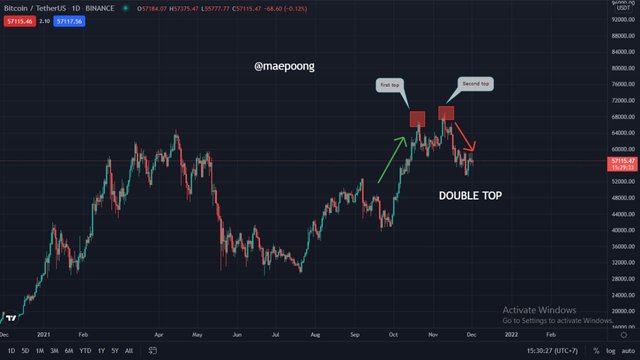
Simply put, the Double top pattern represents a failure to create a new Higher High and the selling returns that push the price down cause the market to reverse. The double top pattern indicates that the price has indeed peaked and a deeper decline is possible.
Double bottom
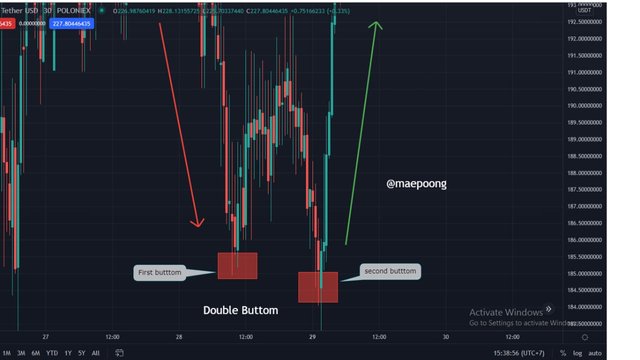
Double bottom is also known as Double bottom W. As the name suggests, the price will form a double bottom on the chart. Multiple archetypes provide the ability to identify trend reversals. A downtrend signal may be down and the price may be moving higher.
3. place a demo trade using any crypto trading platform and enter a buy or sell position using any of the above mentioned trend reversal/continuation pattern.
OK, I will solve this 3rd question by choosing the divergence method to detect trend changes and choosing XRP cryptocurrency for me to invest.
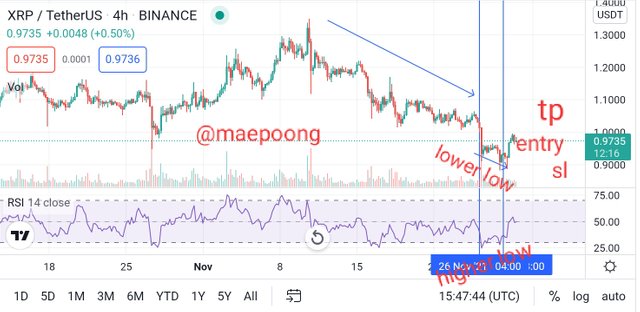
This time I will use the RSI indicator to detect divergence, now we can see in the chart above that the price has formed a lower low and the indicator gives a different signal from the chart. We can see on the indicator that a higher low signal can be concluded that there is a signal difference between the indicator and the price, this is a bullish divergence signal.
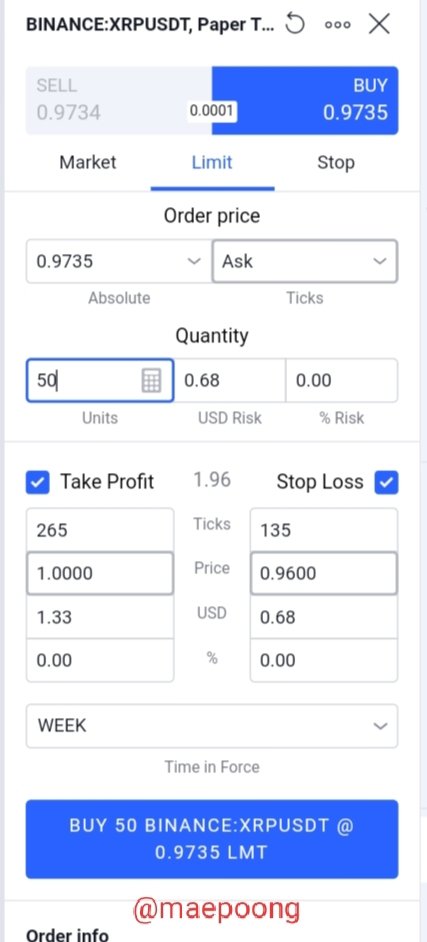
I believe that this is the right entry point to make a purchase and I place my take profit at $1 and stop loss below the current low of $0.96
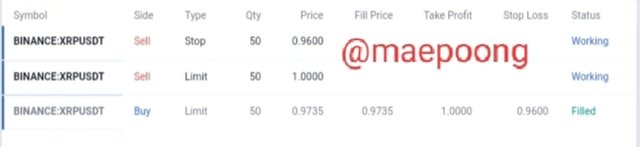
After it was finished everything went as expected the purchase and went as expected.
CONCLUSION
Trading on the market, in its manifestation, can be called nothing but "risk management". The main task of a trader is to protect capital and not to allow the possibility of an unprofitable transaction to overlap with a profitable one. Successful traders work with their respective ratios in the range of 60-70% winning positions / 30-40% losing positions. No 90%-100% is a myth and marketing ploy to attract the attention of new inexperienced people for further profit from it so understanding the trend is very helpful be it uptrend or downtrend or trend reversal. Losing a trade is part and parcel of the job, accept it.
Here you will learn which situations to avoid and which situations to wait patiently and act with confidence. There is absolutely no need to be in the market, on the contrary, you need to trade a little, but aim right at the target.
Hello @maepoong , I’m glad you participated in the 3rd week Season 5 of the Beginner’s class at the Steemit Crypto Academy. Your grades in this task are as follows:
Observations:
This chart is wrong for divergences. Please revisit the lesson to understand how to draw divergences proper.
Recommendation / Feedback:
Thank you for participating in this homework task.