[Repost] - Trading Using Wedges Pattern - Steemit Crypto Academy - S5W5 - Homework Post for @sachin08


1. Explain Wedge Pattern in your own word.

A wedge pattern is a price pattern that occurs after an up or down trend, predicting a continuation of the trend or a possible reversal of the previous trend.
The wedge pattern resembles a triangle with two sides acting as support-resistance. Usually, prices tend to "converge" before breaking out of the wedge. In a wedge pattern, price breaking through any edge will tend to go up/down along that edge.
The wedge pattern appears to signal that the market is in a state of rest after a previous up or down trend.
During a market correction, it is also a time when investors in the market are prepared to buy or sell with large trading volumes to push prices in the direction they expect . After this period the price may follow the old trend. Or it will reverse and start a new trend depending on the pattern.
Usually, the wedge will appear at the end of a strong uptrend or downtrend. To accurately identify wedge patterns, you can rely on trend reversal divergence signals or on resistance and support areas.
The usual wedge pattern will appear in the correction phase. When an uptrend or downtrend weakens.
2. Explain both types of Wedges and How to identify them in detail. (Screenshots required)
Rising wedge pattern
This is a pattern that forms when prices converge. This convergence point is formed from a combination of an uptrend line (support) and a trend line (resistance). The slope of the support line is always greater than the other resistance lines.
The rising wedge pattern is formed when price convergence occurs.
Characteristics as we discussed above indicate that the lower price formed more strongly than the higher price. This formation process determines the shape of the model. A price breakout is expected before the day the price sinks deep into the narrow gap.
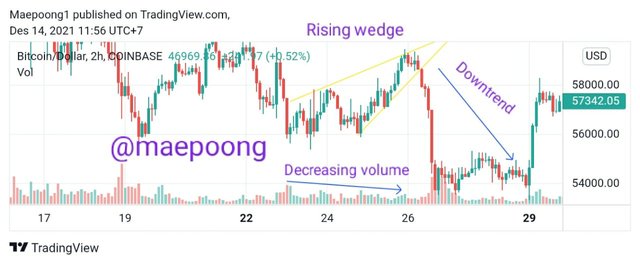
How to Identify the rising wedge pattern .
| Characteristic | Discussion |
|---|---|
| Upward trend line | It takes at least 2 price peaks to form an upper resistance line, ideally 3 points, where the next high is higher than the previous high. |
| Downward trend line | It takes at least 2 lows to form a lower support line, ideally 3 points, where the next low is higher than the previous low. |
| Support Break | Rising Wedge is not finished until the support line is broken convincingly. Once a breakout occurs, a reactive rally may occur to retest this new resistance area. |
| Volume | Although volume is not very important when forming a Rising Wedge, it is an important component of a breakout confirmation. If there is no volume expansion at the breakout point, it will be inconclusive and easily lead to model failure. |
Falling wedge pattern
The falling wedge pattern acts as a reversal signal. After a downtrend, price makes lower lows and lower highs.
That the line connecting the peaks is steeper than the line connecting the valleys. After exiting the wedge pattern, the price rebounded more strongly with the gains roughly equal to the height of the wedge.
How to identify Falling Wedge
| Characteristic | Discussion |
|---|---|
| Upward trend line | It takes at least 2 price peaks to form an upper resistance line, ideally 3 points, where the next high is lower than the previous high. |
| Downward trend line | It takes at least 2 lows to form a lower support line, ideally 3 points, where the next low is lower than the previous low. The upper resistance line and the lower support line meet to form a wedge as the pattern matures. |
| Resistance break | The Falling Wedge pattern is not complete until the resistance line is broken convincingly. Once a breakout occurs, there may be a price correction to retest this new support area. |
| Volume | Although volume is not very important when forming a Falling Wedge, it is an important component of a breakout confirmation. If there is no volume expansion at the breakout point, it will be inconclusive and easily lead to model failure. |
3. Do the breakout of these Wedge Patterns produce False Signals sometimes? If yes, then Explain how to filter out these False signals.
Whatever patterns are used to trade are not all correct, so as a trader we must also use indicators to detect false signals, the wedge pattern problem that we are talking about is also not free from false signals, then the right answer to answer this question, yes.
Therefore we will use indicators to see the false signals generated by this wedge pattern.
The first step to filtering out false signals is to identify the direction and strength of the trend. So if there is a trading signal in the opposite direction to the current trend, it's a good idea to be careful in trading.
And make sure we wait for confirmation from the indicator so that it is in line with the existing chart signals. So this is because even though there are graphic signals that look convincing, if there is no confirmation it could be just a fake signal that is visible. Therefore, do not rush and wait for confirmation from the indicator.
To detect a false signal in this wedge pattern I use the Stoch RSI and VWMA indicator as shown in the screenshot below :
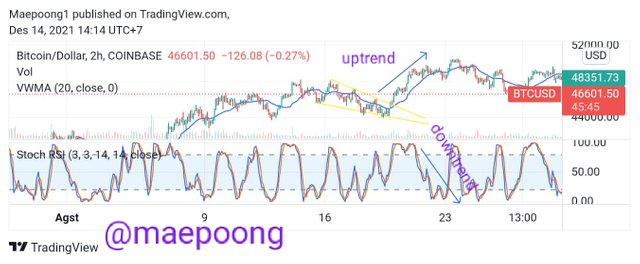
So from the chart above, we can conclude that applying the Stoch RSI and VWMA indicators to the chart, these indicators help us to know when the price is still in an uptrend and when the price is in a downtrend. When the asset price breaks up as we see it, the VWMA indicator also accepts and shows it.
However, it is different from the signal emitted by the Stoch RSI indicator in this situation where we can see that the Stoch RSI indicator gives different signals, so I conclude that in trading applying the indicator is very important, so that there are no losses.
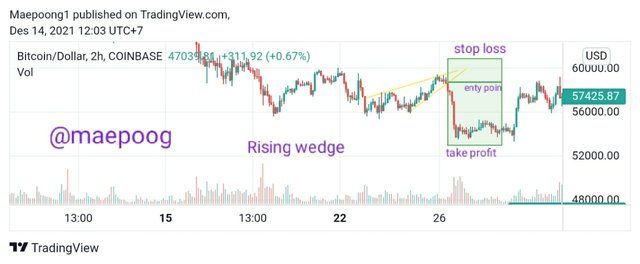
4. Show full trade setup using this pattern for both types of Wedges.( Entry Point, Take Profit, Stop Loss, Breakout)
The wedge pattern provides a good opportunity to make a trade reversal. As with all trading strategies and methods, there are certain factors to consider:
- Slices must have three touches on each level to be suitable for trading.
- The timeframe used depends on the timeframe that is priced in the best way.
- The breakout is confirmed by closing the candle below support or resistance.
- Market entries occur during retests and can sometimes occur on subsequent candlesticks after a breakout.
- A typical strategy for a stop loss is to place it above the last high or low.
- Where to take profits is determined by the latest high or low price fluctuations.
- Rising and descending wedges often contribute to the formation of the head and shoulders pattern.
To explain this let's look at the graphic display below :
Rising wedge
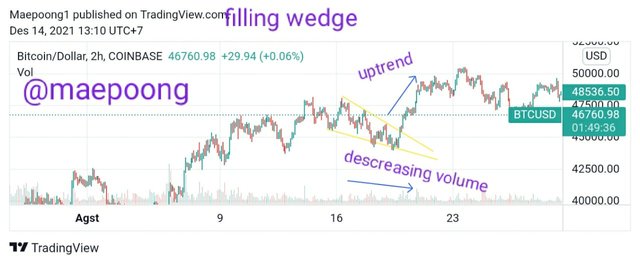
Filling wedge
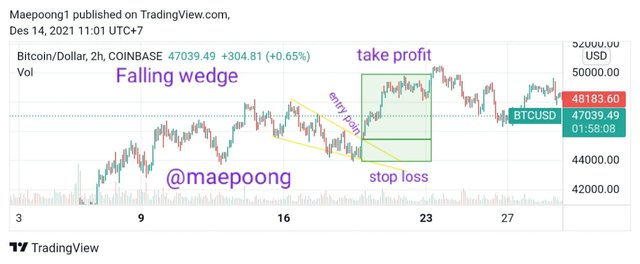
In the image above, we can see a downward sloping chart pattern, which indicates that the price will soon be moving upwards.
We can when buying when the price has broken through the pattern's resistance line, reached or broke the local high, which was marked before breaking the resistance. The profit target should be set at a distance, no longer than the trend, developing before the pattern appears. Stop loss can be placed at the local low, before the resistance.
5. Conclusion
A wedge pattern is a price pattern that occurs after an up or down trend, predicting a continuation of the trend or a possible reversal of the previous trend. During a market correction, it is also a time when investors prepare to buy or sell large trading volumes to push prices in the direction they expect. After this period the price may follow the old trend. Or it will reverse and start a new trend depending on the pattern,
So we as traders can see the opportunities we want, sell the assets we have or maintain to see opportunities in the future.
Finally, thank you very much to Professor @sachin08 who has given this extraordinary lecture, hopefully it will be useful for all of us.
All screenshots are taken from Tradingview.com
https://steemit.com/hive-108451/@maepoong/repost-trading-using-wedges-pattern-steemit-crypto-academy-s5w5-homework-post-for-sachin08