[Recognizing Simple Patterns in Trading] - Crypto Academy S5W2- Homework Post for Professor @sachin08


1. What is your understanding about Triangles in Trading. Explain all forms of triangles in your own words. (Screenshot required).
One simple but effective method of technical analysis is to wait for a triangle to appear on the graph. Trading, especially on small timeframes, usually takes place in flat conditions, followed by trend movements. If the chart starts to "trade" between the support/resistance line and an extreme correction point, a triangle has formed. The chart distinguishes between these 3 types of patterns, with each of them different price behavior.
The triangle in trading is A narrowing pattern, where price fluctuations move like a wave towards the support/resistance line. Most often, this pattern signals the continuation of the trend.
Experienced traders often talk about their first success using only the simplest methods. In this case, triangle trading is very effective. At the same time, the market does not rely on technical analysis alone. Political scandals, low liquidity of world-famous banks, bankruptcy of large corporations can lead to unpredictable price movements. For this reason, any technique is risky and requires caution.
To find out what a triangular figure consists of, there are usually three types: descending, ascending and symmetrical Triangles.
Analyzing triangles is easy. Just look for trend lines, mark support/resistance lines and join them at one point on the line between high/low prices.
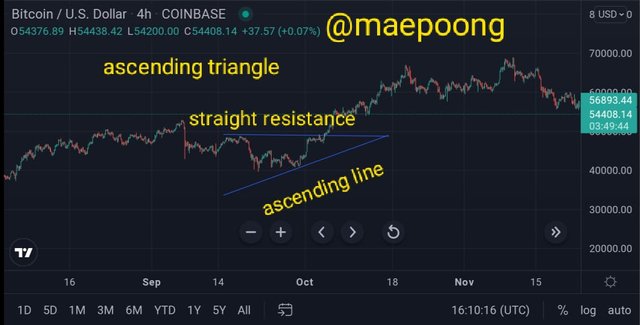
Ascending Triangles
This model has a flat top and a raised bottom. That is, the upper part of the pattern has the same level, while the lower part is increasing. Often times, this type of triangle indicates a bullish market sentiment. If we have noticed this pattern on the chart, then it should be prepared not to miss a bullish move. Thus, a break through the flat part of the pattern can be used as an entry point for long positions. When an ascending triangle forms during an uptrend, it indicates that the trend will continue.
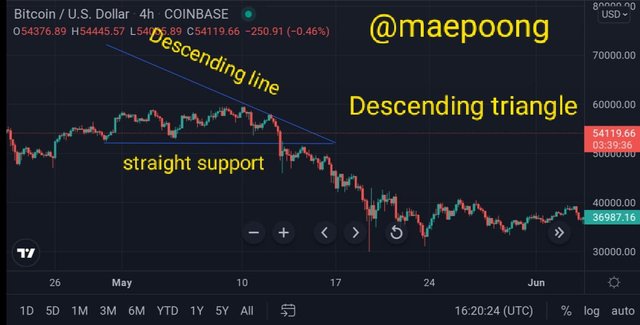
Descending Triangles
The direct opposite of an ascending triangle is a descending triangle. Therefore, the downward pattern has the same characteristics, but vice versa. The flat part of the pattern is below the price. The top is sloping downwards. If the market is bearish, then the descending triangle indicates continued strength of the sellers in the market.
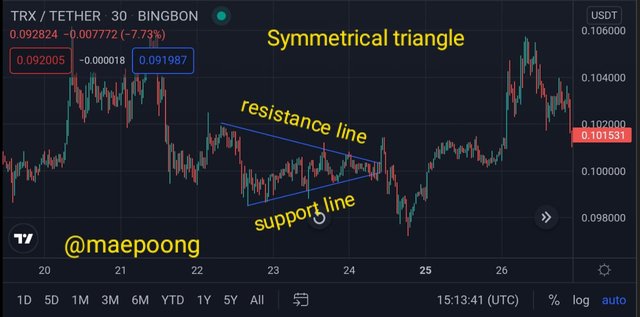
Symmetrical Triangles
This model has a neutral character. It's quite difficult to do. This pattern has several rising lows and descending highs. This indicates that the volatility in the market has started to decline. Traders build their positions, and this, in turn, leads to spasmodic price movements in one direction. The sides of the pattern are symmetrical about the horizontal axis and have approximately the same slope. This figure can take a long time to form. Technical analysis analysts suggest trading the pattern in the direction of the dominant trend.
2. Can we also use some Indicators along with it Triangle Patterns? Explain with Screenshots.
In short, technical indicators are lines that people draw on the chart. More specifically, they are visual representations of the output of mathematical functions that analyze asset-related data such as price and volume data.
These indicators are used in Technical Analysis (TA) by investors and traders who want to better analyze and predict price and volume trends for previous Trend Analysis; i.e. analysis of trends in data such as price and volume data.
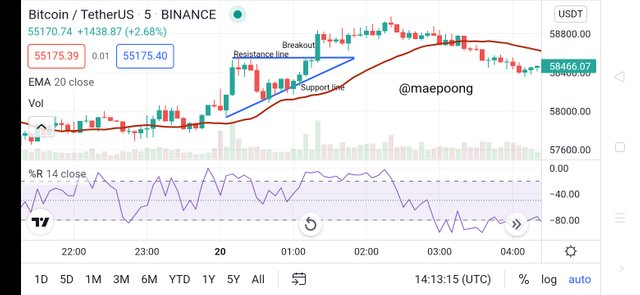
I use William R and EMA indicators simultaneously to trade from the triangle, these two indicators can identify different signals in the chart, as we can see above from these two different indicators we can conclude that two different indicators can be used in trading. triangle pattern.
3. Explain Flags in Trading in your own words and provide screenshots of both Bull Flag and Bear Flag.
The flag is a continuation pattern and can appear in both an uptrend and a downtrend. Price can't keep going up or down continuously - it needs a break, and you'll see price retrace often, before resuming its trend.
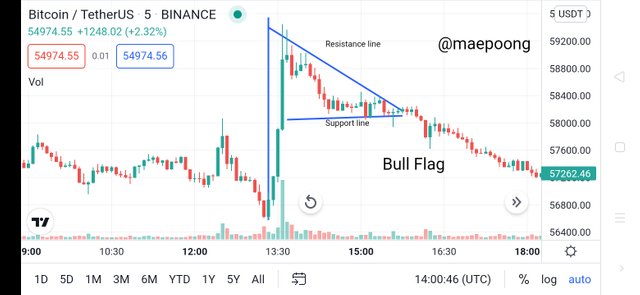
In a bull flag, you will see the price rise before the retracement. If you draw 2 parallel lines above and below the price retracement area, you will get a flag. The entry price will be the breakout area from the top of the flag, or you can wait until the top is challenged, forming a higher low. This higher bottom increases the chances of a successful trade. The target profit level is determined by measuring the upward trend from the top to the bottom of the pattern.
Bull flag
When the Bull Flag appears, it indicates that the uptrend will continue.
In this case, we need a continuous uptrend like a flagpole. The flag consists of two parallel lines that are tilted downwards or downwards; it indicates a short-term pullback – the area of consolidation before the trend broke.
After identifying the Bull Flag, you should be mentally prepared to open long positions.
Continue buying when the candlestick closes above the Bull Flag's upper trend line. The break of the upper trend line confirms the continuation of the uptrend.
You should place the SL just below the Flag's lower trend line.
Remember that the pullback forming the Bullish Flag did not go beyond the pole. This means bearish price action.
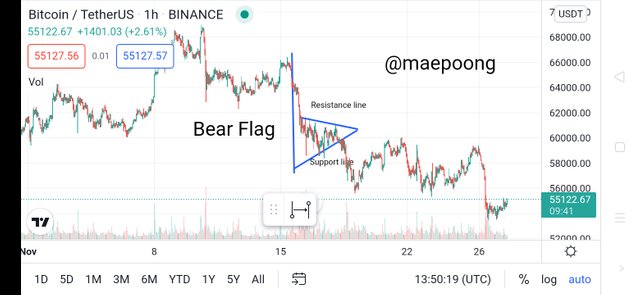
Bear flag
The appearance of the Bearish Flag indicates that the downtrend is in a consolidation phase and will soon break out and continue.
The flagpole is formed from a continuous downtrend, while the Flag is formed when there is a slight decline in price. Ideally, the Flag is formed when the price action trend is in a slightly upward sloping channel. This is in contrast to a bullish flag, which is usually downward sloping. In some cases, the Flags for ascending and descending can be horizontal.
The process of identifying bear flags is the opposite of bullish.
After identifying the Bearish Flag pattern, you must mentally prepare to open short positions.
Short sell when the candlestick closes below the Flag's lower trend line. A break below the lower trend line confirms the continuation of the downtrend.
Bear in mind that the Bearish Flag formation's retracement does not go beyond the pole. This means that the price action is turning into an uptrend.
4. Show a full trade setup using these Patterns on any Cryptocurrency chart. (Ascending Triangle, Symmetrical Triangle, Bear Flag)
The triangle pattern is one of the popular intraday cryptocurrency price patterns that you should be aware of. This is an important pattern because it shows the price change from going down to finally going up again. Triangles on crypto charts can be used to reflect current conditions and provide a clearer indicator of possible types of future conditions in trading. The triangle pattern also provides trading opportunities, both when it is formed and when it is finished.
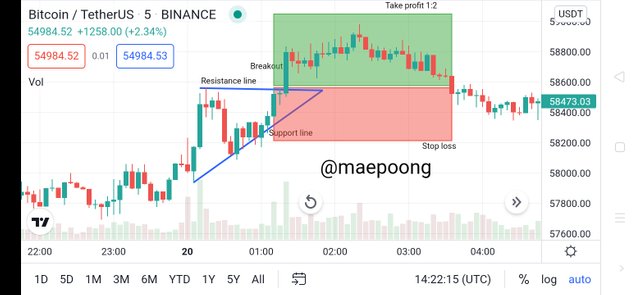
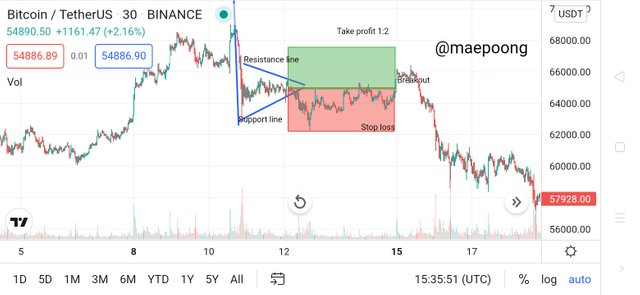
Ascending Triangle
Trading on the uphill triangle pattern has a number of factors that traders should pay attention to on crypto charts, here are the keys to keep in mind:
- The previous trend should be an uptrend.
- There should be a horizontal line that acts as resistance and the price should make higher lows.
- The price will continue to rise after the breakout of the resistance level.
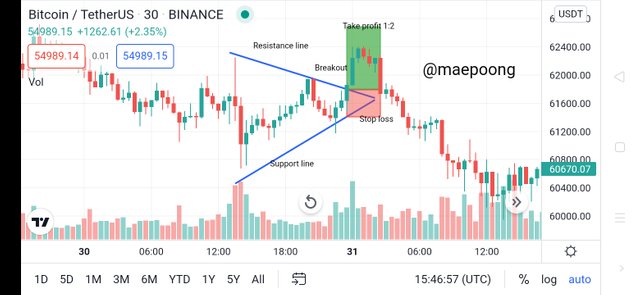
Symmetric Triangle
When analyzing charts, traders should pay attention to the most visible patterns. One of them is a Symmetrical triangle. Trading using this pattern can be successful under three conditions:
- Correct line definition.
- Be able to distinguish similar triangles.
- Trade with care, without loading excessive deposits.
Bear Flag
The bear flag is a type of flag that appears in a downtrend in crypto charts. The pattern indicates to traders that the market will continue moving in the same direction before consolidation.
The bear flag can be drawn on a strong downward move or selloff. Imagine the price dropping sharply. After that, the consolidation started and the candle was in a narrow range. More often than not, the market starts to trade upwards. Traders have doubts whether this is a reverse reversal or just a short term consolidation.
5. Conclusion
I conclude that Triangles are often observed and follow strong and extensive price trends as buyers and sellers test new stock price levels and become more aggressive over time so they can be easily analyzed.
An up triangle can be called a bullish signal and a down triangle can be called a bearish signal, while a symmetrical triangle usually indicates a continuation of the previous trend but can also signal a reversal as that can be concluded.
The triangle is a very profitable trading pattern because it is easy to interpret and confirm and establish support and resistance levels as well as price targets after a breakout.