Reading Special Bar Combinations - Crypto Academy / S5W8 - Homework Post for @sachin08.


1. Explain Price Bars in your own words. How to add these price bars on Chart with proper screenshots?
Price bars are lines that represent a specific time. Many different timelines are used to analyze the market, All charting platforms offer 1 minute to 1 week and even 1 month timeline charts. There is no such thing as the best timeline for analyzing currency pairs. The longer the timeline, such as a day, the better the suggestions for more relevant support and resistance levels.
Price bars are a simple method of presenting price information, widespread in Europe and the United States, These bars are vertical bar charts, from which two horizontal lines extend to the right and left. The upper point of the bar is the maximum price, the lower is the minimum price, the right line is the closing price, the left is the opening price. The chart allows us to analyze how the price changes in the trading period.
The main advantage of bars is their informational content. Unlike other charts, they show four price values at once for the selected period.
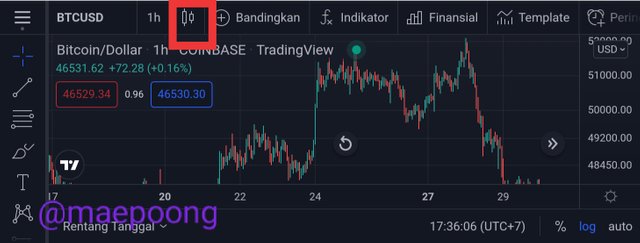
In setting the price bar I will explore the chart [tradingview.com] the first step after entering this site is to select the chart then click on the candle image and it will appear as shown below :
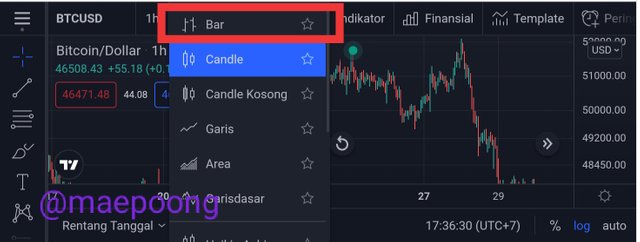
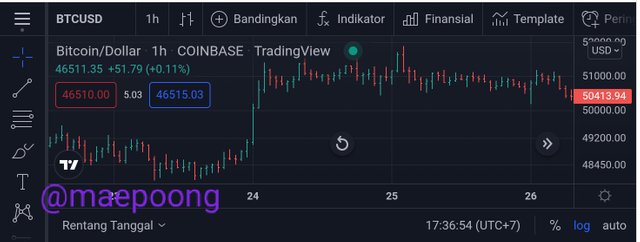
The next step is to select the bar and a display will appear as shown below :
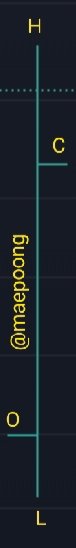
There are four ways to add a price bar to the chart, of course, there are four types that must be defined.
Opening price (open, O) - the level of the opening price of the selected period, in fact, this is the first strike price for this period;
Closing price (closing, C) - the closing price of the selected period, this is the last transaction price for the selected period;
Maximum price (high, H) - the maximum transaction price in the selected period;
Minimum price (low, L) - the lowest transaction price for the selected period.
For more details, please have a look at the chart below :
2. How to identify trends using Price Bars. Explain for both trend. (Screenshots required)
Buying when the price is low and selling when the price is high is the key to a successful investment, but how do you decide whether it is expensive or cheap? One of the judging factors is how to read major trends with charts. Based on the charts, we analyze the movement of stock prices over a certain period of time in the past and predict future trends.
The direction of the price is called the "trend". In addition, there are several types of trends, two or even three types, uptrend, downtrend and flat, depending on the direction of the price. Trends can be categorized by direction or period. Generally, one to several years is classified as a long-term trend, three weeks to three months as a medium-term trend, and less than three weeks as a short-term trend.
Uptrend
In an uptrend, open interest increases as the price rises. Increased open interest indicates that more and more new traders are entering the market. At the same time, rising prices also indicate that the buying pressure in the market is reselling. This is a bullish signal.
In an uptrend, prices increase while open interest decreases. This indicates that the driving force for the price increase came mainly from the liquidation of short positions, and the overall capital market was at a loss. After the short-selling process is complete, the uptrend loses its upward impetus, so this is a bearish signal.
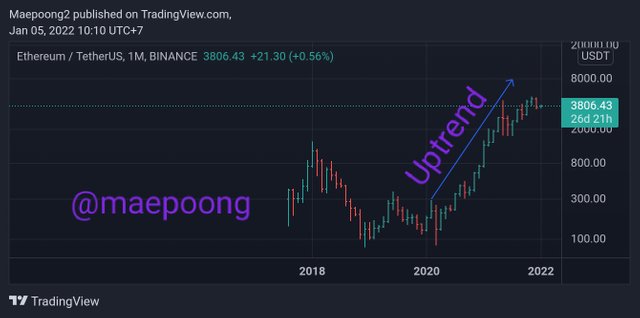
During an uptrend, after exerting pressure, the price exceeds the latest high, and the next high becomes higher than the latest high and keeps updating the high, in other words, the high is higher than the previous high and the low is also higher than previous lows. Once such a move occurs, it can last a long time and rise to prices that were initially unimaginable.
Downtrend
In a downtrend, open interest increases as prices fall. Increased open interest indicates that more and more new traders are entering the market. The current drop in price reflects that newly engaged sellers are bold and active, and the possibility that the downtrend is continuing to increase, which is a bearish signal.
In a downtrend, prices fall while open interest decreases. This indicates that the main drivers of price declines came from long cuts and liquidations. Once the position drops to a sufficiently low level, the long-term cutting process ends, and the downtrend is likely to end, so this is a bullish signal.
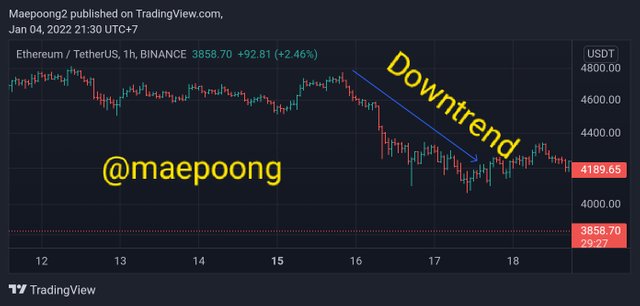
During a downtrend, after making a return, the price will fall below the latest low, and the next low will be cheaper than the most recent low and will keep updating, in other words
the high price is cheaper than the previous high price, and the low price is also cheaper than the previous low price.
Once such a move occurs, it can last a long time and drop to prices that were initially unimaginable.
3. Explain the Bar Combinations for Spending the Day inside for both conditions.(Screenshots required)
Spending the day inside for both Bullish and Bearish conditions, then the bar in this condition really causes market speculation whether the market will go up or down, traders will naturally hesitate to invest.
In this case the high of the last bar is lower than the high of the first bar and the low of the last bar is higher than the low of the first bar on the chart.
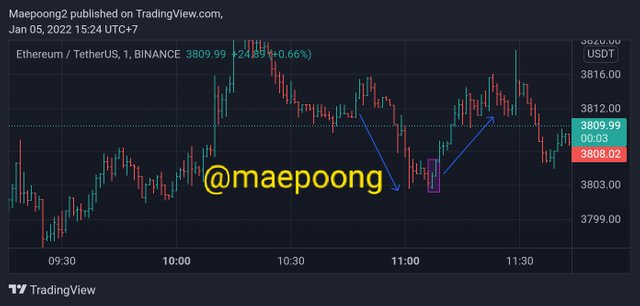
Bullish inside
In case of a bullish bar combination to spend the day inside, then the first bar looks red on the chart, thus closing lower than its opening price on the chart. While the next bar is observed to close higher than the opening price on the chart, even though its open and close are still within the range of the previous price bar this is the condition for a Bullish bar to spend the day inside.
Bearish inside
In this case that is spending the day inside for a Bearish trend then this condition usually occurs when the price bar has formed a close at the high of the previous price bar at the same time the open finds the downside and the lowest price is found above the lowest price of the previous bar in Bearish conditions.
4. Describe the Bar Combinations for Exit on the Day for both conditions. (Screenshots required)
The case of the problem of exiting the combination of the day's bars is a possible trend reversal signal or trend continuation on the chart. We have to pay attention to the price of the open and close bars appearing outside the day and also the highs and lows that appear on the chart these are the bar conditions that may occur.
Bullish to come out on the day.
So on the issue exit on this bullish day, we will see the open from the low and the close seen at the high on the chart. In this case the close will be higher than the previous price bar than the previous high on a Bullish condition to exit the day.
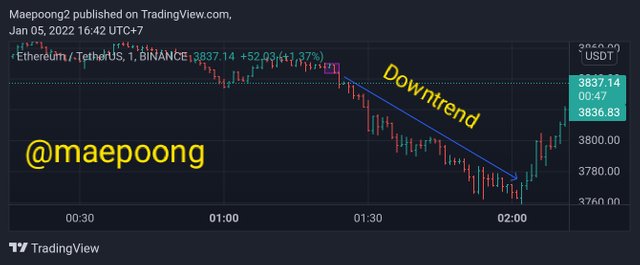
Bearish to go out for the day.
In the Bearish case to exit the day usually indicates that there is a downtrend because you will be able to see that there is an opening of the highest bar price and a close close to the lowest bar price but the close is usually lower than the previous bar price than the previous lowest bar price as shown in the picture below this.
5. Explain Bar Combinations to Find the close at the open for both conditions in each trend. (Screenshots required)
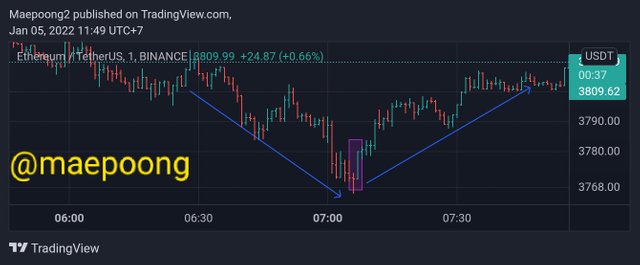
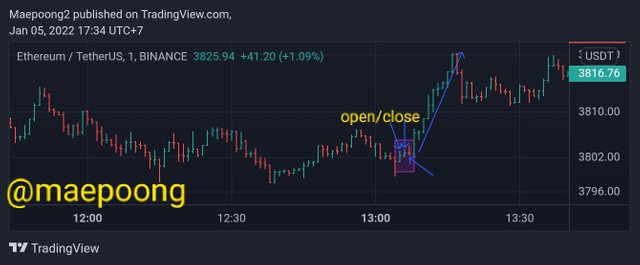
Finding the Close at the Open in an Uptrend.
In the case of a combination of bars to find the close and open of an uptrend as shown in the figure below, we will find a condition where the trend direction will be higher with the open and close ranges observed on the spring above the high of the bar on the chart. So this indicates an uptrend price movement but when observed near the low on the bar chart, we should anticipate a bar price trend reversal as shown in the image below.
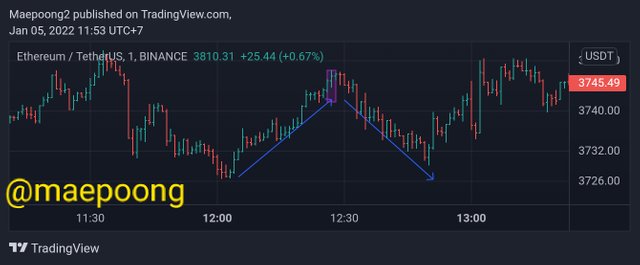
Finding the Close at the Open in a Downtrend.
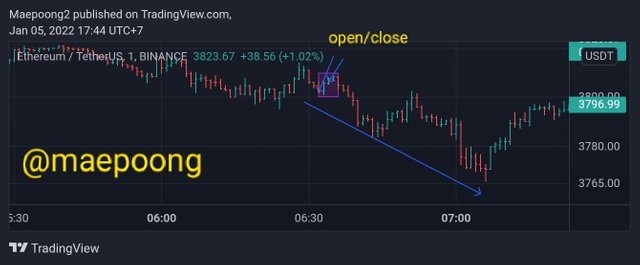
In this case the combination of bars to find the close at the opening of the downtrend where the close and open of the price bar we can see the direction is going down following the direction of the trend. In this case, we can see that the opening and closing are lower than before, so this indicates the downtrend will continue and it is possible that a trend reversal will occur in the near future.
Conclusion
Price bars are a simple method of presenting price information, widespread in Europe and the United States, These bars are vertical bar charts, from which two horizontal lines extend to the right and left. The upper point of the bar is the maximum price, the lower is the minimum price, the right line is the closing price, the left is the opening price. The chart allows us to analyze how the price changes in the trading period. So this is a basic reference in making trades and determining our trading direction, of course, to benefit from the price bars that we analyze.
Finally, thank you very much to Professor @sachin08 who has given this amazing lecture, hopefully it will be useful for all of us in analyzing price bars.