STEEMIT CRYPTO ACADEMY SEASON3-WEEK 5 | CRYPTOCURRENCY TRADING WITH THE ICHIMOKU-KINKO-HYO INDICATOR - PART 2

Authored by @madridbg, via Power Point 2010, using public domain images. Gerd Altmann
Greetings and welcome dear readers who are passionate about educational content associated with the world of trading and cryptocurrencies in general. Content that are being promoted from the #SteemitCryptoAcademy community and have become a trend on the #Steemitblog platform, product of the dynamism of its courses in the different seasons that have been carried out.
The next installment, will give continuity to the teaching driven by Professor @kouba01, which refers to the understanding of the conceptual and practical aspects of the ICHIMOKU-KINKO-HYO indicator.
In this sense and without further ado, we start with the activity that concerns us:
1. Analyze your understanding of Kumo, as well as your two lines.

As mentioned in the first installment associated with the Ichimoku indicator, this represents an instrument that allows us to identify levels of support and resistance, as well as the movement in trend that can present the price of an asset, its fundamental principle is based on a balance, which allows us to determine the price action to abnormal variations of this.
We must also remember that the indicator is composed of 5 fundamental components, which we will not discuss because they were already studied, so we will focus on evaluating the behaviors and compression of the KUMO that is generated as a result of the interactions between the lines Senkou Span A (SSA) and Senkou Span B (SSB), understanding these as lines of leadership within the indicator.
Referring to the Cloud or KUMO, we can establish that it is a visual component if you will, which allows us to obtain relevant information about the trend of the asset, the same is based on an anticipated projection of the price, a quality that make the indicator very dynamic due to its anticipated projection, in other words, through the cloud we can have an overview of the market balance as well as the different phases of the trend that follows the asset in question, referring to uptrends, downtrends or neutral also known as range or lateralization of the price.
Another interesting aspect that we can analyze through the cloud or Kumo of Ichimoku is the volatility of the market because when there is a high volatility, the channel of the cloud becomes larger product of the separation generated between the lines Senkou Span A (SSA) and Senkou Span B (SSB), otherwise when there is low volatility the channel becomes narrow and the lines mentioned above are close to each other.
In reference to the understanding of the lines Senkou Span A (SSA) and Senkou Span B (SSB), we can establish that these allow us to serve as supports and resistances, that is why when the market is in an uptrend, the price is above Kumo, where the retracements that are marked tend to respect as support the lines mentioned above.
On the other hand, when the market is in a downtrend the price moves below Kumo and in case of bullish retracements the SSA and SSB lines behave as resistance aspect that we will address in depth in the next section.
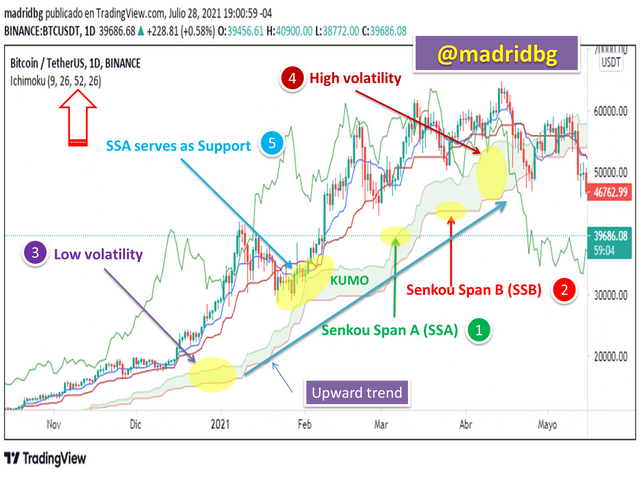
By way of detailing in a visual way some relevant aspects about the Kumo and the SSA and SSB lines, let's review the previous chart for the BTC/USDT pair in daily temporality, where we can observe through the Kumo cloud a clear uptrend, in addition we can evaluate the volatility levels in several areas of the chart, as well as some areas where the price respects the lines as support.
For the downtrend the same principles are fulfilled, and in the following chart we can observe in detail the behavior of the SSA and SSB lines as well as the Kumo generated for the BTC/USDT pair in 1 hour timeframe.

2. What is the relationship between this cloud and the price movement, and how are resistance and support levels determined with Kumo?
As previously mentioned, the width of the channel that forms the cloud or kumo of the Ichimoku indicator is one of the most marked relationships between the price and the cloud generated, since it delimits the volatility of the same, i.e., a wide channel establishes high volatility, while a narrow channel shows low volatility.
In other words, the thicker the cloud, the greater the divergence between the SSA and SSB lines, so the price in descending form and in the presence of a wide cloud will be more difficult to break it (support) and if it breaks it in the retracements this will behave as a resistance difficult to cross. See chart below. So handling this information will allow us to speculate or operate more carefully in the market.

In the previous chart we can observe certain points where the price bounces on the SSA or SSB lines in such a way that these behave as supports and resistances at the same time, so that if the price generates a downward movement and meets the cloud, the SSA line will behave as a support (pattern 1). When the opposite happens and the price moves up and meets the Kumo, the SSB line, behaves as a resistance (pattern 2).
Unlike traditional technical analysis, the use of the Kumo as support and resistance provides greater security to the trader since it is formed based on historical data that correspond to 26 and 52 periods with their respective projection into the future, in search of equilibrium zones according to the price action.
Important note: the degree of strength of the support or resistance is determined by the thickness of the cloud as we explained previously.
There are other elements that allow us to relate the price to the cloud, which we will list below:
1. The location of the cloud is another relationship, because when it is above the price action, the price alerts us of a downtrend, otherwise, if the cloud is below the price, it is a clear alert of an uptrend.
2. In reference to the trends we can establish that the direction of the cloud is related to the price, since the cloud tracks the price, so that when the direction of kumo is upwards it indicates an uptrend and vice versa a downtrend, in case of laterization the cloud originates flat, which indicates that the price has entered a range.
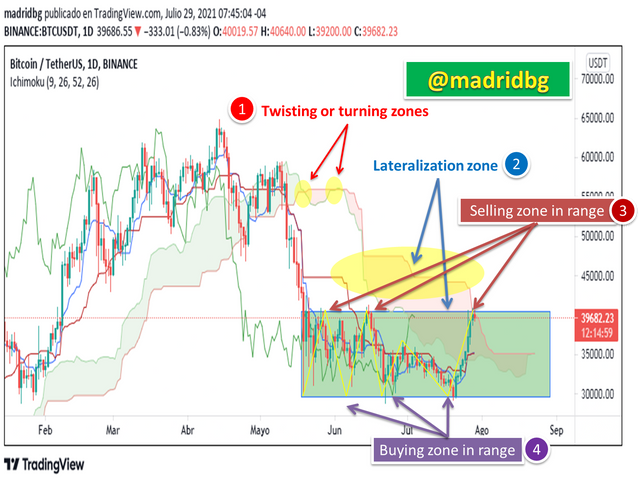
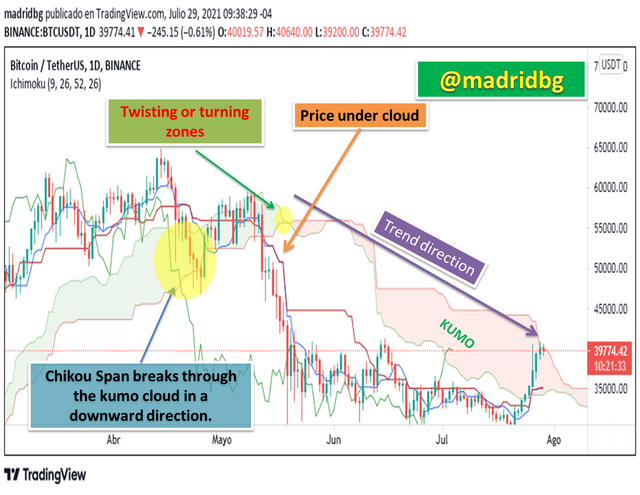
3. Another aspect that delimits the relationship between the cloud and the price is the turn or twist that can be generated on the Kumo, the same is a sign of the weakening of a trend and we must prepare for a possible end of the trend or action that was generating the price.
4. Another relationship variable are the conflict zones difficult to operate with the indicator, this is formed when the price moves within the channel or kumo generated, which indicates indecision in the market and it is preferable to operate only when the price has broken these areas.
5. The time projection is another variable that allows us to make a relationship between the price and the cloud since the SSA is projected based on 26 periods while SSB for longer periods of 52 periods.

3. How and why is twist formed? And once we have "seen" twist, how do we use it in our trading?
As mentioned above, the visual approach is a quality that we can exploit through the Ichimoku cloud as it allows us to establish the type of trend that the market is following or if it is sideways.
In this sense, when we follow a trend a very narrow channel can be generated that facilitates the approach of the SSA and SSB lines. This approach gives rise to the formation of a twist where the SSA line crosses the SSB line, either from top to bottom or vice versa causing a twist in the Kumo cloud.
This turn is a good indication that the holding has lost strength and has weakened and that the price is likely to enter a range or lateralization that can be exploited if we establish the high and low points of the range, entering below on buy and selling above.
In the following chart we can observe for the BTC/USDT pair in daily timeframe, that the continuation of the uptrend was interrupted with the presence of the kumo twist or turn (pattern 1) and immediately followed by an imminent fall in the market product perhaps of fundamental analysis, fall that led to the formation of a range (pattern 2) that we can take advantage of according to the signals marked as pattern 3 and 4.
4. What is Ichimoku's trend confirmation strategy with the cloud (Kumo)? And what are the signals that detect a trend change?
We usually go by the direction of the kumo cloud to establish that a trend is bullish or bearish, although we can also use it to delineate the presence of a range or lateralization in the price action.
It is certainly a good indicator, however, if we want to implement the Ichimoku indicator as a professional trading system we must be clear that there are other variables that allow us to confirm the movement of the trend of an asset, among these stand out:
1. Evaluate the price action, since if this is within the Kumo cloud it is best to wait for this manages to break the cloud and analyze the next movement, which will give us an overview of the continuity of the price and a better way to evaluate the behavior of the same, assuming what was exposed in the previous sections, where it was taught that the SSA and SSB lines that generate the kumo function as support and strong resistances.
2. Evaluate the behavior of the Chikou Span, since this line tends to break the cloud or kumo in the direction of the trend, for many trader this is a definitive confirmation, since if we analyze the movements of the Chikou Span we will realize that it bounces in the areas of support and resistance generated by the SSA, SSB and Kijun Sen lines.
Undoubtedly these three elements we can use to confirm the price trend, referring to the behavior of the Chikou Span, the direction of the cloud and the price action in front of the kumo.
5. Explain the business strategy using cloud and chikou span together.
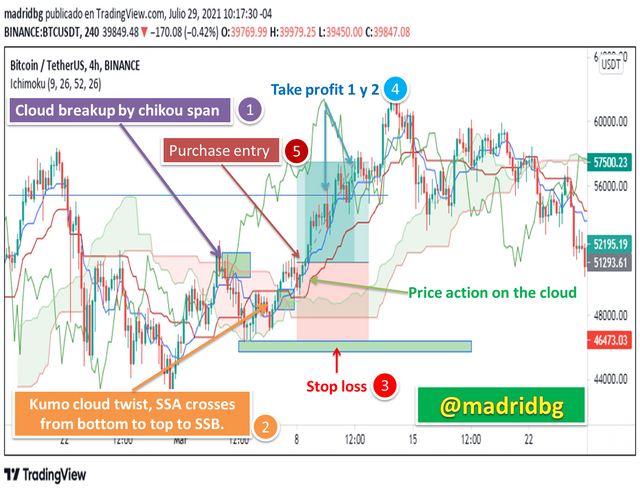
When we talk about trading strategy we refer to a trading mechanism that allows us to obtain profits from the market based on a specific asset, in this particular case we will use as a reference the BTC/USDT pair in 4 hour timeframe.
For this we need to analyze the chart and we will find details of the trading strategy based on the cloud and the chikou span line, in this sense, we have marked the entry based on the following criteria:
1. The chikou span line, crossed the kumo cloud from bottom to top, which gives us a possible confirmation of a trend change from bearish to bullish (pattern 1).
2. In pattern 2 we observe the torsion generated which is another indication that does not manifest that the price can go bullish.
3. If we observe the entry in purchase (pattern 5) that I have stipulated, we realize that if you want it is somewhat late, because previously we mentioned that a change of trend usually ends in a range, so it is preferable to observe a breakout of the cloud to decide to enter into purchase. Likewise we realize that the pullback prior to the breakout, used as support the SSA line, which is another indicator of the upward movement of the price, so the entry was under pattern confirmation.
4. Regarding the stop loss levels and knowing that the Kumo cloud serves as support, its strength is limited since the cloud is very narrow so that we place the stop loss below the SSB line specifically on the lowest low prior to the twist as we see in the chart, also the take profit levels for being 4 hours trading I set it respecting the rule 1:1 risk reward although this is a function of the criteria of each trader.
Note: in case of a strong upward movement it will be evaluated whether or not to take the partial profits generated according to the price action.
6. Explain the use of the Ichimoku indicator for scalping trading strategy.
As we all know scalping is a trading strategy that is developed in extremely short periods of time ranging from 1, 5, 15 minutes according to the trader. Knowing this, let's focus on explaining the strategy based on the Ichimoku indicator in a 5-minute timeframe for the BTC/USDT pair, as we can see in the chart below.
It is necessary to emphasize that there are several authors who state an advantage to perform the analysis on a 15-minute chart and then look for entries on a chart of less timeframe so that gives us time to enter and make successful trades. Having clear these arguments we start with the trading plan under the scalping methodology.
Scenario 1: we delimit the entry based on the supports generated by the SSA line of the cloud which being a clear uptrend every time it reaches this area bounces upwards, bounces that are confirmed with the movements made by the chikou span line, so that the entry is configured as seen on the chart.

Scenario 2: we take into account the crossing that the price makes over the Ichimuko cloud and once it has crossed it with force we enter in purchase to take advantage of the bullish path, scenario that is confirmed with the breakout movement previously marked by the chikou span line. For more detail in this regard see the chart above.
Undoubtedly there are many variant that we can take advantage of depending on Ichimuko indicator and for low seasons the same is suitable to behavior and price action.
FINAL CONSIDERATIONS
As we were able to evaluate throughout this writing and the teaching transmitted by the professor, the Ichimuko indicator represents an adequate strategy to be more efficient when trading the market, the same from its different components does not provide a breadth on the price action, so we can know the trend, areas of higher volatility, supports and resistance generated by the asset, as well as periods of indecision or range that are created in the market.
Sin suda is a very complete strategy and its 20 years of operation add greater reliability to it, since it has managed to resist the variants in time and has managed to adapt to any type of market, so the acquired teaching is full of value before the mentioned aspects.
In this sense, I extend my thanks to the SteemitCryptoAcademy team for these valuable courses, to the teacher @kouba01 and the team of curators.
OF INTEREST

#cryptoacademy #kouba-s3week5 #venezuela #steemexclusive #steemit #technicalanalysis #steemitcryptoacademy #steemitblog
Hello @madridbg,
Thank you for participating in the 5th Week Crypto Course in its third season and for your efforts to complete the suggested tasks, you deserve a 7.5/10 rating, according to the following scale:
My review :
Good work in general, in which you covered most of the aspects required to understand the Kumo and its uses, and I have some notes:
Your interpretation of the cloud was good and clear, however, you did not deepen the analysis of the two lines that make it up.
As for the second question, you dealt with it in an excellent manner, analyzing the two elements in depth.
The method of trading after the twist did not go into depth in its explanation and analysis.
Thanks again for your effort, and we look forward to reading your next work.
Sincerely,@kouba01
Greetings Professor @kouba01, thank you for the comments made and for the assessment of my writing, I will take the respective corrections for a next delivery. Success in your activities