STEEMIT CRYPTO ACADEMY SEASON 3 - WEEK 7 | CRYPTOCURRENCY TRADING WITH AVERAGE DIRECTIONAL INDEX INDICATOR (ADX)
Authored by @madridbg, via Power Point 2010, using public domain images. Gerd Altmann
Greetings and welcome dear readers who follow my blog, this installment is aimed at fulfilling the task corresponding to week 7 of Professor @kouba01, associated with technical analysis using in the world of trading and that is driven through the community of #SteemitCryptoAcademy.
In this regard, let's get to the delivery approach.
CONCEPTUAL AND PRACTICAL APPROACH TO THE GENERALITIES OF THE AVERAGE DIRECTIONAL INDEX (ADX) INDICATOR

In this section of the subject we will begin with the answers to each of the questions provided by the teacher that will allow us to comply with the work requested by the teacher.
1. Discuss your understanding of the ADX indicator and how it is calculated. Give an example of the calculation.
As mentioned in the class addressed by the teacher, the ADX is an indicator with a long history dating back to 1978 and its purpose is to show the strength and direction of the price action of an asset.
This non-directional oscillating technical indicator has the ability to quantify and determine the strength of a trend regardless of its direction, it gives us the average directional index of an asset, hence its initials ADX. In this sense, it is commonly used with directional movement indicators such as the DMI since together they can evaluate strength and direction of the asset's price.
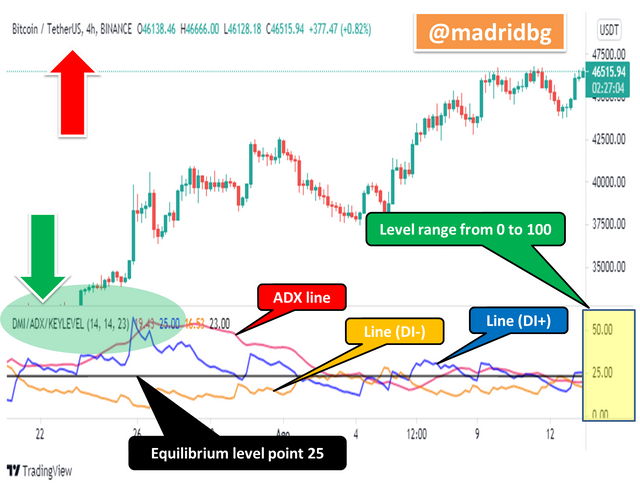
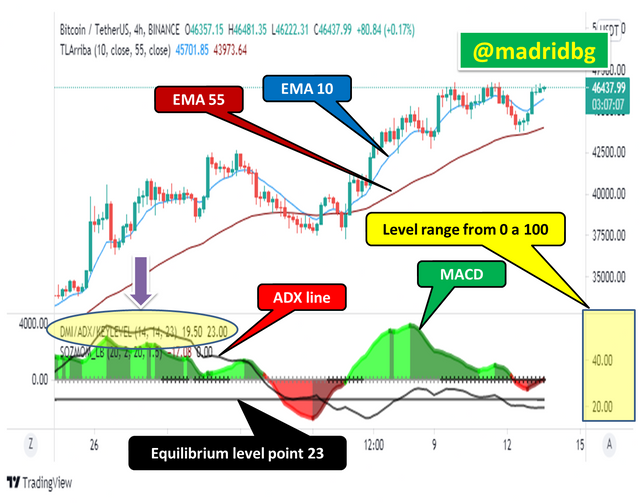
At a technical level the indicator moves in a range of values ranging from 0 to 100 where we can establish analysis category according to this scale or range, and that allows us to determine the presence or not of a trend, among these values stand out:
1. When the ADX line moves between 0 to 25, we can establish that there is no clear trend and if there is one, it is considered as weak.
2. When the ADX line moves between 25 to 50, we can evidence a trend in the market, and based on this we can speculate according to the strength of the trend.
3. If the ADX line, moves between 50 and 70, we can establish that the trend has strength or is very strong, either up or down.
4. Finally, if the ADX line moves between 75 and 100, we are in the presence of an extremely strong trend.
Important note: we must be clear that the ADX determines us the strength of the trend regardless of its direction, so we can accompany it with a directional indicator or otherwise let us go by what is observed to establish the type of trend that generates the price action of an asset.
At the level of technical analysis it is important to evaluate our entries when the line moves near the value 25 as this is the limit that allows us to know the difference between a market without trend or one that has entered a trend and based on these values make decisions within the market or price of an asset.
The ADX indicator and its relation to DMI lines
As previously mentioned, the ADX gives us important information about the strength of a trend, now how we can evaluate the direction of that trend, for this the indicator is supported by two lines or directional oscillators that are responsible for evaluating highs and lows in a range of 14 periods which is the default setting of the ADX.
In this sense the line (DI+), tells us the strength of the uptrend, so that the price is moving upwards, on the other hand the (DI-) gives us information of the downtrend and allows us to infer that the price is moving downwards. Therefore, the convergence and summation of the (DI+) and (DI-) lines generates us the ADX line already studied.
With respect to the convergences, we can establish that if the (DI+) moves above the (DI-) the movement is speculated to be bullish, on the contrary if the (DI-) moves above the (DI+) the expected movement is bearish.
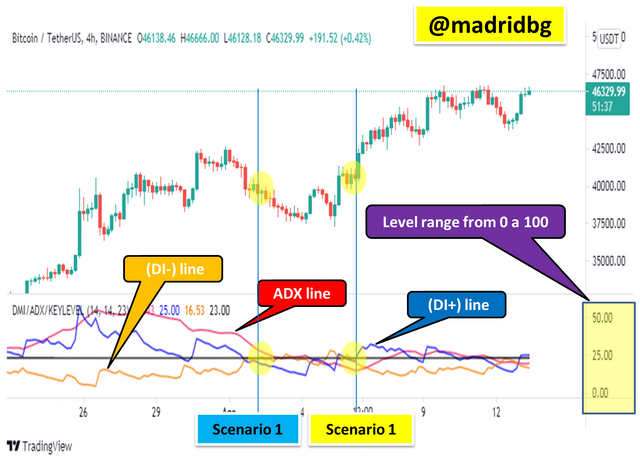
As we can see in the above graph, made established vertical lines that allows us to understand the behavior of the ADX and DI+ and DI- lines, where we can identify in scenario 1, that once the DI- is placed above the DI+ the price begins to fall and the ADX is approaching the line 25 which indicates that the previous trend has lost strength.
In the case of scenario 2, we observe that the DI+ lines is above the DI- line at this point the price starts to rise and the ADX rises towards line 25 showing that the price action has gained strength.
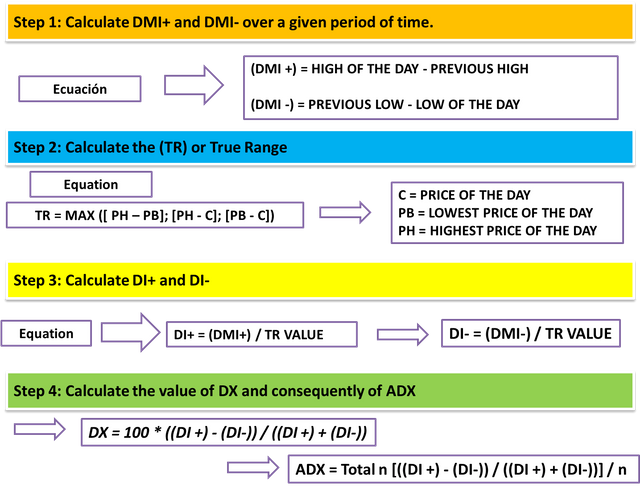
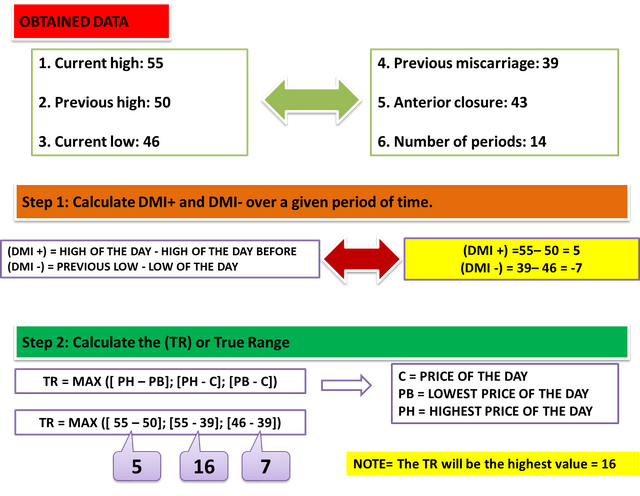
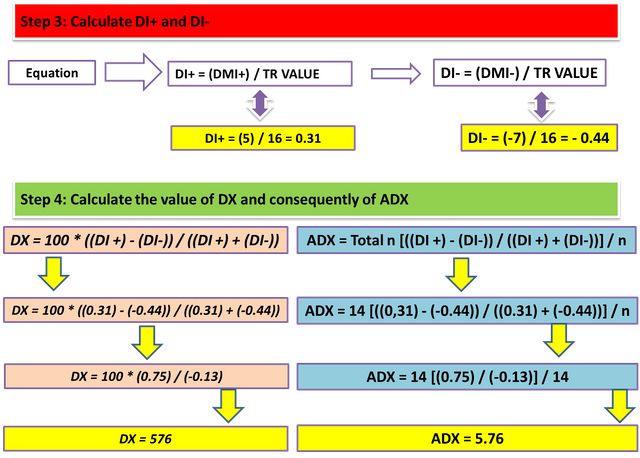
Mathematical procedure for determining the ADX indicator.
In this section of the subject we will rely on Wilder's considerations to mathematically determine the ADX indicator, so that to exert bullish pressures it is necessary to consider two consecutive highs and for bearish pressures two consecutive lows. In this sense, we approach the following sequence of images to determine the ADX.
2. How to add ADX, DI+ and DI- indicators to the chart, what are their best settings and why?
To comply with this section of the subject, we will use the tradingview platform, in this sense we must follow the following sequence that will allow us to include the ADX in the graph of a cryptographic asset.
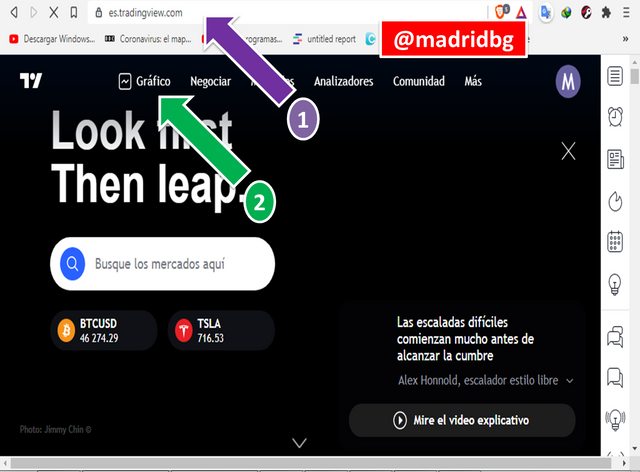
Step 1: go to our browser of choice and search for "tradingview", once inside we go to the charting section.
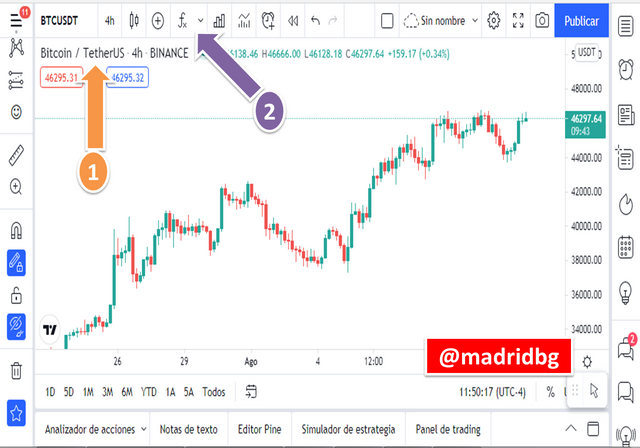
Step 2: Once in the chart we choose the pair we want to analyze, in this particular case we will work with the BTC/USDT pair, in 4 hours timeframe (pattern 1), having this clear we will go to the (FX) section (pattern 2).
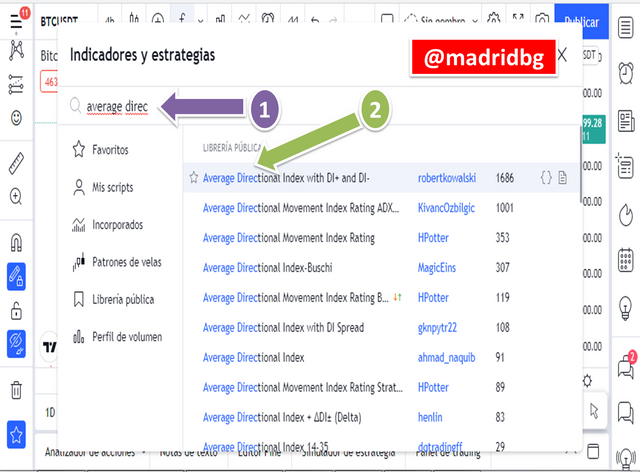
Step 3: In the search engine (FX) type AVERAGE DIRECTIONAL and select the first option, as shown in the image.
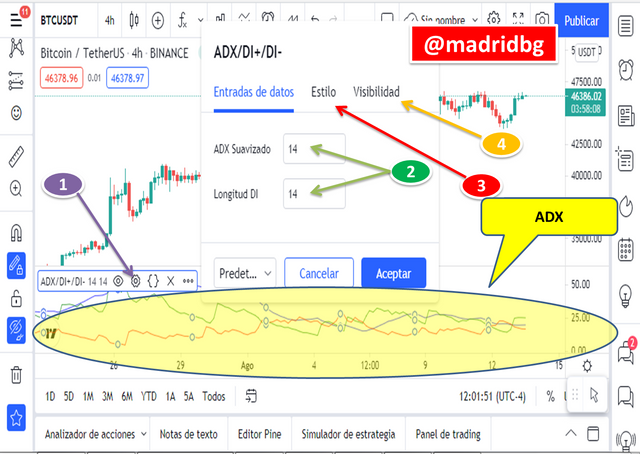
Step 4: For the process of configuring the indicator, we go to the option configure (pattern 1), at this point we can change the data input, setting the value of the period and smoothing we want (pattern 2).
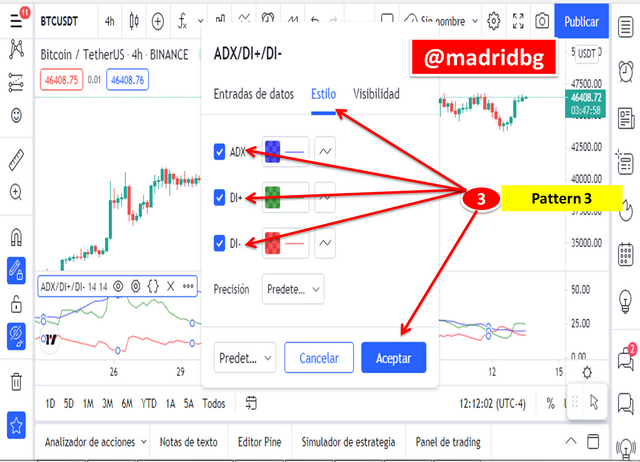
We can also change the color style of each of the DMI+ DMI- indicator lines and the ADX line (pattern 3).
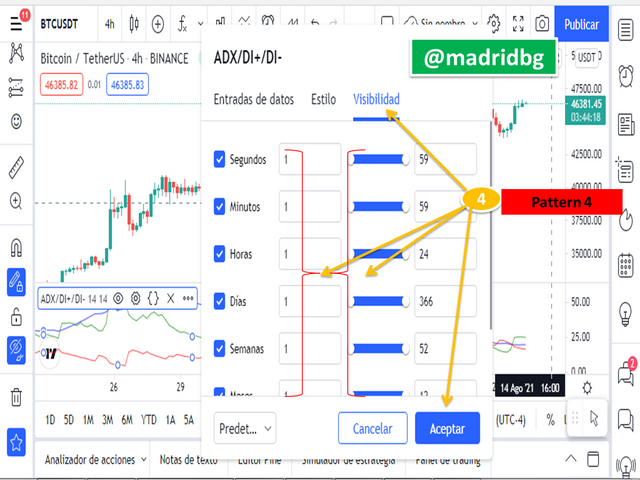
Last but not least the data visibility time (pattern 4), it is advisable to leave these values as default values.
What are your best configurations and why?
To respond to this approach I will be very responsible in mentioning that the configurations must be adapted according to the style and type of trading of each trader, so that it cannot be established that a configuration is better or worse than another, since the same ones go according to the personal work and the way of operating in the market.
What is true is that the default values move according to 14 periods, which is explained according to the number of signals that can throw the indicator, so that if our period range is below the 14 we can get a lot of false signals and at this point we must have a lot of expertise to filter them and catch the right ones.
On the other hand, if the period range moves above 14, the signals we will get would be late and our entries and readings would be late as well. So, I start from the fact of testing different configurations until I get one that suits my needs and trading style.
In the same way it is important to remember that the ADX and the configurations that we decide to use must be accompanied by other confirmation indicators, which allow us to obtain better results and be more profitable in the crypto market.
As the approach made by the professor goes according to my best settings and why these, I can say that the ADX along with the MACD and two EMAs of 10 and 55 periods, are my indicators par excellence as I come doing a good job with these when trading the market.
In the case of the ADX I use it to detect the strength of the trend under the configuration (14 14 23) so I do not use the DI+ and DI- lines since I get the price direction by relying on the EMAs and the MACD as a directional oscillator.
3. Do you need to add DI+ and DI- indicators in order to trade with ADX? How can we take advantage of this indicator?
As mentioned in the previous section, it is not necessary to use the DI+ and DI- lines to trade using the ADX since the directionality of the market can be followed with any other indicator that fulfills this function.
Now one of the ways to take advantage of the indicator is by detecting the strength of the trend, which gives us valuable information if we can predict the direction of the trend.
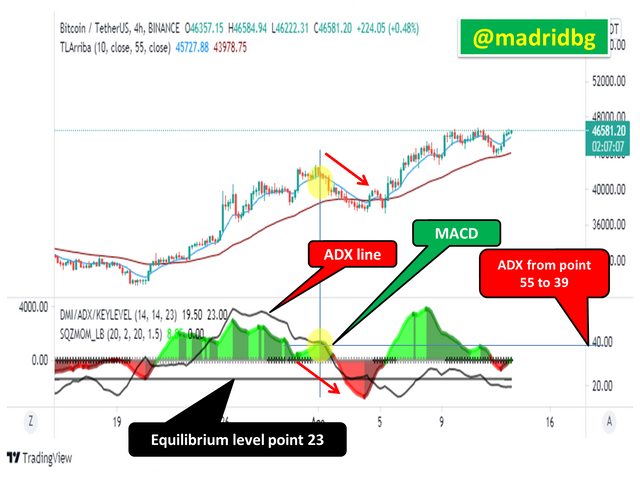
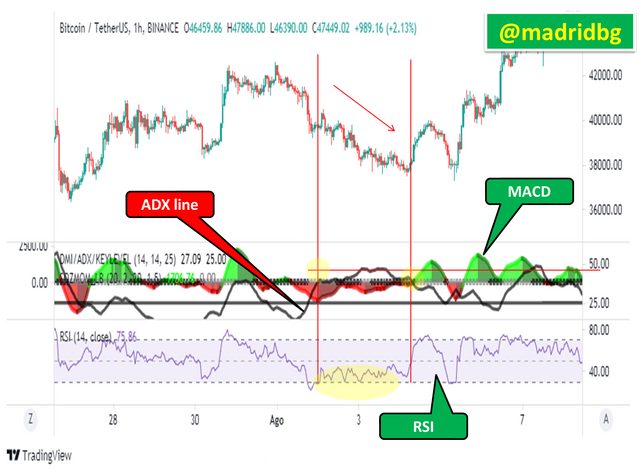
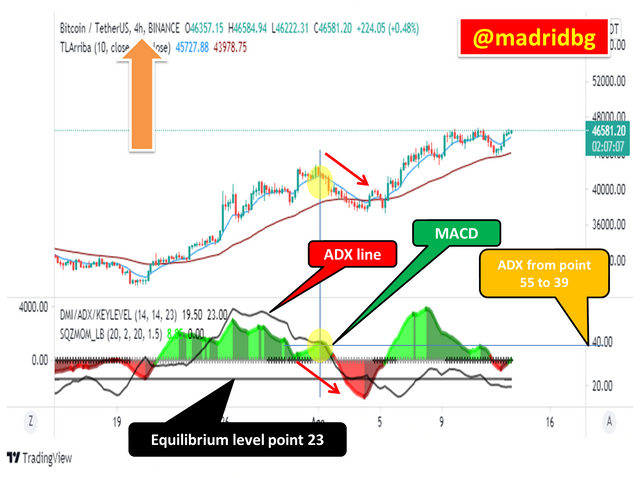
One way to explain the above, we can observe it in the chart above for the BTC/USDT pair in 4 hours timeframe, where the ADX is making a decline from point 55 to point 39 which allows us to think about the fact that the previous trend which is bullish has lost strength, a fact that can be corroborated, by the bearish directionality thrown by the MACD, therefore by this example, we can describe that we do not need the use of the alternating lines DI+ and DI- to be able to operate.
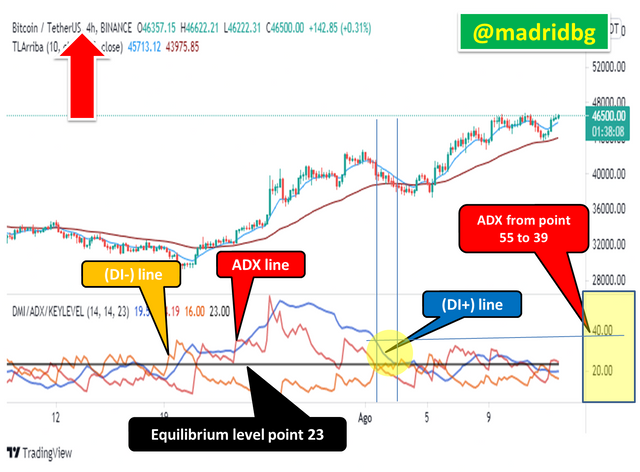
Similarly it is appropriate to analyze the behavior of the asset using the ADX, the DI+ and the DI- lines, so we can observe the following chart, which is the same as the previous one and we can notice the same behavior of the ADX falling point 55 to point 39 which leads us to think about the loss of strength of the previous trend, with respect to the lines DI+ and DI- it is observed that the bearish direction is manifested in a late way, which occurs when the DI- is placed above the DI+, so it is preferable to add an additional indicator to complement the signals given by the ADX.
.
4. What are the different trends detected using the ADX and how does it filter out false signals?
When we approached the explanation and understanding of the ADX, we sort of gave an answer to this approach in ways that are necessary to remember the following categorization:
1. When the ADX line moves between 0 to 25, we can establish that there is no clear trend and if there is one it is considered as weak.
2. When the ADX line, moves between 25 to 50 we can evidence a trend in the market, and based on this speculate according to the strength of it.
3. If the ADX line, moves between 50 and 70, we can establish that the trend has strength or is very strong, either up or down.
4. Finally, if the ADX line moves between 75 to 100 we are in the presence of an extremely strong trend.
Through the above we can establish that by means of the ADX we can determine 4 types of scenarios according to the trend and that we will explain in detail through the use of graphs.
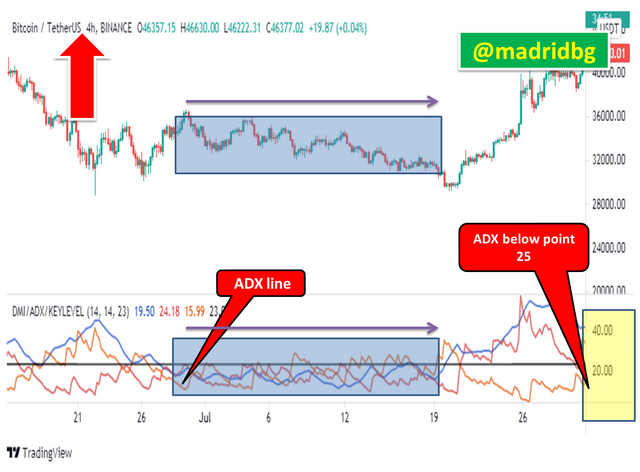
Scenario 1: market in range or in weak trend, as we can see in the following chart for the BTC/USDT pair in 4 hours timeframe, the ADX moves below the 25 point which is an indicator of a possible range or otherwise the absence of a clear trend. Scenario that corresponds with the action, so we were in front of an accumulation range that then terminated breaking to the upside.
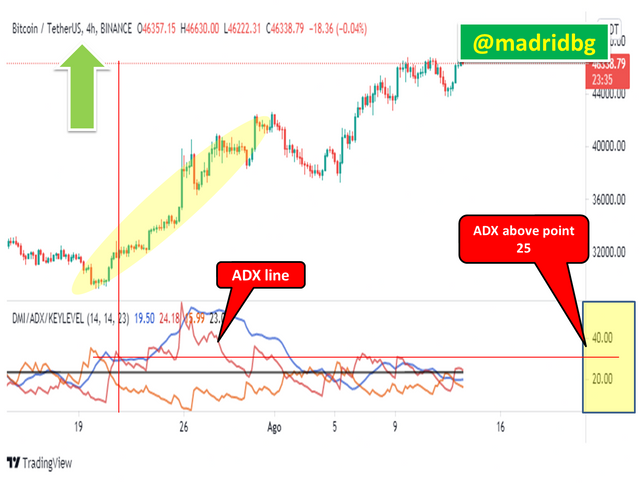
Scenario 2: market in strong trend, when the ADX leaves point 25 upwards we can establish that the market has strength or marks the beginning of a trend, in the subsequent graph we can analyze that the ADX remains above point 25 and that the DI+ line is above the DI- lines, which is an indication that the market has strength upwards, this corresponds to what the price has done.
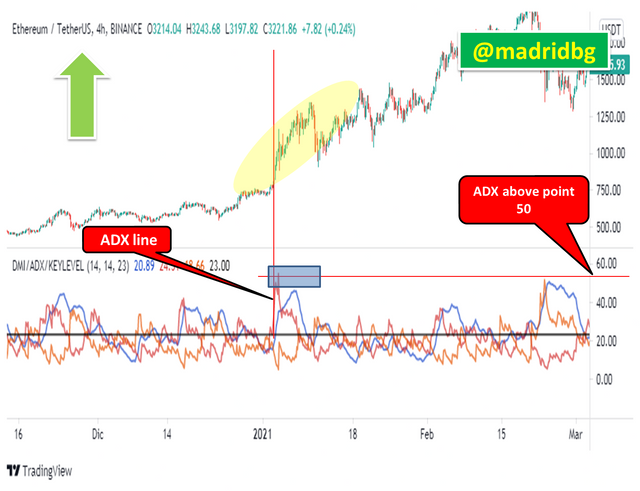
Scenario 3: market in very strong trend, there are periods of time where a large volume of negotiations is observed, which is a trigger for the ADX to exceed the line of 50, at this point we are in a very strong scenario, as observed for the ETH/USDT pair in temporality of 4 hours, we must be clear that it is difficult for the price of an asset to remain in this linearity so it must correct in search of finding investors to gain momentum.
Scenario 4: market in extremely strong trend, this scenario is not very common and occurs when there is some fundamental analysis that moves the market abruptly, so it is formed when the ADX exceeds the line of 75, which ends up making drastic rises or falls.
How do you filter out false signals?
This is a question that many traders ask themselves in terms of any indicator, from my point of view one of the best ways to filter signals is to make the analysis in long periods of time and look for entries in shorter periods of time. In the case of the ADX indicator as mentioned above it is not recommended to use it alone, that is why we can filter the signals by confirmations of other indicators, in my case the MACD and RSI will be a good alternative to filter the ADX signals.
However, we must be clear that this indicator only predicts us the strength of the market, the direction we must evaluate it according to other indicators since the DI+ and DI- according to the period of time in which it is operated, can throw many false and late signals.
Let's do a practical exercise to understand the usefulness of the ADX in correspondence of other indicators such as the MACD and RSI, for this exercise e delimited the scenario with red vertical lines, at this point we can observe that the ADX is above point 25 in ascending form, many would think that the uptrend is winning, however the price ends up falling, and we adopt the ADX signals as false when the scenario is otherwise.
The indicator shows us strength in the trend, the direction is given to us by the MACD, so we can assume in the scenario that the movement has strength to continue falling, as shown in the chart and corresponds to the price action. In this sense, it is necessary to rely on other indicators to filter and take the best signals in the market.
5. Explain what a breakout is. And how is the ADX filter used to determine a valid breakout?
The term breakout in the trading world refers to the fact where the price breaks our stipulated support or resistance levels, which gives rise to the formation of clear bullish or bearish scenarios. However, in one way or another this market seems to be designed to lose and sometimes we speculate a breakout in one direction and the price does the opposite (false breakout) leaving us trapped and generating losses in our capital.
Under this scenario the ADX indicator gives us an excellent alternative to filter and escape from false breakouts, so we can take into account that any price movement below the 25th point of the ADX are considered movements without strength and these breakouts we will not take into account.
On the contrary if the price breaks our stipulated levels and the ADX comes out above the 25 point it is an indication that the movement has strength and is likely to follow the expected direction. Another way to filter with the ADX is when the price is in range for long periods of time, so that a variation of more than 5 points can be considered as a movement with strength or a true breakout (example from point 20 to 25 on the ADX).
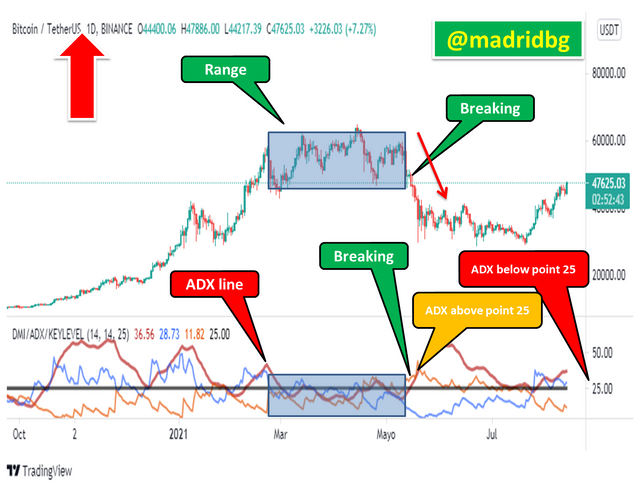
In the previous chart we can observe the range formed in the BTC/USDT pair in daily temporality, where the price remained from March 8 to May 10, 2021 in a laterization, at this point the ADX remained below point 25. Consequently, for May 11 the ADX broke in an ascending way the point 25, which indicates that the movement generated in the price has strength, so that the direction we can identify it with (DI-) above the (DI+) which indicates that the direction is downward. Therefore, it is speculated that the price has the strength to fall and this corresponds to the price realization.
6. What is the difference between using the ADX indicator for scalping and swing trading? Which do you prefer between them, and why?
There is a diversity of traders, as well as the strategies that they can implement when trading in the market, therefore in this section we will use the ADX and we will adapt them to the scalping and swing trading timeframes.
1. The ADX in scalping function, as we all know at this point of the season, is scalping is a type of trading that develops in temporalities ranging from 1, 5 and 15 minutes, where profits are small but the movements can replicare on several occasions during the day which generates good profits.
In this sense, to use the ADX under the scalping mode is necessary to determine the trend that follows the market and identify levels of supports and resistances, on the other hand we can set the ADX in periods of 100 so that unnecessary signals are not generated at the time of trading, in the same way we must rely on other indicators to confirm our entries, among these is the RSI or the Average True Range that fits the temporality and the ADX with the established modifications.
2. ADX as a function of swing trading, as we all know, this type of trading is developed in longer periods of time ranging in daily seasons and 4 hours, it is advisable not to overload the graph as we can make inadequate analysis on the asset. Among the indicators that we can use to accompany the ADX is the Ichimoku, the Pivot points, the MACD or RSI, we must choose two of these to accompany the ADX and operate according to three indicators, are some tips that are made.
According to the configuration of the ADX the values by defects in the personal thing seem to me opportune to operate in daily and 4 hours temporality.
Regarding my personal choice, I prefer to trade in daily and 4 hours timeframe, as it takes less time to review the charts unlike scalping, I usually use the ADX in company of the MACD and two EMAs of 10 and 50 as mentioned above, together the strategy allows me to evaluate the market strength (ADX), the directionality (MACD) and the support and resistance lines (EMA).
FINAL CONSIDERATIONS
Undoubtedly the subject raised by the Professor has been of great breadth, where we were able to address in a conceptual and practical way all the components of the ADX, also managed to recognize the importance of knowing about this indicator and the advantages they provide us when entering the market.
Although it is true that it presents some weaknesses these can be solved by accompanying with other indicators, being able to develop a complete system to filter false signals and breaks in the market, so that a good combination will allow us to establish a winning strategy that allows us to be more effective when entering the market, on the other hand it was possible to establish assertive comparisons between the scalping trading style and swing trading under the implementation of ADX.
So I extend my thanks to Professor @kouba01 and the SteemitCryptoAcademy team for the hard work and great teaching they share with us every week.
OF INTEREST

#cryptoacademy #kouba-s3week7 #venezuela #steemexclusive #steemit #technicalanalysis #steemitcryptoacademy
Hello @madridbg,
Thank you for participating in the 7th Week Crypto Course in its third season and for your efforts to complete the suggested tasks, you deserve a 10/10 rating, according to the following scale:
My review :
Very excellent work which covered the subject in all its aspects in a superb manner and with a solid methodology. Most of the answers were precise and direct, which confirms your good understanding of the questions asked.
Thanks again for your effort, and we look forward to reading your next work.
Sincerely,@kouba01
Greetings Professor @kouba01 you have certainly made my day, it was worth the effort and dedication according to the demands of this activity. It was a superb teaching that I thank you, as it allowed me to understand aspect that I did not know about my trading strategy, with this type of teaching we have been nurtured in the conceptual and practical from cryptoacademy spaces.
Have a great day.
Thank you.