STEEMIT CRYPTO ACADEMY SEASON 2-WEEK 8 | CRIPTOMONED TRADE WITH BOLLINGER BANDS BY @madridbg
Authored by @madridbg, via Power Point 2010, using public domain images.
Greetings and welcome dear members of the @steemitblog platform, the following delivery corresponds to the weekly activities promoted by Professor @kouba01 from the #SteemitCryptoAcademy community, the same has as reference the technical approach of the Bollinger Bands indicator associated with the volatility of the markets.
In this sense, and without further ado, let's start with our work based on the approaches and guidance provided by the professor.

Define the Bollinger Bands indicator explaining its calculation method, how does it work and what is the best Bollinger Band configuration?
1. About the Bollinger Bands indicator
Through sustained reading of the material socialized by the professor, we realize that Bollinger bands is an indicator that allows us to determine the volatility of the market, that is, through its use we can detect the upward and downward variability in terms of volatility, this is determined according to the interest or disinterest of investors in an asset.
The appearance of this indicator takes place in 1980 by the hand of John Bollinger, creator of this sophisticated indicator, and although at first it was designed for the stock market, it is now often used in the forex and cryptocurrency markets, among others.
Methodologically Bollinger bands, creates a kind of volatility channel based on the standard deviation developed in a period of time, once generated the deviation of creating curves above or below this, which are called bands and are assigned the name of its creator Bollinger, these bands gives us important information of market volatility and at the same time can be used as a measure of support and resistance that allow us to enter and exit the market more effectively.
2. Evaluation of the statistical variables behind Bollinger bands
As mentioned in the previous section, Bollinger bands are based on the use of the standard deviation of the moving average calculated for a predetermined period of time, in other words, if we choose a period of 20 days, statistically we will be adding the price in that period of time, which we will divide by the number of days stipulated, which will generate a moving average per period of time, as expressed in the following equation:

Equation 1. Determination of the moving average.
Once the average or moving average is obtained, we will apply a statistical device called standard deviation, a variable that allows us to establish the volatility of the market according to a specific asset. It is necessary to emphasize that according to the period of time previously stipulated, the standard deviation can be calculated according to the following criteria:
1. when our temporality is 20 periods, we must apply two standard deviations both above and below, which will generate us the upper band, as well as the lower one.
2. For a 10-period seasonality, we must apply 1.5 standard deviations, which will generate the respective bands.
3. When the time horizon is 50 periods, 2.5 standard deviations are applied for both the upper and lower bands in order to generate the volatility channel.
If we analyze the previous criteria, we realize that the Bollinger bands can be modified according to the requirements and type of trading of the user, so that the standard deviations must be adapted according to the time frame with which we will enter the market.
3. About the best Bollinger Band configuration
From my perspective, the best configuration to approach the market using Bollinger bands is the default one, i.e. 20 periods and 2 standard deviations, which allows us to generate the upper band as well as the lower band. By consulting the literature I have found that under these configuration parameters, it is estimated that 95% of the candles that are generated in the market will enter the tracking channel generated by the indicator, which will facilitate the interpretation of the same.
Based on the above, we will use the approach of the professor to detail the initial configuration of the Bollinger Bands using the tradingview platform in the following sequence.
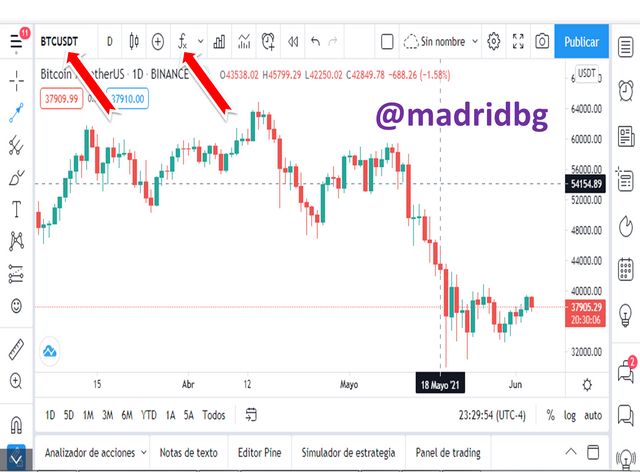
Step 1, enter the tradingview page and choose the asset pair we want to analyze, in this particular case we will use the BTC/USDT pair.
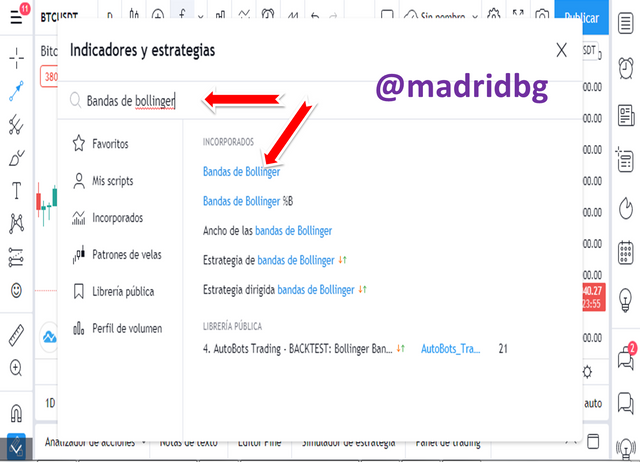
Step 2, enter the Fx option and type Bollinger Bands, as shown in the image.
Step 3: this step will allow us to configure the indicator according to our trading needs, for the example, we will use the default values, that is, a length of 20 periods (Pattern No. 1), 2 standard deviations (Pattern No. 2) and uj zero offset (Pattern No. 3).
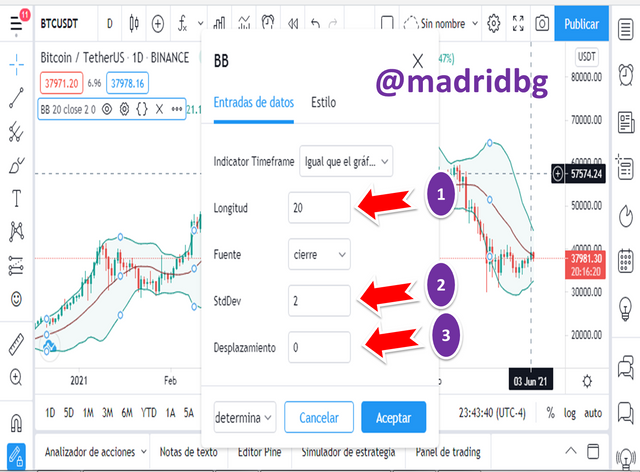
Regarding the appearance we can also configure it according to our taste, at this point we can modify the color and style of the average line (1), the upper (2) and lower band (3) and the background of the indicator (4).
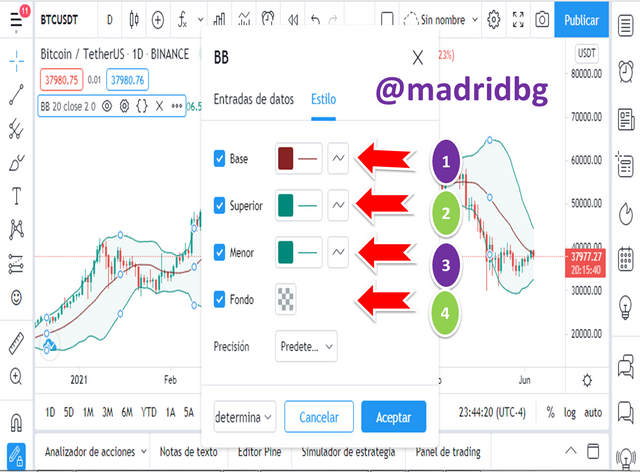
Important notes: As we can observe the aesthetic configurations, as well as the values according to the period and the standard deviation to we can adapt to our needs.

What is a rupture and how is it determined?
From my point of view the breaks analyzed using the Bollinger Bands indicator, occurs when the market enters a period of indecision, either to consolidate or to distribute, a phenomenon known as a range. When a range occurs we observe that the Bollinger Bands approach each other and form a fairly narrow channel.
At this point we rely on the supports or resistances to decide to follow the breakout either in bearish or bullish orientation, once the breakout is generated we will observe that the generated candles will come out strongly from the channel generated by the bands, which will begin to follow the price and the channel will begin to become larger according to the price action. Let's look at the chart and analyze the above statements.

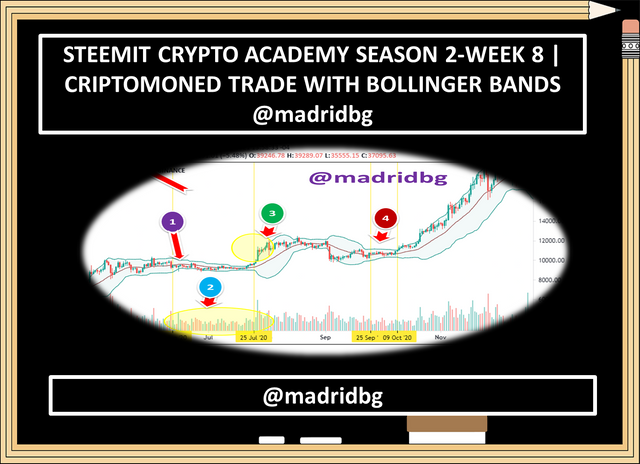
As we can see in the chart, the evaluation period that we will perform is from June 12 to June 25, 2020, during this time we can observe the following:
1. Pattern 1, the Bollinger bands have approached generating a narrow channel, which tells us that the market is in range or period of low volatility and is preparing for a breakout, which corresponds to the volume profile (Pattern 2) where the interest of investors is low compared to other time periods.
2. Pattern 3, the bullish candlestick generated strongly exceeded the upper Bollinger band. which tells us that a bullish breakout has occurred in the BTC/USDT pair.
Note: The analyzed behaviors in the market are repeated again between September 25 to October 08, 2020, which allows us to speculate in the same way the price action (Pattern 4).

How to use Bollinger Bands in a trending market?
As the professor explained in the socialized material, trends based on Bollinger bands are easily identified, we only need to observe when the bands go up and generate an uptrend (Pattern 1) or when the bands go down and give rise to downtrends (Pattern 2).
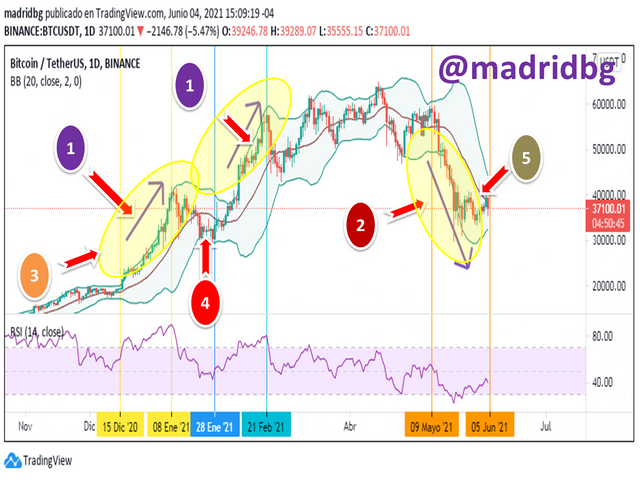
Now deciding to operate in a trending market depends on the analysis we perform on it, as we can see in the graph 7, the BTC/USDT pair from December 15, 2020 to May 9, 2021 the bitcoin trend has been bullish, with significant and normal setbacks of any trading asset.
For this particular case, the price is always above the general average (Pattern 3) and moves towards the upper band which allows us to infer that at this point the asset has entered oversold and that a pullback is coming, which gives us time to evaluate our new entry support.
To enter into buying again, it is appropriate to wait for the price to generate a bullish momentum (Pattern 4) which corresponds to the lower band, where the asset is being oversold, this momentum we will evaluate based on consecutive candlesticks of bullish nature, which give us the entry to the market.
Important note: For the bearish market we speculate and simulate, in this case our support is the lower band and resistance, corresponds to the average moving average, as seen in pattern 5.

What is the best indicator to use with Bollinger Bands to make your trade more meaningful?
So far, we have studied three types of indicators RSI, MACD and Bollinger bands, from my perspective and the knowledge achieved so far, I dare to express that I feel safer entering the market with the MACD indicator and Bollinger bands, to which I will attach an ADX and volume profile by section that will allow us to know the important trading points in the asset (Pattern 1) these we will assume to establish our levels of support and resistance.
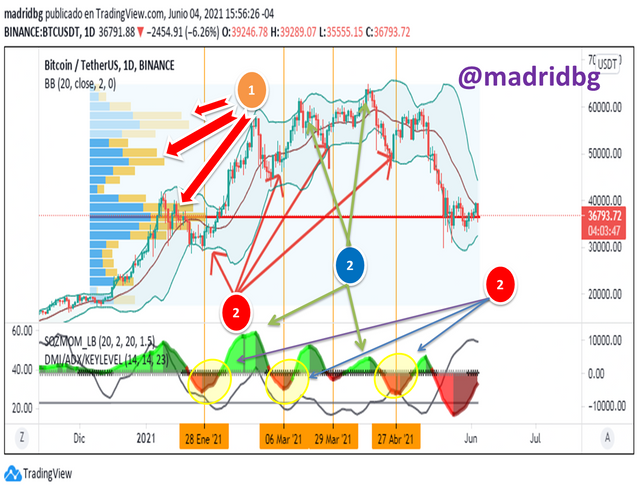
Now in order to justify the choice of indicators that will make the Bollinger bands give us more significant extracted, let's analyze the graph 8. Note that the ADX and MACD allow us to know the direction and strength of the market under patterns already established (2), the bullish direction with negative slope indicates that it is an opportunity to enter into purchase signal that we confirm with the Bollinger bands, if we want to sell we must wait for the bullish MACD monitor generates some weakness (Pattern 3), signal that we confirm with the upper Bollinger band.
We must remember that the choice of indicators depends on each afternoon and the information you have about each indicator you will use.

In what time period do Bollinger Bands work best and why?
Undoubtedly the Bollinger bands indicator, gives us valuable market information, now due to the approach that allows the indicator to the price action I consider appropriate to implement it in short periods of time for example scalping, where we can follow the price action more effectively, because the candles are generated quickly.
Personally, I do not usually do scalping or trader in periods less than 4 hours, so in my case I must adapt the indicator under the intraday methodology.
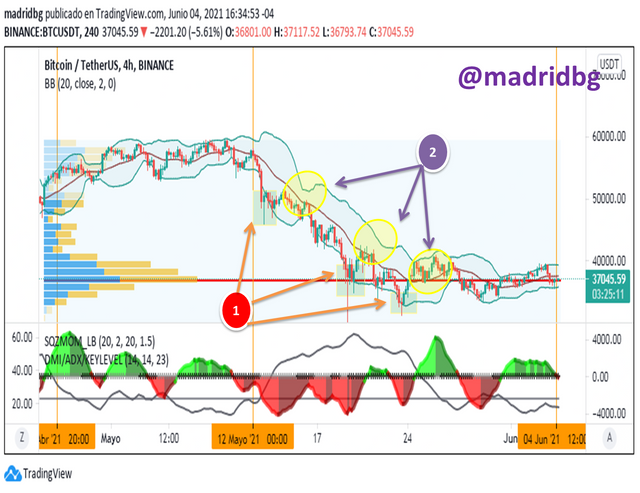
As we can see in the chart the BTC/USDT pair from May 12 to June 04, 2021 the market has fallen into a downtrend, where the price is below the average moving average. Based on this, our entries would be at the support generated by the lower band (Pattern 1) and the exits would be evaluated at the resistance generated by the average moving average, i.e., we would enter the market on the bullish bounces. (Pattern 2)

Review the chart of any pair and present the various signals given by the Bollinger Bands indicator.
In order not to make this activity more extensive, we will indicate all the signals in the graph to which we will assign a numerical value for further analysis.
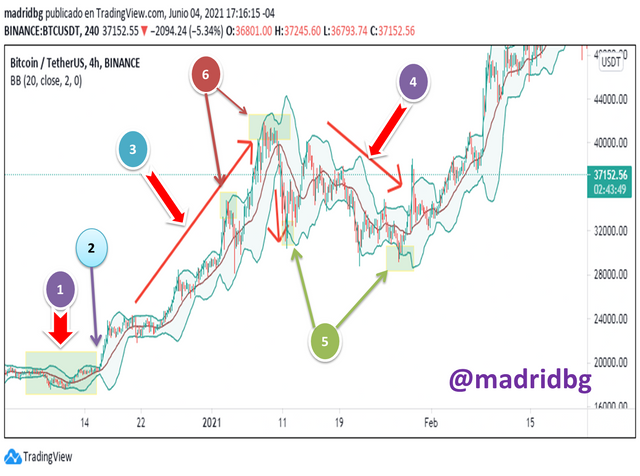
If we look at the chart we can observe the following signals:
Pattern 1, we observe a narrow channel that does not indicate low market volatility, so we must be alert for a possible breakout.
Pattern 2, we observe that the candlestick generated is above the upper Bollinger band, which indicates a bullish breakout in the market.
Pattern 3, under the price action we can observe an uptrend.
Pattern 4, corresponds to a bearish period in the market.
Pattern 5, corresponds to an oversold asset, so we will be in buying zones.
Pattern 6, corresponds to an overbought asset, at this point it is a sell signal.
CONCLUSION
Undoubtedly the approach made by the professor on the Bollinger Bands, allowed us to have a broader view on the Bollinger Bands, where the configuration is essential for any type of trader from the most advanced to the novice that we are starting in the digital world.
Similarly, it is worth mentioning that the approach of the indicator, allows us to know about the directionality of the market, volatility, overbought and oversold zones, as well as setbacks and breakouts that can be generated all in function of making increasingly reliable analyzes.
OF INTEREST
•

#cryptoacademy #kouba-s2week8 #bollinger #bands #indicator #cryptocurrency #trading #steemitcryptoacademy
Hi @madridbg
Thanks for participating in the Steemit Crypto Academy
Feedback
Excellent work done!. Thanks for demonstrating such a clear and detailed understanding of the Bollinger bands trading tool.
Homework task
10
Greetings Professor @yohan2on, it is certainly a great motivation and satisfaction that our work is valued in such a significant way. Thank you for your contribution