Steemit Crypto Academy Season 2-Week 6 | Cryptocurrency trading with MACD indicator by @kouba01 / Performed by @madridbg
Authored by @madridbg, via Power Point 2010, using public domain images.
Welcome dear readers of the @steemitblog platform. Continuing with the academic activities promoted by Professor @kouba01 through the Steemit Crypto Academy community, in this installment we will give continuity to the approach of technical indicators, focusing our attention on the generalities, advantages and disadvantages of using the MACD indicator as a strategy in our trading plan.
INTRODUCTION
Technical analysis in the world of trading is essential because through this you can speculate on the price action in a given asset, so that the experts who make daily life in the digital markets have managed to establish strategies based on some indicators that provide reliable signals according to the strategy programmed by the trader.
In this sense, through these lines of writing we will focus on the use of the MACD indicator as a tool that allows us to predict the divergences generated in the market, the possible trends that are formed, as well as entry and exit signals and most importantly, through this powerful and widely used indicator we can predict the strength and direction of the price.
That is why the MACD has positioned itself in a place of honor for advanced traders as well as for beginners, so we will study every detail behind this tool, which will allow us to guide the reader and at the same time improve our trading strategy.
ASSIGNMENT AND APPROACHES TO BE ADDRESSED THROUGHOUT THE SUBJECT MATTER
In this section of the thematic, we will focus our attention on answering each of the approaches made by the teacher, the same we will do it through the following sequence:
POSTING 1: What is simply the MACD indicator?
Before answering this question, we will mention that the MACD was developed in the mid-1970s by Gerald Appel and whose guidelines have been maintained over time.
Now then, MACD stands for Moving Average Convergence/Divergence, from my opinion it is a momentum and trend indicator, the same allows to make conjecture based on the existing relationship between a pair of moving averages and the price of the asset, which being a lagging indicator, is one of the best in trend following, also its versatility allows us to predict divergences, the strength and direction of the market, as well as possible breaks that are established in the price.
In its harmonic constitution it is designed by three variables to consider, in the first instance the MACD, then the signal and finally the histogram, by coexisting and relating these variables we obtain an indicator with many qualities that allows us to be assertive when developing a trading strategy.
If we analyze separately each component, we can establish that the MACD as such, is the differential result of two moving averages using different lengths, where a fast and a slow average is generated, the first is used for short-term movement due to the sensitivity it presents and the second, is considered for medium-term movement, it is necessary to highlight that the differential average is taken based on two (2) moving averages of 12 and 26 periods respectively, although we can adapt the indicator according to our needs.
The next variable to take into account is the signal, the same represents the exponential moving average of the MACD determined previously, the same is used to make decisions of entries and exits of the market, being the reference value of 9 periods.
Last but not least we have the variable histogram, which represents the difference between the MACD and the signal, it allows us to have a holistic view to enter or exit the market as well as the direction and strength of an asset.
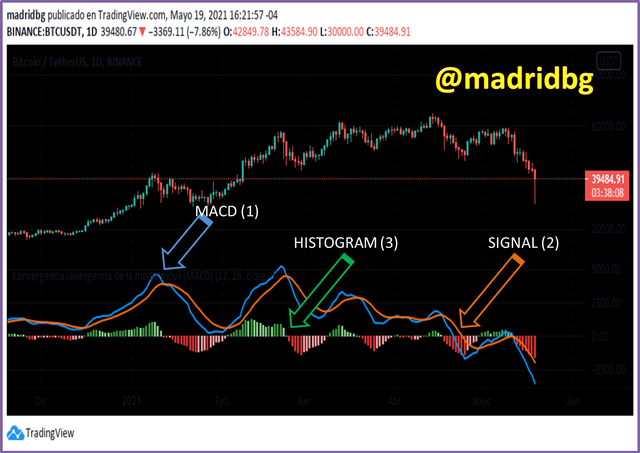
Fig. 2. Components that make up the MACD indicator. Author. Screenshot taken by @madridbg, using the platform. Author: tradingview
APPROACH 2: Is the MACD indicator good for trading cryptocurrencies?
As this approach is a dichotomous question, my answer is simply "YES", now, if we analyze in detail the MACD behavior studied above, we realize that it is an indicator that can be adapted to any market either forex, stocks, futures, cryptocurrencies, among others.
This due to the multiple advantages that the indicator provides us, now as for the crypto market I consider it should be used in the company of other indicators, which confirm each of the scenarios that the MACD provides us, this assertion I make based on the market volatility, where in many cases the technical analysis that we perform through the indicators, are affected by fundamental analysis (news), such is the case of recent statements made by the CEO of TESLA Elon Musk that has put in check the bulls within the bitcoin when technical analysis showed us otherwise, hence the importance of complementing our trading strategy.
CLAIMING 3: Which is better, MACD or RSI?
The answer to this question can be somewhat ambiguous and depends on the trading strategy that each person has, personally I consider more effective the MACD indicator for intraday trading, however, I usually use the RSI to trade in lower timeframes, hence the usefulness of both indicators.
Another criterion that we can use to assume who is better is the sustainability over time, where the MACD greatly exceeds the RSI, also the popularity of the MACD is greater than the RSI, so we can establish in general lines that the MACD is better than the RSI. Hence the need to manage an appropriate strategy that meets our needs and the mechanism and the way of trading that we have individually.
Now when comparing both indicators we realize that the MACD interrelates more components than the RSI, so that the patterns have to be confirmed and validated by a greater number of variable, which allows us to obtain greater security when trading, I consider this point as the key to establish that the MACD is better than the RSI.
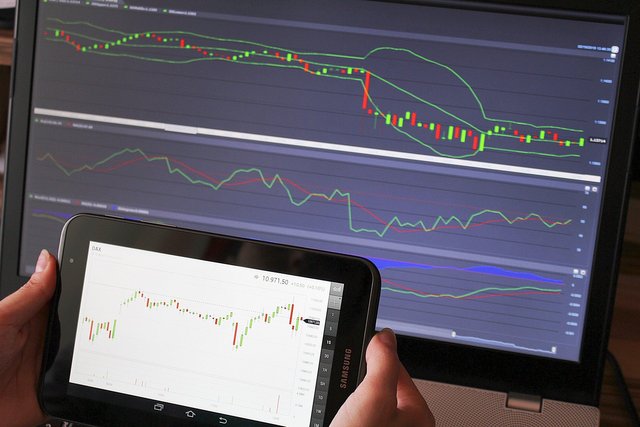
Fig. 3. The combination of indicators is fundamental to establish a winning strategy in the world of trading. Author. Author: Csaba Nagy
APPROACH 4: How to add the MACD indicator to the chart, what are its configurations and ways to benefit from them?
To respond to this approach we will follow the following sequence, which will be accompanied by images to orient the reader on the object being studied, for this we will rely on the tradingview platform in its free or paid version, so let's start:
Step 1: The first thing we must do is to locate the pair we want to analyze or trader in this case I will use the pair BTC/USDT in daily temporality.
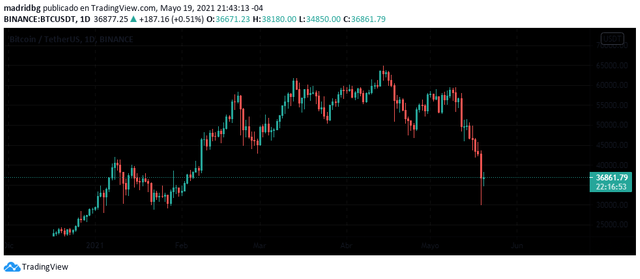
Fig. 4. Screenshot taken by @madridbg, using the platform. tradingview
Step 2: to add the MACD to the chart we must go to the section (Fx) and then write the acronym MACD, as we can see in the image 5 and 6.
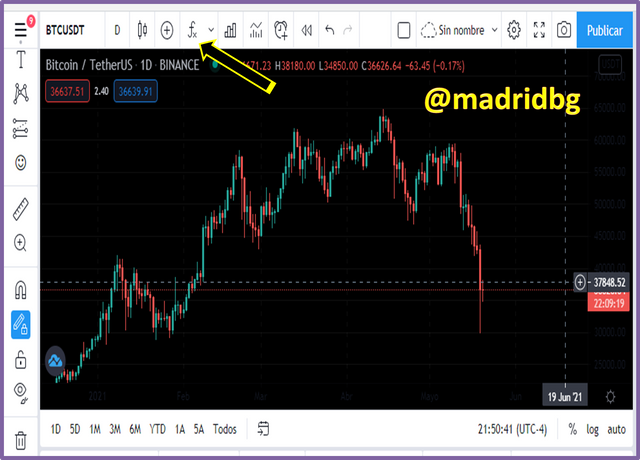
Fig. 5. Screenshot taken by @madridbg, using the platform. tradingview
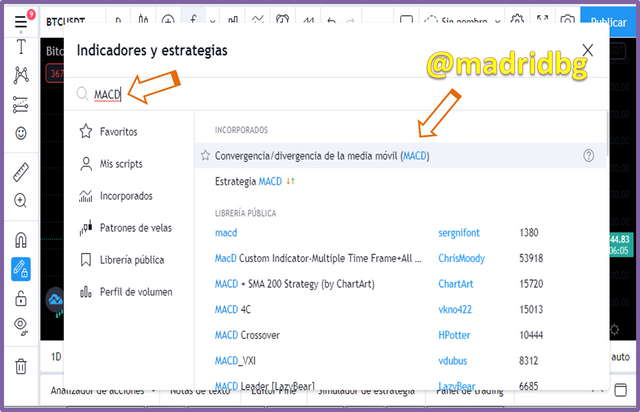
Fig. 6. Screenshot taken by @madridbg, using the platform. tradingview
Step 3: Once the MACD has been entered to the chart, we will go to the configuration section and make the pertinent adjustments for the MACD, the signal and the histogram, where we can modify the default parameters that are usually based on lengths of 12 and 26 and nine periods for the signal, we can also modify the design of each of the components, as we can see in the following images.
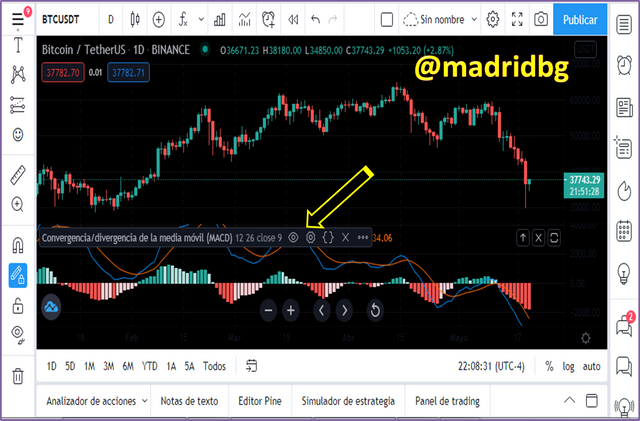
Fig. 7. Screenshot taken by @madridbg, using the platform. tradingview
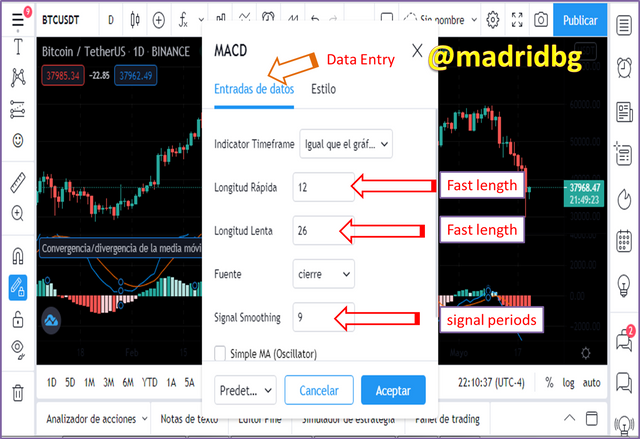
Fig. 8. Screenshot taken by @madridbg, using the platform. tradingview
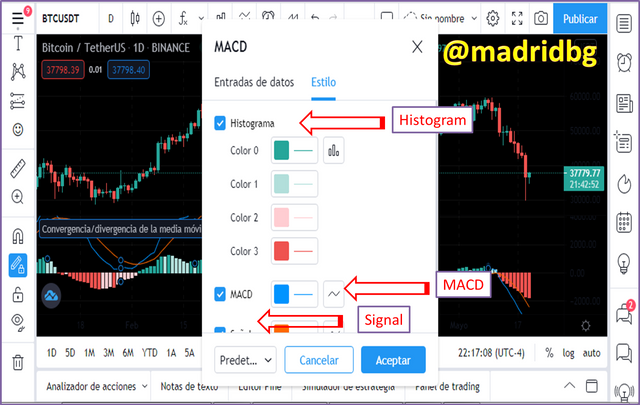
Fig. 9. Screenshot taken by @madridbg, using the platform. tradingview
With respect to the configurations, they are adapted to the trader according to the temporality in which he works in the market, personally and in my short experience trading I use the default settings, they allow us to know the direction and strength of the market, we can monitor the presence or absence of divergence between the price action and the MACD histogram, also serves as support to establish support and resistance according to chartist analysis and most importantly we can enter the market using patterns known according to proven strategies for certain periods of time, so this indicator is essential for any trader, it is a tool that adapts very easily to our requirements.
APPROACH 5: How to use MACD to cross the MACD line and the signal line? And how to use MACD with the zero crossing? How to detect a trend using MACD? And how to filter out false signals?
The best way to explain in detail these approaches is by relying on the chart, therefore we will use the one provided by Tradingview.
5.1. How to use MACD to cross the MACD line and the signal line?
To answer this question we will use the daily timeframe chart of the BTC/USDT pair and make an analysis based on the MACD line and the signal to establish the price behavior based on these patterns.
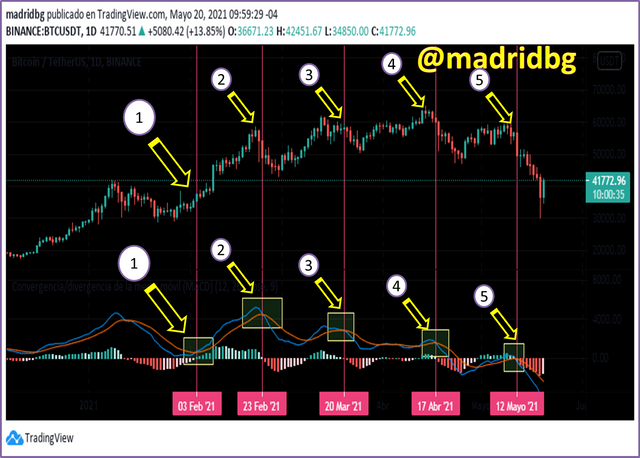
Fig. 10. Chart to detect crossovers between the MACD line and the signal. Screenshot taken by @madridbg, using the platform. tradingview
As we can see in the chart we have managed to identify several crossings of the MACD and the signal, the same we have assigned a numerical value to explain in detail what happened with the price. So that the crossing N° 1, we can observe how the MACD line crosses from bottom to top to the signal line, which allows us to infer that the price will make a bullish run, behavior that is reflected in the price.
On the other hand the crosses generated at N° 2, 3,4,5 the same pattern is observed, i.e. the MACD crossing over the signal line is from up to down, at this point we speculate that the price would have to make a bearish run and consequently the price complied with the established pattern and the price of BTC at these points went down
5.2. How to use the MACD with the zero crossing
To understand the pattern that is generated with the interaction of these two variables, we will continue working with the STEEM/USDT pair in daily timeframe and analyze the two scenarios that have been listed, where we can observe the MACD crossing the zero line and based on this obtain winning trades.
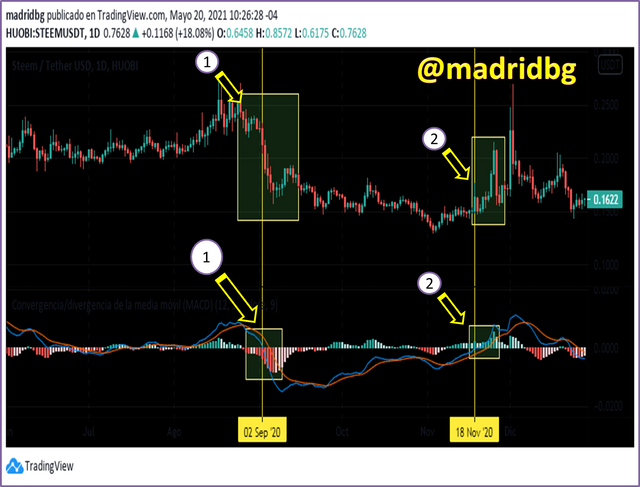
Fig. 11. Chart to detect crossovers between the MACD line and the zero level. Screenshot taken by @madridbg, using the platform. tradingview
If we analyze the chart 11, we can observe two scenarios that have been listed, in the first one the MACD line crosses the zero point from top to bottom, this pattern is confirming us that the price will make a bearish correction, which was fully fulfilled as we can observe in the charts for the days following September 2, 2020.
Scenario number two is the opposite, the MACD line crosses the zero point from the bottom to the top, a pattern that does not indicate that we will be in the presence of a bullish move, the same was fulfilled in the days following November 18, 2020.
So if we make a study of the BTC chart, we realize that these patterns repeat over time and that we can use it as a strategy to enter the market, assuming confirmations with the use of the signal line.
5.3. How to detect a trend using the MACD? And how to filter out false signals?
This indicator due to its versatility allows us to detect possible trends and micro-trends in the market, in addition we can consider the entries as true and in any case filter the false ones.
In this sense, let's review the chart 12 and make an analysis of the signals that we have been able to mark.
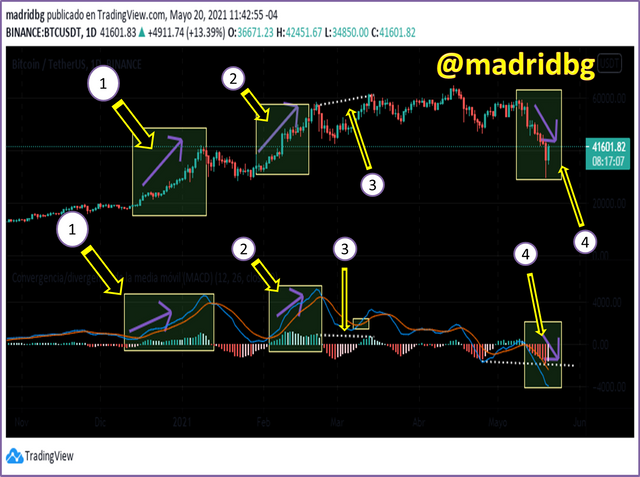
Fig. 12. Chart to detect confirmed trends and patterns using MACD. Screenshot taken by @madridbg, using the platform. tradingview
As we can see patterns N° 1 and 2 are very clear trend that we can follow using the MACD components, in the case of the histogram and the MACD line do not manifest a clear uptrend, which corresponds to the price action.
On the other hand, the same components manifest us a clear downtrend in the pattern N° 4, in both scenarios we can observe that these patterns have been confirmed by the crossing of the MACD lines and the signal, in the first one the crossing is from bottom to top (bullish movements) and in the second one the crossing is from top to bottom (bearish movement).
Another aspect that we must take into account and that allows us to filter false signals is attributed to the formation of divergence, either bullish or bearish, in the case of pattern No. 3, we can analyze a clear bearish divergence, where the price of the asset, the crossing of the MACD line and the signal tell us that the price is going up, however, the scenario is another and the price ends up falling, a process that can be explained by the divergence pattern formed.
That is why the MACD as a strategy we must use it as a whole, since each pattern provides us with important market information and by correlating all the components allows us to establish safer entries and exits.
POSTING 6: How can the MACD indicator be used to extract support and resistance points or levels on the chart?
The approach of supports and resistances is one of the most used techniques in trading by advanced users and by those who just started in the analysis of the market, in the case of the MACD and for practical issues and from a personal perspective, I rely on the histogram and according to determine the support and resistance lines that are opposed to the price action, as we can see in the graph 13.
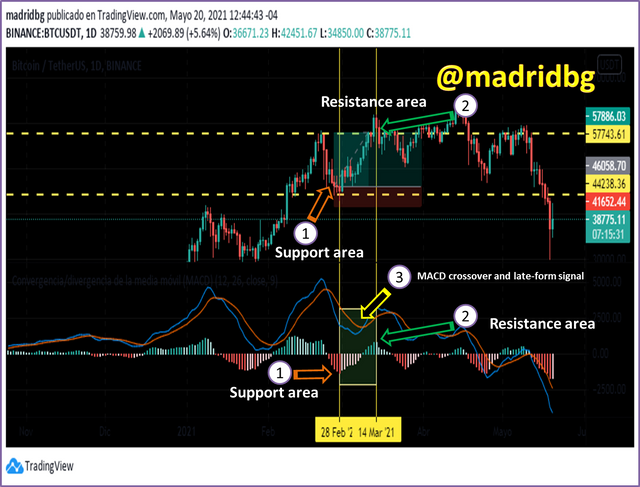
Fig. 13. Supports and resistances using MACD. Screenshot taken by @madridbg, using the platform. tradingview
If we do the analysis we realize that the culmination of the red valley in pattern No. 1, gives us important information when marking a support area in the price and the highest peak of the top pattern No. 2 in green, would be the area of resistance. Now as we cannot know how much the price is going to go up or how much it can go down, it is necessary to use the highest or lowest peaks according to our entry price, directly on the chart, which we can see reflected with the yellow lines marked horizontally on the chart.
In this same chart we can see through the pattern N° 3 that the bullish crossover generated by the MACD line and the signal, has been formed somewhat late, in the same way we must go polishing the strategy and use those patterns that work best for us to enter and exit the market.
PLAYMENT 7: Review the chart of any pair and present the various MACD signals.
Through this section of the subject we will try to integrate all the relevant aspects studied through the MACD as a strategy, which will allow the reader to have a broader view of each of the components that this indicator provides us with.
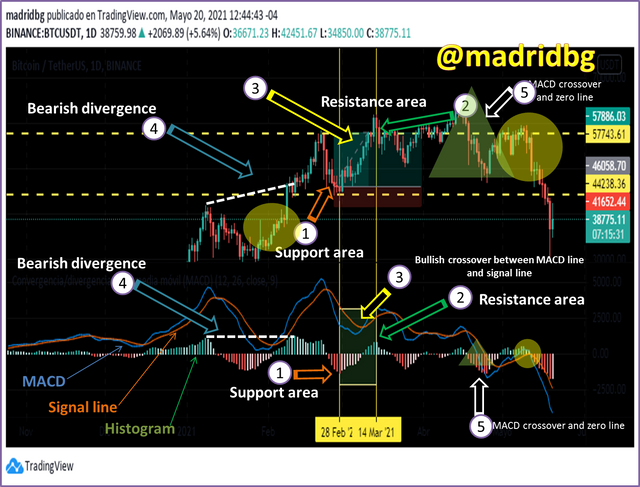
Fig. 14. Patterns extracted using the MACD indicator. Screenshot taken by @madridbg, using the platform. tradingview
If we analyze the graph, we realize that different patterns have been listed among which stand out:
Pattern N° 1: We can observe the support areas extracted through the histogram provided by the MACD.
Pattern N° 2: It allows us to identify the areas of resistance in the market.
Pattern N° 3: Allows us to establish the bullish crossover between the MACD line and the signal, the same corresponds to the price action. In other words the MACD crosses the signal line from bottom to top.
Pattern N° 4: we observe the divergence generated between the price and the MACD, in this case it is a bearish divergence that is supported by the price action, and it is one of the variables used to discard or filter false signals.
Pattern N° 5: shows us the crossing of the MACD line and the zero line, in this case in a clear example of a bearish movement in the market as the MACD crosses the line from top to bottom.
CONCLUSION
Undoubtedly the MACD indicator, applied as a trading strategy is an excellent tool that allows us to obtain important market information, hence the importance of this course, which has allowed us to learn about the indicator and generate a broader view on the fundamentals of this technical indicator, which accompanied by other indicators that allow us to confirm the patterns already established, which would be a good strategy to capitalize on positive in the market.
BIBLIOGRAPHY CONSULTED
[1] García Pinto, P. (2017). Investment strategies based on technical analysis indicators and oscillators. Faculty Of Business Administration And Management. Polytechnic University of Valencia. Article: Online Access
[2] Campos Vicente María Pilar. (2019). RSI vs MACD, which is the winning oscillator in the IBEX 35. Faculty of Economics and Business / Finance and Accounting. University of Zaragoza. Article: Online Access
OF INTEREST
•

Hi @madridbg
Thanks for your participation in the Steemit Crypto Academy
Feedback
Very good work. Thanks for the clear and well-detailed explanation of the MACD trading indicator.
Homework task
9
Thank you Professor @yohan2on for your time and the evaluation of my work, it motivates us to continue working and publishing quality content.