STEEMIT CRYPTO ACADEMY | SEASON 2: WEEK 7 - THE SWING TRADING STYLE// BY @madridbg

Authored by @madridbg, via Power Point 2010, using public domain images.
Welcome dear readers of the #Steemitblog platform. This publication serves as a requirement that responds to the activity assigned by Professor @yohan2on, which is aimed at the implementation of viable trading strategies that respond to Swing trading.

The market associated with cryptocurrencies and trading in general is determined by price action, so users have found it necessary to educate themselves and apply strategies based on efficient technical indicators.
Among the strategies stand out, scalping, swing, among others. In this sense, swing the as a trading strategy commonly used in beginner traders, the same is based on determining the movements generated by the price in relatively short periods of time, ranging from days to weeks, although this type of strategy offers greater profitability in times of trend is appropriate to know that we can apply it at any time and get good dividends from the market.

A strategy based on swing trading must contain parameters that respond to technical indicators, including identifying an entry and exit point, applying a stop loss, as well as marking possible take profits.
ABOUT MY TRADING PLAN
The phrase “We cannot enter the market without having a previously established strategy” is the harsh reality. In such a way, we will seek to establish and explain in a detailed and didactic way my approach to the cryptographic market, the same we will do through the following sequence:
Step 1: Understanding my strategy
The technical analysis that I usually perform is based on three types of indicators, the same accompany them by supports, resistances and volume profile, the latter allow me to determine the setbacks and rises that can be generated in the market, as well as the interest of buyers and sellers on the asset.
In terms of indicators, I usually use the Squeeze momentum lazy bear and the ADX, the first is a modified MACD that allows to evaluate the directionality of the price, as well as the divergences generated in it, on the other hand the (ADX), allows to establish the strength that has the price, on the other hand I use 2 Moving Averages (EMA), established with period 10 and 55 respectively, where I can establish confirmations of entries and exits according to the generated crosses.
Step N° 2: On temporalities
Knowledge of timeframes is a must for any trader, so let's take a look at the following charts.
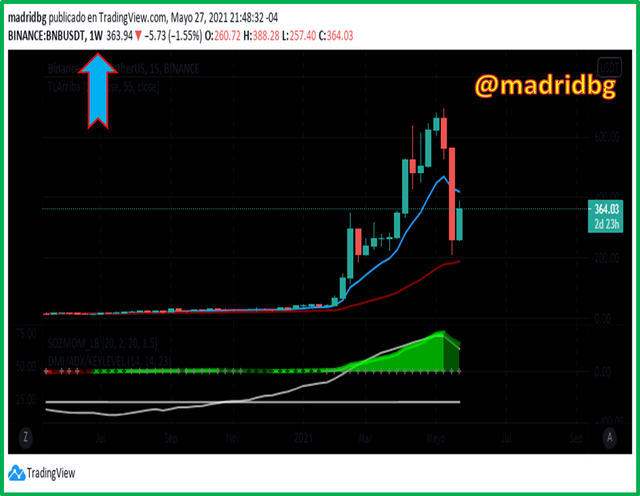
In chart 3, the time frame studied is weekly, here we must be aware that our analysis has a projection of months since each candle from its opening to its closing takes a week.
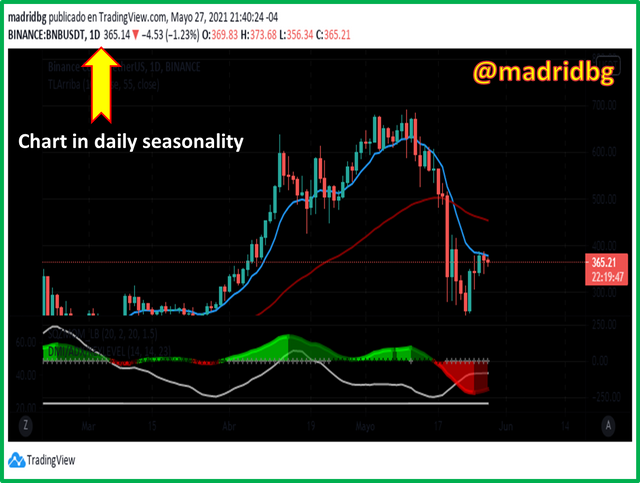
For chart 4, the timeframe reflected is daily, which means that each candlestick takes one day to close and the analysis has a duration of weeks.
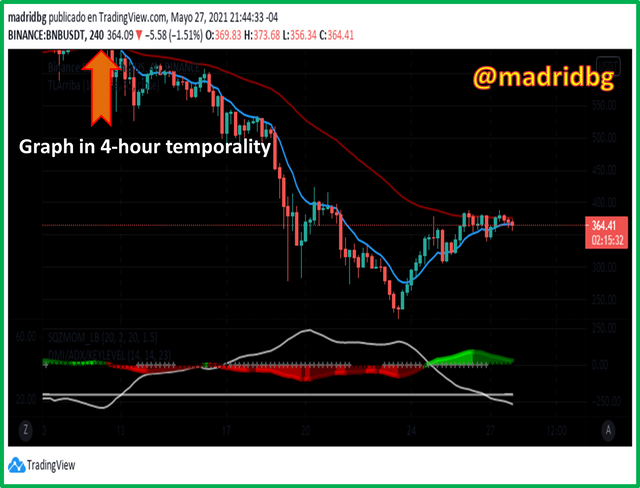
The 4-hour timeframe involves analysis for the following day, and each candlestick has a duration of 4 hours from open to close. Therefore, my entry and exit of the market is based on the sequential analysis that I usually perform by the weekly, daily and 4 hours charts, which allow me to perform a proper trading management.

From here, we will perform a detailed analysis according to the learning obtained, for this we will perform a review in each of the previously studied graphs (weekly, daily, 4 hours).
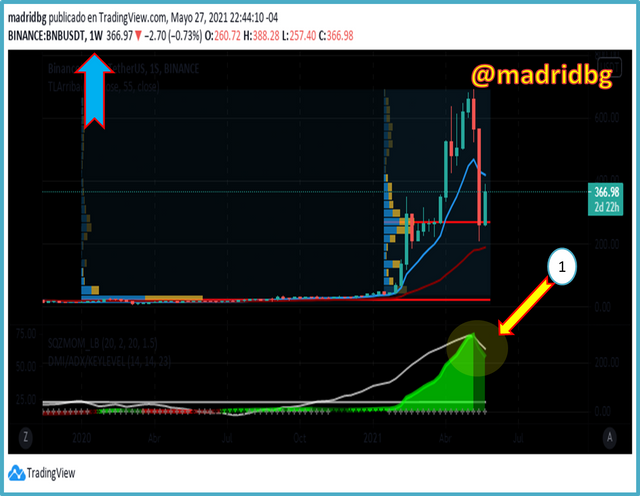
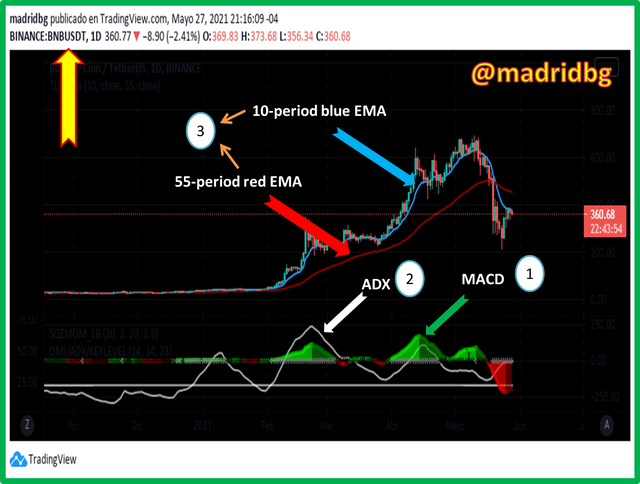
As we can see in the chart 6, the analysis is based on the weekly time frame, through this chart we can extract valuable information, which according to our indicators show that the price has entered a negative slope and bearish directionality, which shows weakness to continue rising (pattern No. 1).
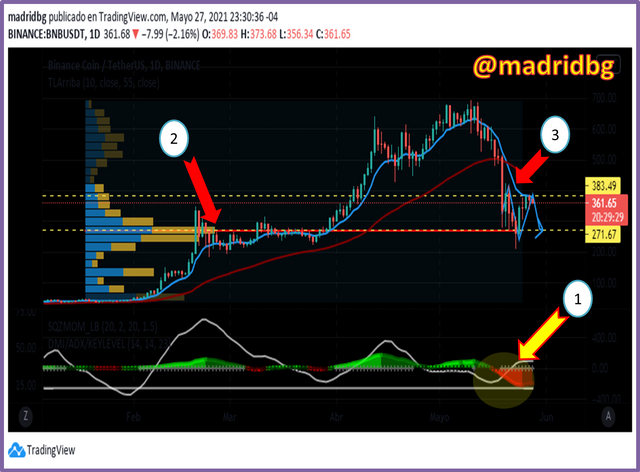
Having established the direction on the weekly chart, it is time to analyze the daily chart (image 7), where we can establish the following:
Pattern N° 1: we observe a slight bullish directionality with flat slope, this pattern shows us indecision, that is to say that most likely a consolidation range in the precise BNB/USDT will occur.
Pattern N° 2: We can observe that it is respecting an important trading zone, which becomes our support and the resistance is confirmed at the level of the 10-period EMA identified with the blue color (Pattern N° 3).
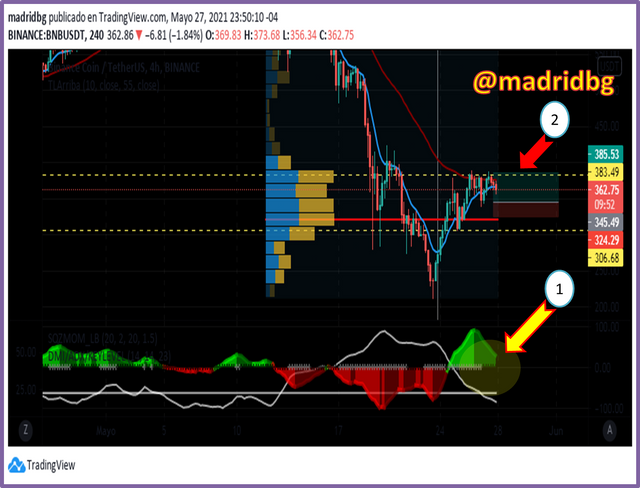
In the chart 8, we use it to confirm the entry and thus establish our target and stop loss levels, since with the negative slopes and bearish directionality (pattern N° 1) and the approach of the moving averages, we confirm the formation of the range, which we will try to trade in the impulses generated after the pullbacks.

In order not to make this writing more extensive we will continue to rely on the chart 8, where we can see in the pattern No. 2 that I intend to place my entry once the price retreats and I estimate it to be around 345.28 USDT, establishing a stop loss of approximately 5%, (326.68 USDT) to the support generated by the volume profile. Regarding the take profit I will establish a target of 11.5% which I will divide in two take profit of 50% where I will follow my profits according to the price action.

It is necessary to make clear that the analyses that we can make are not the absolute truth, on the contrary, they are speculations that we make according to the price action, in this sense, it is the responsibility of each trader to assume the risk according to his capacities and resources. For this reason, making an ideal distribution of our investment portfolio will allow us to diversify our profits and at the same time our losses.
OF INTEREST
•

Hi @madridbg
Thanks for participating in the Steemit Crypto Academy
Feedback
This is good content. Thanks for demonstrating your understanding of Swing trading using the knowledge of technical analysis.
Homework task
8
Thank you Professor @yohan2on for your review of my article.