CRYPTO ACADEMY SEASON 4 [ADVANCED COURSE] WEEK 4: CRYPTO TRADING WITH WILLIAMS INDICATOR% R
Authored by @madridbg, via Power Point 2010, using public domain images. Geralt
Greetings and welcome dear readers to this space where we usually share content associated with the world of cryptocurrencies, trading and technical indicators in general, continuing our training from the spaces of #SteemitCryptoAcademy, in this installment we will address the use of the WILLIAMS% R indicator, as an opening to the class of Professor @kouba01 in his week 4.
In this sense we go with the development of the activity.

CONCEPTUAL AND PRACTICAL ASPECTS OF THE WILLIAMS INDICATOR% R

In this section of the subject, we will focus our attention on answering each of the questions requested by the Professor, so that we can understand and manage each aspect behind the WILLIAMS% R indicator.
1. Explain the Williams% R indicator, introducing how it is calculated, how it works. And what is the best scenario? With justification of your choice.

Before answering what it is, it is necessary to determine that the Williams% R indicator, dates back to 1973 so that its name derives from its creator Larry Williams, who classifies it as a trading indicator that allows to extract different conceptual aspects on the price action of an asset, so that it is possible to make interpretations and speculates based on this.
Technically, the Williams% R indicator, also known as Williams Percent Range (WPR), is a momentum oscillator, whose purpose is to determine the speed of movement of the price of an asset, thus detecting accumulation zones that indicate possible changes in trends, In other words, this indicator allows us to determine the strength of an asset based on whether it is overbought or oversold, hence it is based on a range or scale of data similar to the RSI, where we can enter valuable information about the behavior of the price.
On how it works:
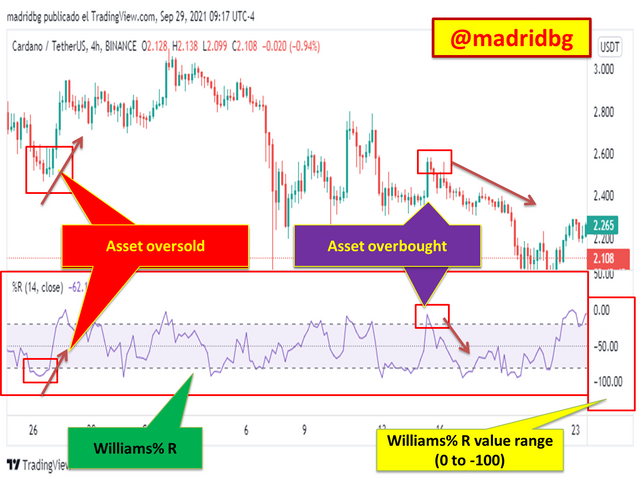
As I mentioned earlier because it is an oscillator similar to the RSI, the WPR forms a channel ranging from 0 to -100 which allows us to highlight the following aspects:
1. The overbought and oversold values are evaluated according to a smaller channel ranging from -20 to minus -80.
2. If the price moves above the upper limit of the channel, i.e. from 0 to -20, we say that the asset is overbought and that a reversal in price behavior and direction is possible.
3. If the price moves below the lower boundary of the -80 to -100 channel, we say that the asset is oversold and that a reversal in price behavior and direction is possible.
Screenshots taken by @madridbg, through the tradingview platform tradingview
Under these scenarios, it is possible to detect through the WPR indicator, which type of traders or investors establish the zones of dominance or control over the asset in a given period of time, therefore, if we refer to bearish investors the WPR values are close to -100, in the case of bullish investors, the WPR values are close to 0).
So that under the postulates of Williams% R, we can highlight that the zones of maximum bearish momentum is when the price reaches the lower limit -100 and in the case of bullish the maximum momentum is reached when the price reached the upper limit 0.
On how it is calculated:
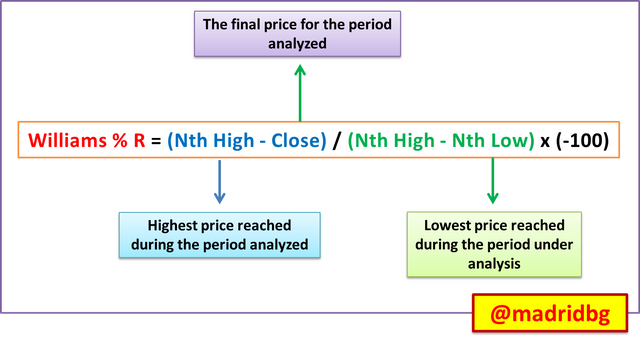
If we have followed the reading, we can highlight that we have already made mention of the functionality of the WPR, but if you want to understand the formation of the channel and its interpretation in depth, it is necessary to address the mathematical equation established Larry Williams and that we will describe below:
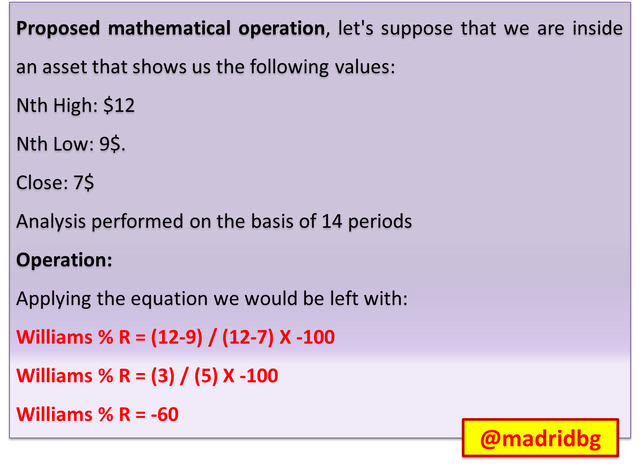
If we look at the previous image we have identified each of the aspects that make up the mathematical device used by Williams and that allows us to extract information about the behavior of an asset. As a way of orienting the reader let us quickly apply the mathematical principles behind the formula previously studied.
As we can denote, this formula is constructed to quantify how close the market is to the outer limits of a recent range, where we have to take into account that:
1. A value of (-100 %) means that the current close is the lowest low of the last 14 periods.
2. A value of (0 %) means that the current close is the highest close for the last 14 periods.
3. Intermediate values, such as (-60) show proportionally where the market is between these two previous extreme values.
On what is the best scenario:
This is one of the approaches argued of the thematic, since the recommended configuration and the best scenario of use, is closely related to the type and style of trading of each trader, personally I use the default setting, ie 14 periods and setting the upper limit at -20 and the lower limit at -80 as danger alert values, since I usually approach the market in 4 hours temporality, therefore, I can assume as an average of the last 14 candles, which is an average not so short but not so wide either, so that the indicator can follow the price action without causing so much noise, false or late signals.
However, this scenario can change according to the trader, i.e. some will use lower periods because they approach the market at lower timeframes and others use higher period because their approach is at higher timeframes.
In one scenario or another, it is advisable to adapt the indicator to our trading strategy, taking the time to test the performance of the same in relation to Williams% R and evaluate the performance and profitability of this over time, before operating with our capital.
2. How do you interpret overbought and oversold signals with the Williams% R indicator when trading cryptocurrencies?

As mentioned in the previous section, this indicator moves in a channel space that allows us to determine the market sentiment and the conditions of the asset, whether it is overbought or oversold, and based on this we can predict the price movements and consequently get some profitability out of it.
Therefore, let's analyze the following scenarios:
Scenario 1: the Williams% R indicator, in overbought signals.
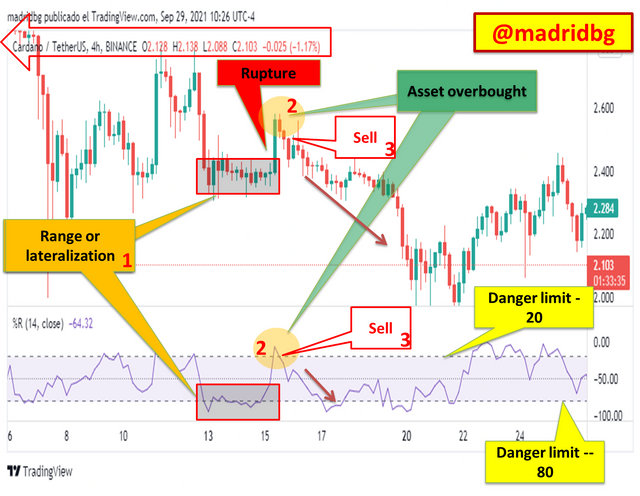
In order to explain this behavior we will rely on the tradingview platform and we will use as support the ADA/USDT pair in 4 hours timeframe, where we can observe that after a range or lateralization zone that is nothing more than indecision in the market (pattern 1), there is a bullish breakout, which quickly takes the asset above the danger limit -20 (Pattern 2), at this point we say that the asset is overbought and that a possible correction or fall is expected, which we can use as a signal to exit the market for sale.
Screenshots taken by @madridbg, through the tradingview platform tradingview
It is necessary to highlight that this type of signals is better to execute them once the price makes the correction or fall and moves in search of the danger line -20 (pattern 3) which is an indication of signal confirmation that we can corroborate by using other technical indicators and as seen in the chart above, the correction is a sharp drop that occurs according to the signal thrown by the Williams% R indicator.
Scenario 2: the Williams% R indicator, in oversold signals.
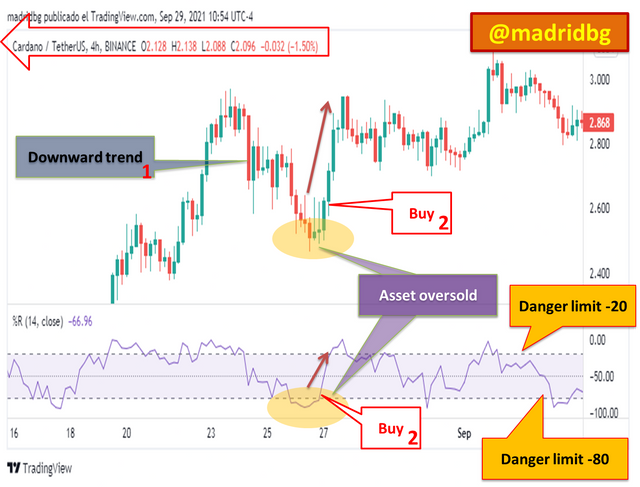
As in the previous case we will use as support the ADA/USDT pair in 4-hour time frame, where we can observe in the following chart that after a downtrend (pattern 1), the price of the asset enters oversold zones, so that it falls below the -80 danger limit, which allows us to speculate a possible bullish entry in purchase once the price makes the respective correction and returns to the -80 danger zone or line (pattern 2).
So that we can have some confidence about the price action of the asset and as visualized in the chart the correction resulted in a strong bullish momentum that would not allow to capitalize on the market, again it is necessary to highlight that confirmations based on other indicators are needed to confirm this type of signals.
Screenshots taken by @madridbg, through the tradingview platform tradingview
3. What are "failure oscillations" and how are they defined using Williams% R?

As we have mentioned throughout this writing the Williams% R indicator is characterized by two danger zones set at -20 for overbought signals and -80 for oversold signals. Now, the ideal scenario is for the price action to reach one of this line either up or down and make the respective correction that allows us to speculate on the price action.
However, these scenarios are not always fulfilled and sometimes the price fails to reach the established danger lines, which allows us to infer that the previous trend has lost strength or does not have enough momentum to continue rising or to continue falling, this type of movement is known as failure oscillations and can occur in two types of scenarios.
Scenario 1: failure oscillations in uptrend:
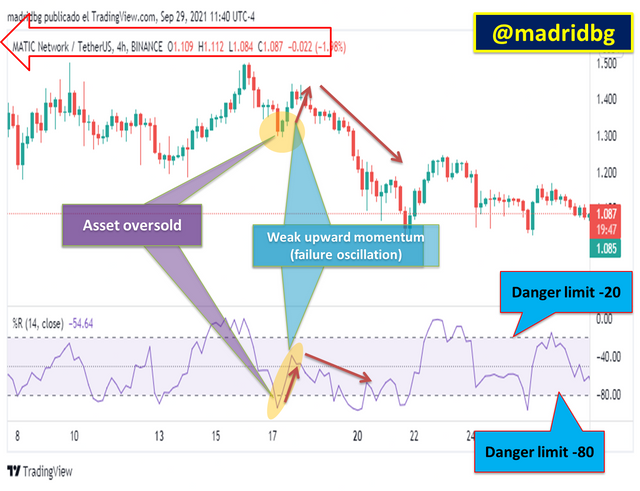
As we can see in the chart for the MATIC/USDT pair in 4 hours timeframe, after the oversold zone, there is a bullish correction that allows us to speculate that the price will go up, however, after a few bullish candles the price returns and continues with its downward trend, at this point we are facing a bullish failure oscillation, as the price showed weakness to the upside, and the momentum was not big enough to continue rising, which shows that the selling pressure was greater and therefore the price continued to fall.
Screenshots taken by @madridbg, through the tradingview platform tradingview
Scenario 2: failure oscillations in downtrend:
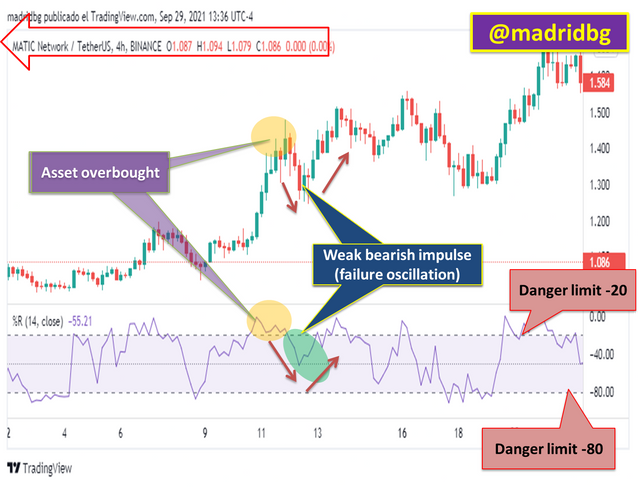
If we analyze the chart below we can see that once the danger level -20 overbought zone, the price prepares to fall and allows us to speculate the asset downwards, however, the downward momentum presented weakness and therefore the asset does not have enough strength to reach the danger level -80, on the contrary ends up retreating and turning upwards again, a scenario known as bearish failure oscillation, so we can establish that there was more buying pressure that allowed the price to continue rising.
Screenshots taken by @madridbg, through the tradingview platform tradingview
4. How to use bearish and bullish divergence with the Williams% R indicator? What are your main conclusions?

As has been studied in previous publications, divergences are scenarios where the price action and the indicator do not follow the same behavior and where we can establish that the indicator is ahead of the price action, so it is extremely relevant when speculating in the market, the divergence as it is well known can be of two types either bullish or bearish, we will describe them below:
Upward divergences as a function of the Williams% R indicator:
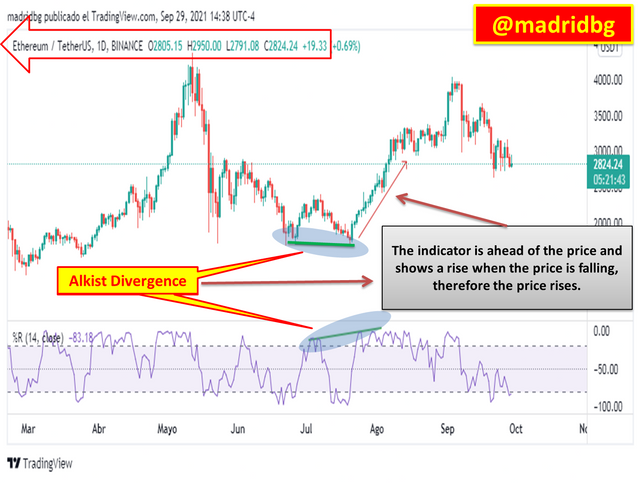
For this pattern to form, it is necessary that the indicator shows us a bullish run, while the price action is going down, in this scenario, the indicator has been ahead of the price action and the probability of upside is much higher than the downside, hence the importance of studying this behavior as they can be assumed as entries in buying positions.
Usually this type of pattern, are a consequence of the weakness shown by sellers and consequently the greatest pressure is exerted by those who buy and bet for the price to rise, these criteria can be seen observed in the following chart for the ETH/USDT pair in daily temporality.
Screenshots taken by @madridbg, through the tradingview platform tradingview
Bearish divergences as a function of the Williams% R indicator:
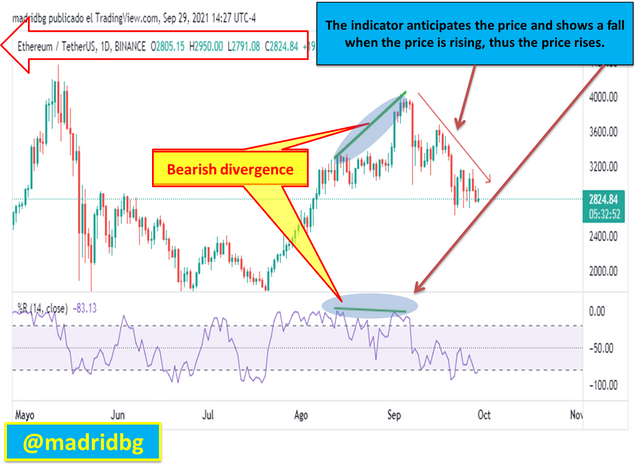
In this case, the scenario is opposite to the previous one since the indicator shows us a fall in price, while the price action delimits us a known, as we mentioned the indicator has moved ahead of the price so we can use the pattern as a sell signal, where it is the sellers who have taken over the price pressure and consequently the price will end up falling.
In the chart below, for the ETH/USDT pair on daily timeframe, we can see how the price action contradicts that the indicator and consequently the price ends up falling according to the postulates of bearish divergences.
Screenshots taken by @madridbg, through the tradingview platform tradingview
5. How do you detect a trend using Williams% R? How do you filter out false signals?

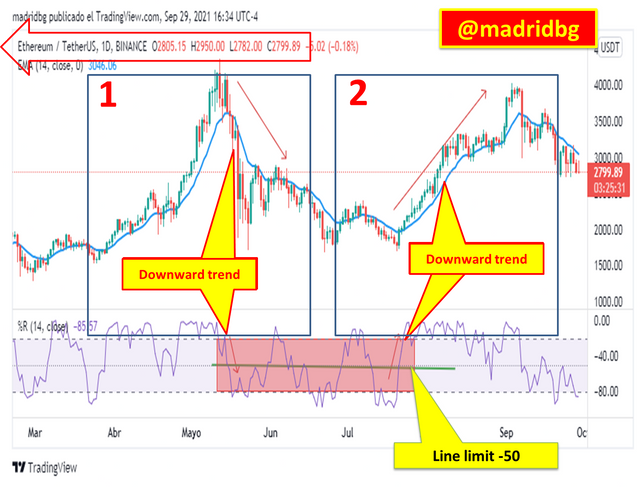
In a certain way the Williams% R indicator generates a visual aspect that allows us to detect the presence or not of a trend either bullish or bearish, however, due to the importance of generating a profitable strategy we must assume that any asset that moves in an upward direction and above the -50 limit is in an uptrend. Otherwise, if the asset presents a fall below the -50 we say that it is in a downtrend.
In one scenario or the other, the most advisable is to seek confirmations based on other indicators, personally I let myself be guided by trend indicators among which are the exponential moving averages, which allow me to follow the direction of the price and at the same time establish areas of support and resistance, the MACD, is a strong support to the strategy as it allows us to confirm the direction of the asset and consequently the Williams% R allows us to analyze the overbought and oversold areas of the asset in a specific period of time.
Screenshots taken by @madridbg, through the tradingview platform tradingview
If we look at the above chart ETH/USDT pair in daily timeframe, we can notice that we have added only a 14-period EMA and the Williams% R indicator, so that we can more accurately track the trend of the asset. Consequently, we have delimited two scenarios, in the first one we managed to establish that after the overbought zone the expected correction below the -50 level occurs as an indication of bearish trend that we managed to confirm by the direction of the 14-period EMA.
In the case of scenario number 2, after the oversold zone, the upward correction occurred with enough momentum to exceed the -50 level (uptrend), which we managed to confirm again according to the direction of the established EMA.
How are false signals filtered out?:
Indirectly throughout this writing we have made mention of this section, so that the process of filtering signals, go in correspondence with the indicators that accompany our trading strategy.
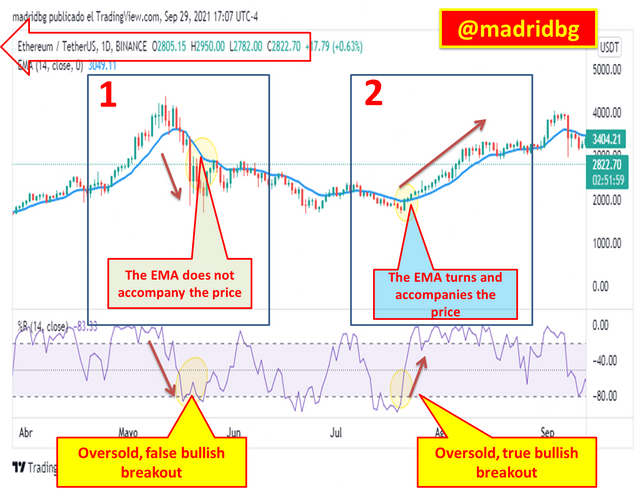
In this particular, we will continue to rely on the Williams% R and the 14-period EMA and as can be seen in the charts of the ETH/USDT pair on daily timeframe, subsequent to the overbought zone (scenario 1), the price falls with enough momentum to break the -80 danger limit, however, it only touches it and corrects upwards and as we observe this fall was not accompanied by the 14-period EMA, which is an indication of a false bearish signal.
Another aspect that we can highlight in this scenario is that once the bullish breakout was obtained, it was expected that the price would have enough momentum to continue rising, however, it ended up turning to continue in a downtrend which would cause many investors to end up trapped in the movement.
Screenshots taken by @madridbg, through the tradingview platform tradingview
In reference to scenario two, we can see that the price action is fully followed by both the Williams% R indicator and the 14 EMA, where the former shows a bullish reversal which is followed by the previously established EMA, which is an indication that the signal is true and therefore we speculate on buying.
6. Use the chart of any pair (e.g. STEEM / USDT) to present the various signals of the Williams% R indicator.

Undoubtedly, the Williams% R indicator allows us to have valuable information about the behavior of an asset so that we can speculate on the price action and establish winning trades that allow us to be profitable over time.
In this sense, it is necessary to remember that by means of this indicator we can detect the following signals that we will illustrate graphically:
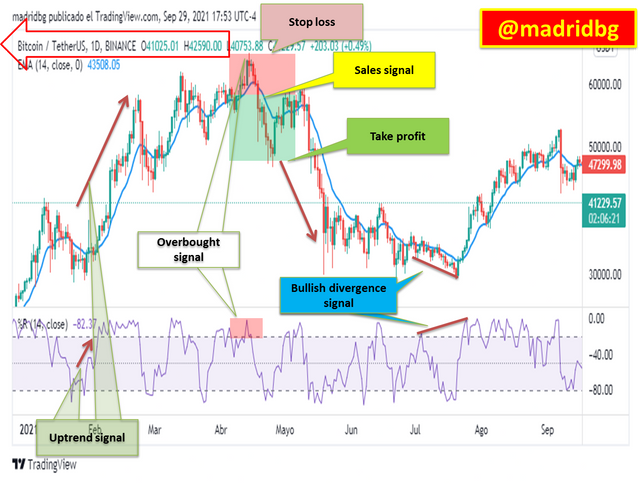
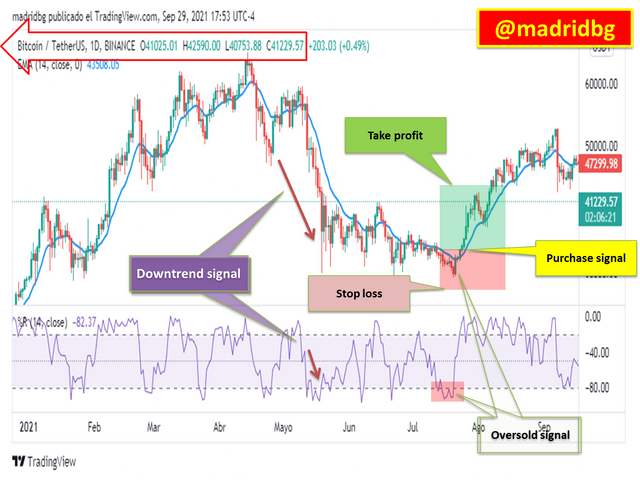
1. Signals of identification of uptrend and downtrend, for this we let ourselves be guided by the price action, since the price must move above the -50 limit (uptrend) or below the -50 limit (downtrend) and we look for confirmations by means of other indicators for example the 14-period EMA.
2. Overbought and oversold signals of an asset, in this case we rely on the danger limits set at -20, for overbought zones and -80 for oversold zones. This type of signal is decisive to buy or sell an asset and our orders must be placed once the price has made the respective upward or downward correction, in other words, that the price returns to one of the limits it has exceeded.
3. Divergence signals, as we have already mentioned they can be bullish or bearish, therefore, in one scenario or the other, they are contradictions that occur between the price and the indicator and are often used to enter or exit the market.
By way of practice in the following charts for the BTC/USDT pair in daily timeframe we have identified each of the signals studied in this section and that we have discussed throughout this writing, which will allow the reader to have a broader view of the Williams% R indicator, and the technical fundamentals behind it.
Screenshots taken by @madridbg, through the tradingview platform tradingview
Screenshots taken by @madridbg, through the tradingview platform tradingview

FINAL CONSIDERATIONS

Undoubtedly the Williams% R indicator, allows us to obtain valuable information about the behavior of an asset, highlighting the overbought and oversold areas, as well as the impulses that are generated in the price action and the divergence that it generates.
In this sense, the WPR can be used in combination with other indicators, in order to speculate on the market in a way that can generate a strategy based on the confirmation of signals truths that make us more effective in the operations we perform.
Consequently, this system of speculation with proper practice and with the respective observations does not allow us to continue advancing in our training in the face of the world of cryptocurrencies and trading in general, so that I extend my thanks and congratulations to the team of #SteemitCryptoAcademy and Professor @kouba01 for the wonderful delivery and the valuable information shared.

OF INTEREST


#cryptoacademy #kouba-s4week4 #venezuela #steemexclusive #steemit #technicalanalysis #steemitcryptoacademy

Hello @madridbg,
Thank you for participating in the 4th Week Crypto Course in its 4th season and for your efforts to complete the suggested tasks, you deserve a Total|10/10 rating, according to the following scale:
My review :
Work with excellent content, because you have taken every question seriously, allowing you to get answers that are precise and in-depth in its analysis and clear in its methodology.
Thanks again for your effort, and we look forward to reading your next work.
Sincerely,@kouba01
Thank you Professor @kouba01, I certainly value every observation and teaching shared by you, as it has allowed me to improve in my trading style and system.
Be well and success in your labors.