CRYPTO ACADEMY SEASON 03 -WEEK 08 | ADVANCED COURSE: SHARK FIN PATTERN TRADING

Authored by @madridbg, via Power Point 2010, using public domain images. Sergei Tokmakov
Greetings dear readers and lovers of the world of cryptocurrencies and blockchain in general. This publication will give continuity to my conceptual and practical training on trading in general, through the weekly courses shared by Professor @cryptokraze, from the #SteemitCryptoAcademy community space.
In this opportunity we will address what concerns the trading approach using the shark fin pattern that allows us to make more efficient entries when trading the market. In this sense, and without further ado, we start with the activity.
CONCEPTUAL AND PRACTICAL APPROACH TO SHARK FIN PATTERNS

In this section of the subject we will respond to each of the approaches suggested by the Professor, so as to allow the understanding of the subject that concerns us in this delivery and that we will break down below:
1. What is your understanding of shark fin patterns? Give examples.
According to the observations made and the explanation provided I can infer that shark fin patterns are rapid reversals in the price action of a specific asset, which we can observe at the chart level in the form of (V) for bearish to bullish reversals and inverted (V) for bullish to bearish reversals.
Although it is considered an optical pattern, since we can identify it through our sense of sight, it is advisable to detect confirmations with other indicators such as the RSI so that we can trade with much more peace of mind without making hasty or erroneous decisions.
If we do a little deeper analysis on the reversal scenarios, we can observe that in these points are concentrated a large number of operations that make it possible for the price to rise or fall in an accelerated manner, in other words when the shark fin pattern in (V) is generated, bullish investors are those that generate greater pressure on the market, on the other hand when the shark fin pattern occurs in the form of (V) inverted, are bearish investors that generate greater pressure on the market, so that the understanding of these scenarios allows us to establish important points of purchase and sale that we will delimit throughout this writing.
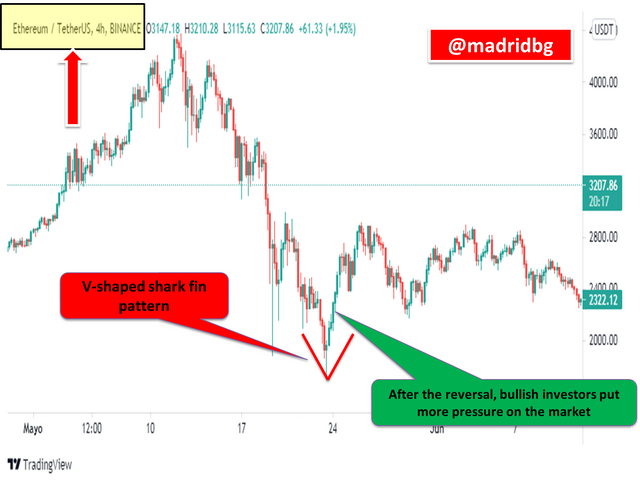
In the above chart we can evaluate the V-shaped reversal made by the price for the ETH/USDT pair in 4-hour timeframe which allows us to observe the shark fin pattern, where bullish investors once the reversal is achieved are the ones who control the market and exert more pressure on it.
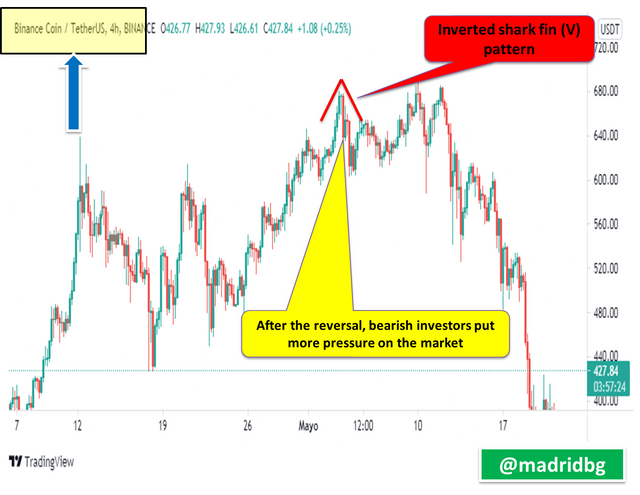
On the other hand, in the following chart, BNB/USDT pair in 4-hour time frame, we can observe the shark fin pattern in the form of an inverted (V), which leads us to infer that once the reversal is achieved, the market strength is controlled by bearish investors. In this sense, the important thing is to be clear that for both scenarios the shark fin movements are rapid alterations that occur in the price.
2. Implementing the RSI indicator to detect shark fin patterns..
As we mentioned in the previous section, we can use our sense of sight to detect shark fin patterns, however, if we want to be more effective and profitable we can rely on the use of indicators such as RSI to validate the formation of this type of patterns.
Based on the above, let's analyze the charts used above and evaluate the shark fin patterns identified according to the RSI indicator, it is necessary to highlight that the RSI indicator has been configured using the upper band at 70 and the lower band at 30, so we will evaluate those peaks in the price that come out of these ranges.
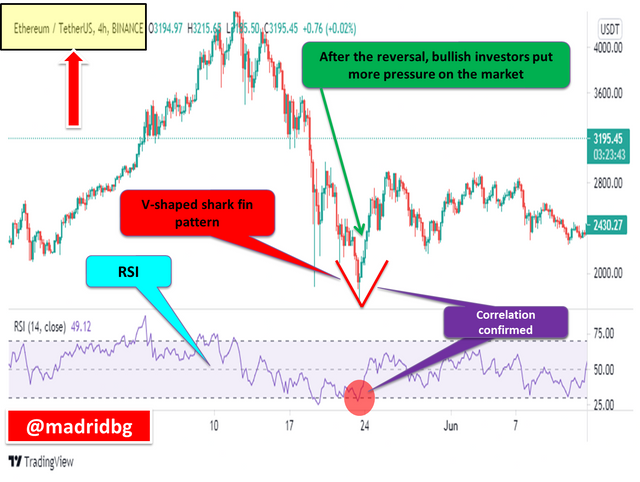
The previous chart, allows us to observe the V-shaped shark fin pattern identified visually in the previous section for the ETH/USDT pair in 4 hours temporality, now well once configured the RSI indicator we can observe that this confirms us the generated pattern, where we can observe the V that is formed below the lower band of 30 and quickly returns to the channel that generates the RSI.
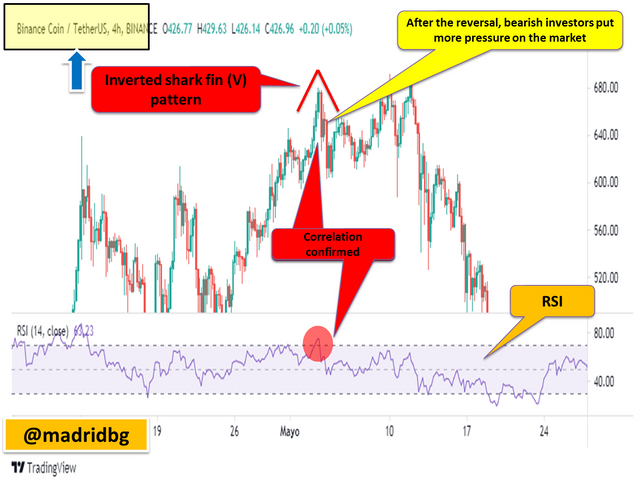
On the other hand for the following chart, BNB/USDT pair in 4-hour time frame, we can observe the inverted V-shaped shark fin pattern which is very clearly confirmed by the RSI, as the inverted V exits above the 70 band and quickly returns to the channel generated by the RSI.
Therefore, it is advisable to operate this type of patterns using the RSI indicator as supports that allow us to confirm the formation signal of the same.
3. Write the trade entry and exit criteria for trading the shark fin pattern.
In this section of the subject we will deal with the technical aspects that we must take into account when making buy and sell entries using the shark fin pattern, so we will describe in detail each of the aspects to consider.
Scenario 1, criteria for entries and exits in buy positions, to fully address this scenario, we will rely on the chart of the STEEM/USDT pair in 4-hour time frame, where we must prepare our buy entry based on:
1. Add the RSI indicator using the default patterns (pattern 1), the same will allow us to confirm the V-shaped shark fin formations in correspondence with the price.
2. Watch for rapid price movements and once it starts to pull back quickly and the V-shaped shark fin pattern forms, evaluate entry positions.
3. Confirm the generated pattern by using the RSI (Pattern 2), for this it is evident that the V-shaped pattern exits below the RSI band 30 and quickly returns to the channel generated by the indicator.
4. Place the buy order just when the price has passed the RSI band 30, although it is advisable to wait for the retracement and for it to enter the channel generated by the indicator. (Pattern 3)
Based on the above aspects, let's practice on the chart for the previously stipulated pair.
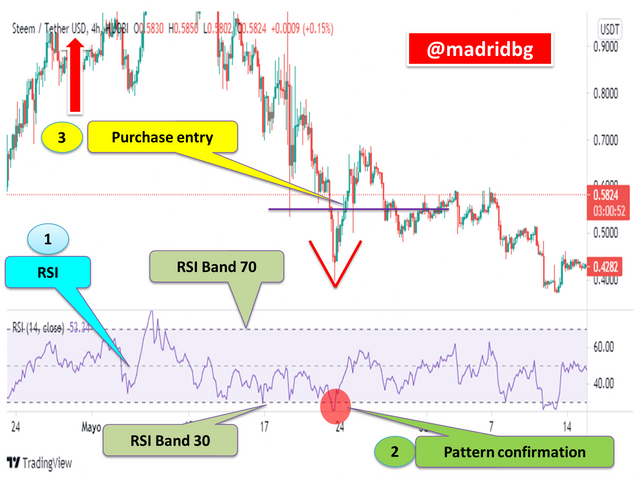
As we can see, there is a clear V-shaped shark fin formation and where we make the purchase entry according to the previously stipulated guidelines.
Exit criteria in buying position, once entered and buying the desired cryptocurrencies according to the pattern studied it is necessary to establish exit criteria that allow us to generate the respective profits, so we must consider the following aspects:
1. Establish a stop loss that allows us to defend our positions in case the analysis performed is not fulfilled, it should be placed just below the minimum generated by the V-shaped shark fin (pattern 4). In case the analysis is not fulfilled the trade will be taken as invalid and we will wait for further confirmations.
2. Establish take profit zones that allow us to take profits if the price meets our analysis, take profit levels should be according to the 1:1 risk reward ratio. (Pattern 5).
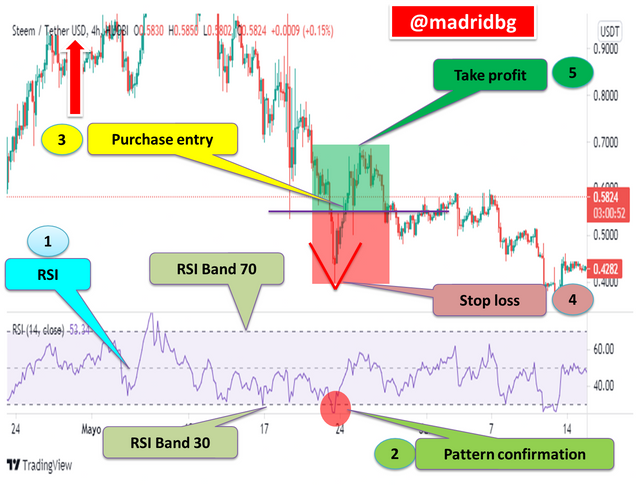
Important note: once the price has reached our take profit levels we can take profits or raise our stop loss to the entry position and let the price do what it wants, thus eliminating the losing scenario from our trading.
Scenario 2, criteria for entries and exits in sell positions, to fully address this scenario, we will rely on the chart of the BTC/USDT pair in 4-hour time frame, where we must prepare our sale entry based on:
1. Add the RSI indicator using the default patterns (pattern 1), the same will allow us to confirm the inverted V-shaped shark fin formations in correspondence with the price.
2. Be attentive to the rapid movements that the price makes and once it starts to pull back quickly and the inverted V-shark pattern is formed, evaluate the entry positions.
3. Confirm the pattern generated by using the RSI (Pattern 2), for this it is evident that the inverted V-shaped pattern exits above the RSI band 70 and quickly returns to the channel generated by the indicator.
4. Place the sell order just when the price has quickly returned to the RSI 70 band, although it is advisable to wait for the retracement and for it to enter the channel generated by the indicator. (Pattern 3)
Based on the above aspects, let's practice on the chart for the previously stipulated pair.
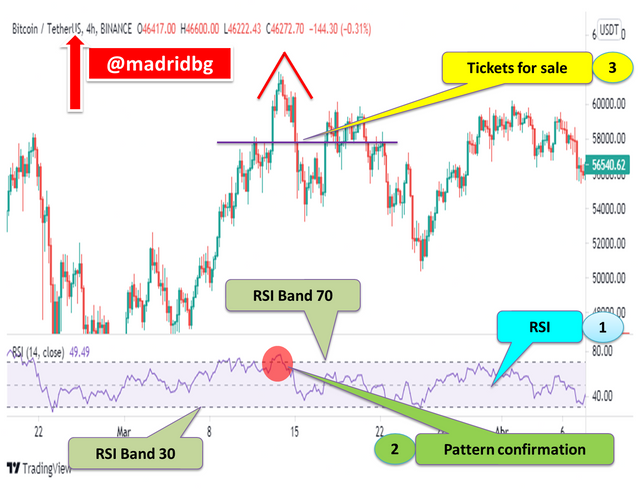
As we can see, there is a clear formation of the shark fin in the shape of an inverted V and where we make the sale entry according to the previously stipulated guidelines.
Exit criteria in sell position, once entered in sell position, according to the pattern studied, it is necessary to establish exit criteria that allow us to generate the respective profits, so we must consider the following aspects:
1. Establish a stop loss that allows us to defend our positions in case the analysis performed is not fulfilled, it should be placed just above the maximum generated by the shark fin in the form of inverted V (pattern 4). In case the analysis is not fulfilled the trade will be taken as invalid and we will wait for further confirmations.
2. Establish take profit zones that allow us to take profits if the price meets our analysis, take profit levels should be according to the 1:1 risk/reward ratio. (Pattern 5)
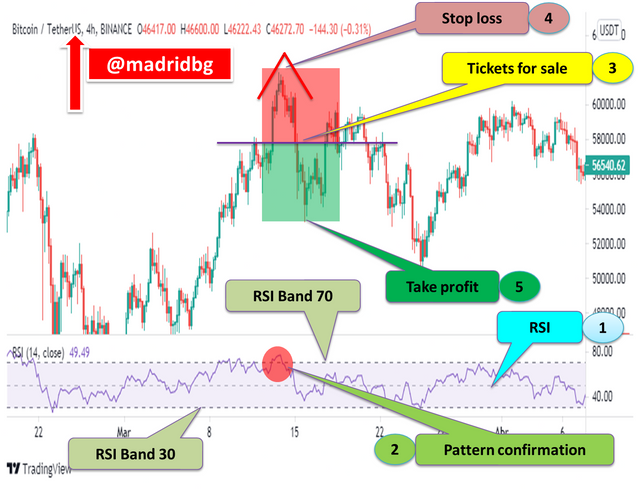
Important note: once the price has reached our take profit levels we can take profit or lower our stop loss to the entry position and let the price do what it wants, thus eliminating the losing scenario from our trading.
4. Perform at least 2 trades based on the shark fin pattern strategy (it is necessary to perform trades together with clear charts)
In this section we will apply in a practical way all the aspects learned in this lesson, so we will perform two trades for the ADX/BTC pair in one hour timeframe using the bitsgap trading platform as support, these entries and exits will be described below:
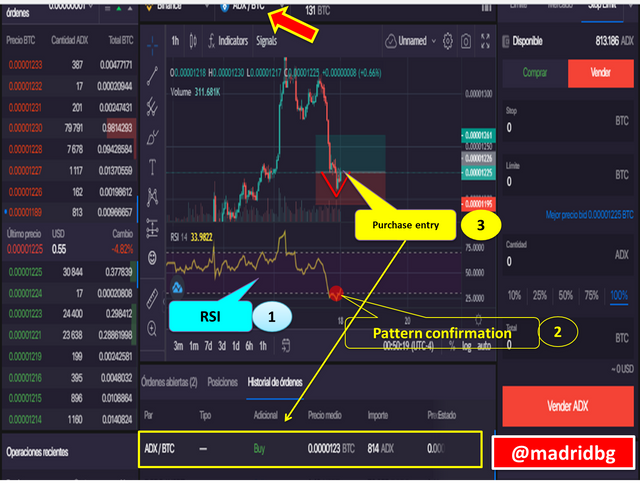
Trade 1: buy entry for the ADX/BTC pair in 1-hour time frame using the shark fin pattern.
As we can see in the chart below, visually we can detect the formation of the V-shaped shark fin pattern, which we can confirm by using the RSI indicator, so that the price went below the 30 band (pattern 2) and recovered quickly, making a pullback into the RSI channel, this movement induces us to enter the market, making the respective purchase above the 30 band of the RSI (pattern 3). So the details of the operation can be found in the following chart.
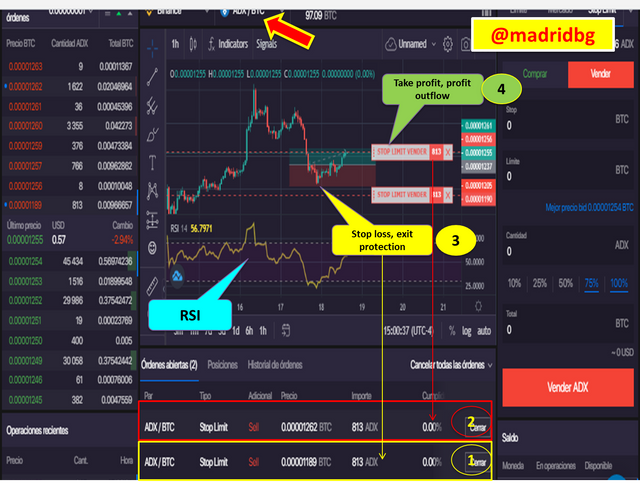
Trade 2: buy exit for the ADX/BTC pair in 1-hour time frame using the shark fin pattern.
As mentioned above, once we have obtained the purchase of our currency in this case ADX we must prepare our entry with stop loss levels that allow us to control the losses in case the market does not comply with our analysis (pattern 3) and take profit to assume the gain once the market follows the expected direction according to our projections (pattern 4), in this sense, the output we have embodied according to the ratio 1:1 risk / reward as shown in the chart.
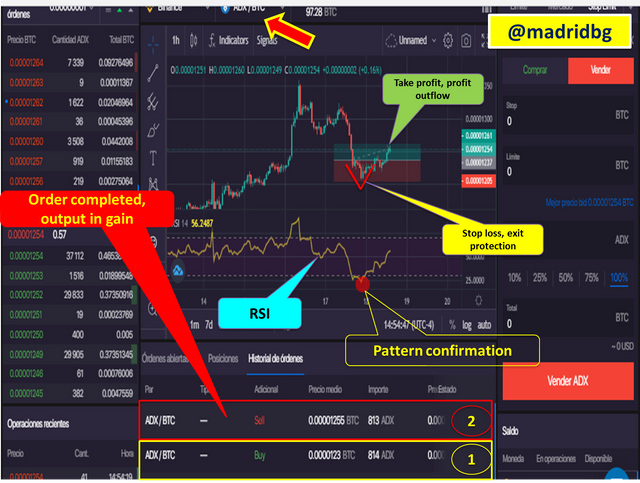
In the chart below we can observe, the filled orders, which corresponds to the stipulated take profit levels and those that allow us to exit in profit after implementing the strategy based on the shark fin pattern.
Important note: Before giving by culminated this section I would like to emphasize that the shark fin pattern in its two versions, is if you want easy to understand, although according to market movements in general it was hard for me to find cryptocurrencies that manifested the formation of the same, so I would advise once we detect the pattern we take the best advantage of it, because as you will see the strategy works if the entry and exit criteria embodied by the teacher and explained in this work are met.
FINAL CONSIDERATIONS
As has been mentioned in each delivery associated with trading and technical analysis, having knowledge of all the strategies shared by the teacher, allows us to generate greater efficiency when entering the market. In general lines the shark fin pattern in the form of V or inverted V gives us a broad view of the price action and its effectiveness was demonstrated to us in the entries and exits that we shared above.
Although the appearance of the pattern is difficult at least from the search I have done I can determine that the moment we detect it we should evaluate it and take full advantage of it due to its effectiveness.
Therefore, I consider a majestic teaching given by Professor @cryptokraze from the space of SteemitCryptoAcademy.
OF INTEREST

#cryptoacademy #cryptokraze-s3week8 #venezuela #steemexclusive #steemit #technicalanalysis #steemitcryptoacademy
Sort: Trending
Loading...