CRYPTO ACADEMY SEASON 03 -WEEK 06 | ADVANCED COURSE -NEGOTIATING LIQUIDITY LEVELS IN THE RIGHT WAY
Authored by @madridbg, via Power Point 2010, using public domain images. kalhh
Greetings and welcome dear readers of the #SteemitCryptoAcademy community and who are passionate about content associated with the world of technical analysis and trading in general. This time we will address what concerns trading in liquidity zones, a teaching driven by Professor @cryptokraze in his delivery corresponding to week 6.
In this regard, let's go to the delivery.
CONCEPTUAL AND PRACTICAL BASIS FOR NEGOTIATIONS IN LIQUIDITY ZONES

From this section, we will address each of the questions suggested by the teacher in a conceptual and practical exemplification, in order to comply with the title of this work.
1. What is your understanding of the level of liquidity? Give examples.
After a sustained reading of the information shared by the teacher, it is clear that the liquidity levels are those periods where the market associated with an asset, manifests a large confluence of operations or orders between buyers and sellers, so it is assumed as important trading areas in the asset, ie, are areas where most traders get their orders.
These orders correspond to speculative periods that traders make in their eagerness to predict the price action, so that orders are left mounted based on technical analysis performed, hoping that the price when passing through these trading points activate them, a process known as stop limit orders.
Other important inputs to establish liquidity zones are the stop losses, since the confluences of these, makes the market acquires the necessary liquidity to be able to satisfy these orders and continue its normal movement.
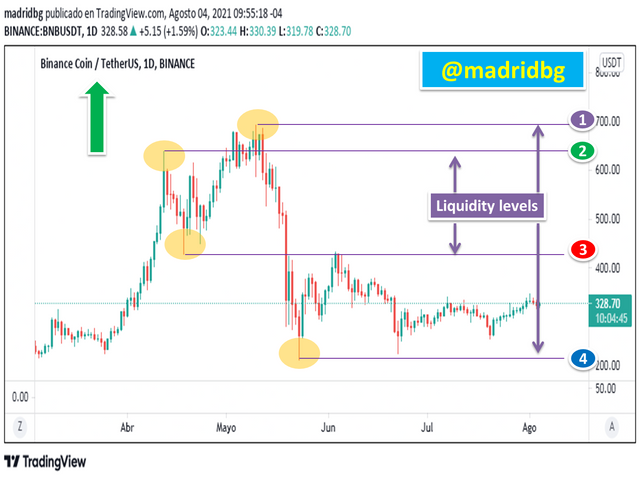
In the following chart we can see that we have identified certain liquidity levels for the BNB/USDT pair in daily timeframe.
2. Explain the reasons why traders got caught in Fakeouts. Provide at least 2 charts showing a clear fakeout.
As it is known by traders in general, the cryptoassets market is usually manipulated by institutional money and this is where small investors or retailer end up making trades and losing their money, among the reasons that stand out the most for getting caught in Fakeouts are:
1. Making early entries in correspondence with price action, speculating based on certain price movements that do not end up developing as expected.
2. Not waiting for confirmations based on our trading strategy that allows us to speculate on true breakouts.
3. Entering the market on the spur of the moment and not with a previously established and tested strategy.
4. Do not anticipate manipulations made with institutional money in search of generating liquidity in the market.
5. Placing very tight risk control inputs that are easy to be swept away by liquidity levels.
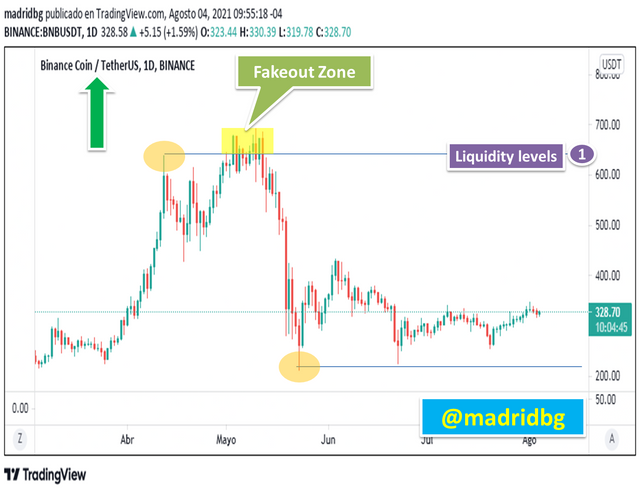
In the above chart, we can observe for the BNB/USDT pair in daily temporality, some liquidity zones generated for this asset (pattern 1), where it is to be expected that many retail investors were trapped before an imminent Fakeouts since the price by technical analysis should continue to rise and on the contrary made a significant correction in the opposite direction to the expected movement leaving investors trapped in these areas.
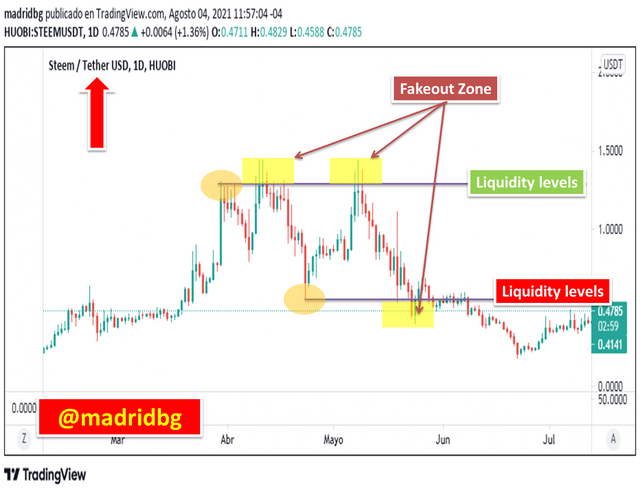
Likewise for the STEEM/USDT pair in daily timeframe, we have been able to identify important liquidity zones, as well as price movements that have caused small investors to enter Fakeouts as a result of manipulations caused in the market. In other words, the price is speculated in a direction that the price action does not respect.
3. How can you trade liquidity levels the right way? Write down the trading criteria for trading liquidity levels.
The speculation or negotiation process at liquidity levels should be carried out using the principles addressed in the professor's previous classes and which respond to the following strategies:
[1] Market Structure Breakthrough (MSB) strategy for trade reversal. Article: Online Access
[2] Break, rebuke, breakout (BRB) strategy for continuation trading. Article: Online Access
So I will leave the links to each publication so that we can fully understand what we are talking about. Under this conception we can assume two types of scenarios that allow us to analyze the market and escape from the manipulations that are made on an asset, based on institutional money.
In this sense, the correct way is to expect a configuration of the MSB or BRB type. In the case of the former (MSB), we should wait for the reversal of the asset and trade according to this, for the latter (BRB), wait for the market to make the breakout, reprice, breakout moves to enter according to the criteria of this strategy.
Another aspect that we must take into account s the temporality of the asset since it is advisable to delimit the levels of liquidation in high temporality charts (daily or 4 hours) and look for entry zones in the charts of lower temporalities to these. If we fully comply with these principles we will be more efficient when entering the market and we will be able to identify Fakeout zones.
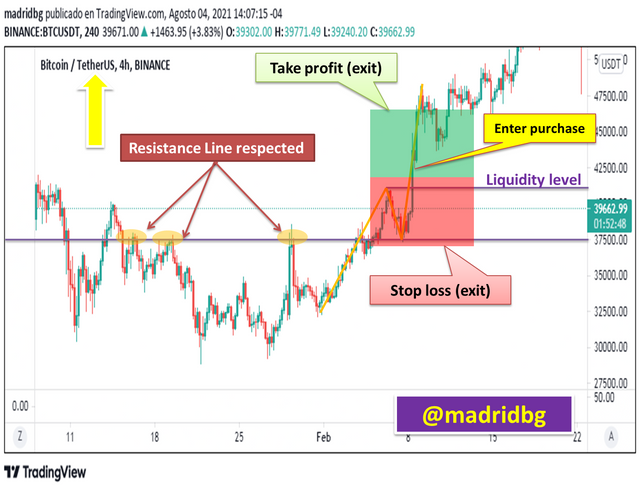
In the previous chart we can see how a proper configuration is formed according to the BRB strategy for the BTC/USDT pair in 4 hours timeframe, in this sense, we will follow the parameters of the strategy to enter the market. These guidelines in a summarized form are:
1. As the market is bullish, mark a clear resistance line.
2. Expect the price to break the resistance line and generate a higher high.
3. Wait for the price to correct and test the now generated support, bouncing towards the generated high.
4. Wait for price to forcefully break the newly generated high to enter the market trading with confirmations and evading the Fakeouts scenario.
5. Profit taking must respect the 1:1 risk/reward ratio.
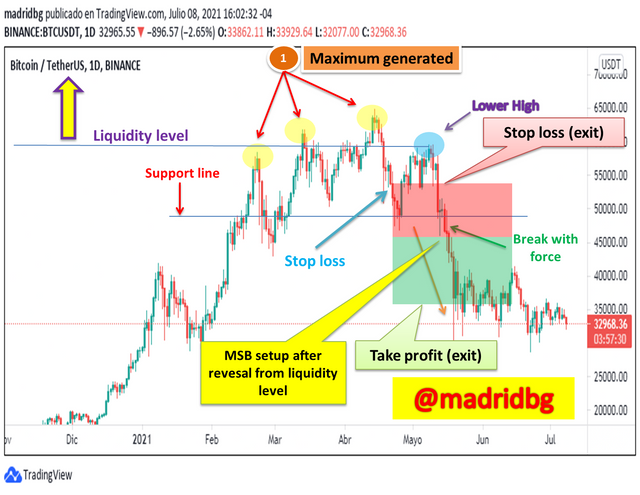
In the above chart, we can evaluate the scenario under the MSB strategy, taking into account the liquidity levels for the BTC/USDT pair in daily temporality, where in a summarized form we can highlight the following aspects:
1. Observe the formation of Lower High that occurs after an uptrend that generates consecutive higher highs, the lower High is a maximum that is formed with less strength than the previous ones.
2. Establish a support line and wait for the price to break it with strength.
3. Take profit must respect the 1:1 risk/reward ratio.
Important note: for more information related to the MSB and BRB strategies, remember to consult the links left at the beginning of this section, where you will find every trading detail associated with them, both for uptrend and downtrend.
4. Draw trade configurations of liquidity levels in 4 cryptographic assets.
In this section of the subject we will apply everything we have learned throughout the writing and the teaching transmitted by the professor, so that we will establish commercial configurations following as a reference the levels of liquidity and the guidelines of the MSB and BRB strategies in each of the scenarios.
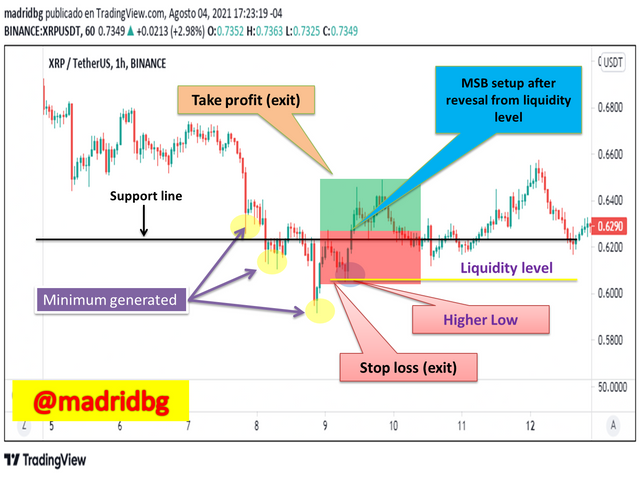
Example 1: XRP/USDT pair in 1 hour time frame, for this example we use as support or reference the MSB strategy, so that the entry was configured according to the parameters of the same.
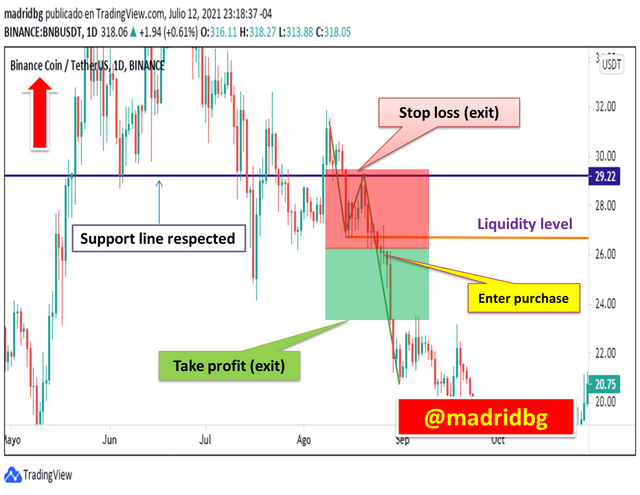
Example 2: BNB/USDT pair in daily timeframe, in this scenario the strategy we use to avoid Fakeouts and establish trading criteria is the BRB, so the entry was configured according to the parameters of this strategy.
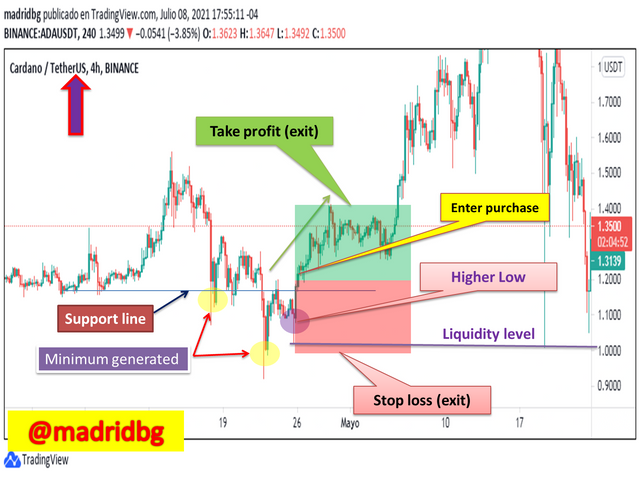
Example 3: ADA/USDT pair in 4 hours time frame, for this example we use as support or reference the MSB strategy, so the entry was configured according to its parameters.
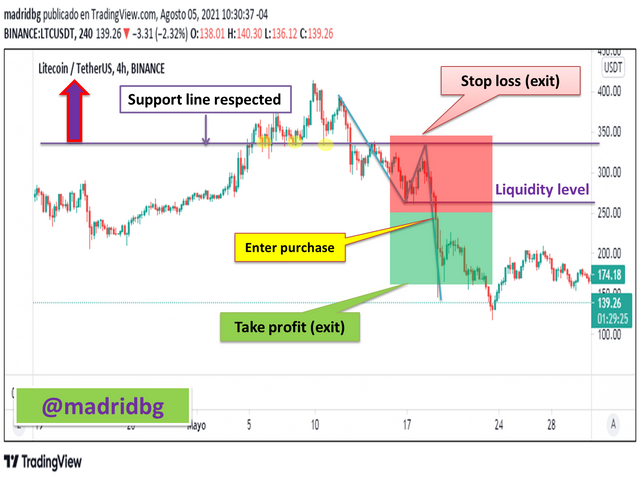
Example 4: LTC/USDT pair in 4-hour timeframe, as we observe in the following chart we use to associate the entry in liquidity levels, the BRB strategy so that we can identify Fakeout zones and not get trapped in these.
Important note: Remember that all aspects associated with liquidity levels and the MSB and BRB strategy to enter the market, were explained in the body of this paper, so we did not mention those aspects in this section, on the contrary we tried to be as explicit as possible in each chart generated.
FINAL CONSIDERATIONS
Having different methods to analyze the market, allows us to general a broader view about it, in this particular I consider a very good delivery made by the teacher to make us reflect and understand the levels of liquidity that forms the price action of a cryptographic asset.
Under these criteria the MSB and BRB strategies are a great alternative to avoid falling into the famous Fakeouts or speculations that are made to sweep the entries and generate liquidity in the market of a specific asset, generating losses in small investors.
OF INTEREST

#cryptoacademy #cryptokraze-s3week6 #venezuela #steemexclusive #steemit #technicalanalysis #steemitcryptoacademy
Sort: Trending
Loading...