CRYPTO ACADEMY SEASON 03 -WEEK 04 | ADVANCED COURSE: TRADING DYNAMIC SUPPORT AND RESISTANCE

Authored by @madridbg, via Power Point 2010, using public domain images. Clker-Free-Oleg Gamulinskiy
Greetings and welcome dear readers to this exciting training related to the world of cryptocurrencies and trading in general that is being promoted from the #SteemitCryptoAcademy community in its season 3.
In this sense, giving continuity with the classes of Professor @cryptokraze in this installment we will address what concerns the cryptoasset market in terms of the uses of dynamic support and resistance.
So let's start with the conceptual and practical approach to the topic in question.
CONCEPTUAL AND PRACTICAL APPROACH TO THE PROPOSED APPROACHES

Through this contribution we will describe each of the technical aspects of the strategy suggested by the teacher, which will be based on conceptual and practical aspects in order to establish a clear understanding of the content and allow us to respond to each approach provided.
1. What do you understand about the concept of dynamic support and resistance? Provide examples of crypto assets charts.
The support and resistance levels that we eventually mark by horizontal lines, are those points where the price can generate a rebound either bullish or bearish according to the trend in which we are operating.
In the case of dynamic supports and resistances, a concept coined by Professor @cryptokraze in his class or teaching, I consider it as that point that is formed diagonally or in correspondence with the trend, which the price action tends to respect, although in many cases it can be drawn manually, in others it is done under the configuration of exponential moving averages, which has the particularity of following the price action hence it is established with the term dynamic.
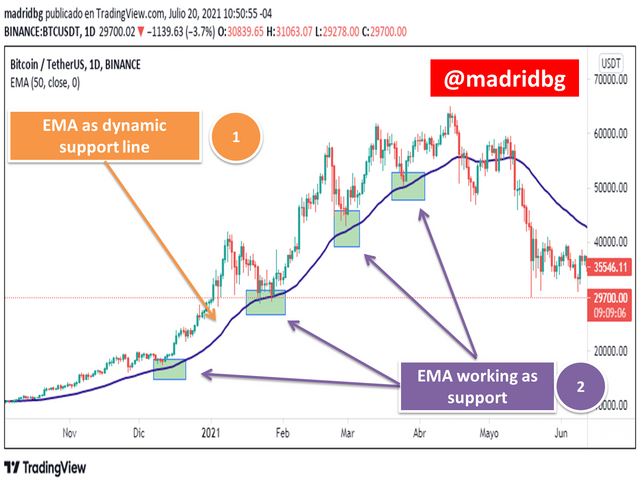
In the following chart, we can observe the behavior of the dynamic support generated by the exponential moving average (Pattern 1) for the BTC/USDT pair in daily temporality, in this chart, we can realize that the price is above the EMA and every time it performs a pullback respects this as a support, generating a rebound to continue rising as we observe in the boxes identified as pattern 2.
Note: It is necessary to remember that the generated support is dynamic because it keeps moving according to the price action tracking.
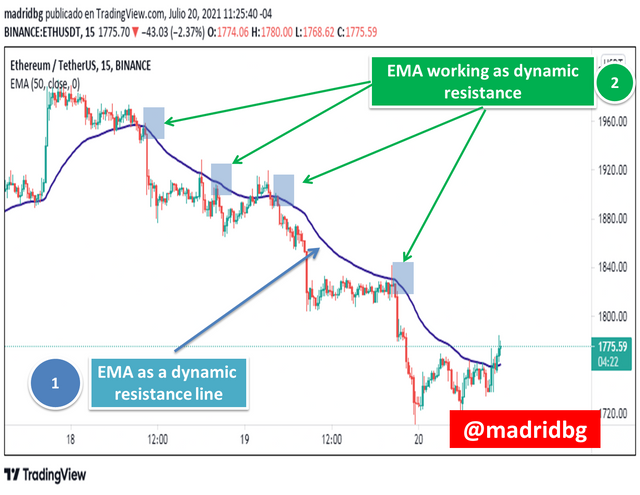
Regarding the dynamic resistance, we can observe its behavior through the following chart (ETH/USDT pair, 15 minutes timeframe), where we can determine that the price is below the EMA (Pattern 1) and every time the price goes up it meets the EMA which acts as an obstacle or resistance that makes the price bounce downwards, as seen in the boxes marked in pattern 2.
Note: It is necessary to remember that the resistance generated is dynamic because it keeps moving according to the price action tracking.
2. Make a combination of two different EMAs other than 50 and 100 and display them on the encryption charts as Support and Resistance.
As we know a 50 EMA is the general average of the price in a given timeframe and therefore is the one that best follows the behavior of the price action, however, due to my trading style which focuses on 4-hour and 1-day technical analysis I have been working with the configuration of two exponential EMAs of 10 and 55 periods respectively.
The first considered as the fast EMA (pattern 1) allows me to aggressively follow the price and the second EMA of 55 periods also called slow EMA is the one that allows me to establish clear resistances and dynamic supports when entering the market.
Both create a channel that allows to speculate the possible movements that the price can generate according to a specific asset. In this sense, let's analyze the behavior of this configuration for both bull and bear markets.
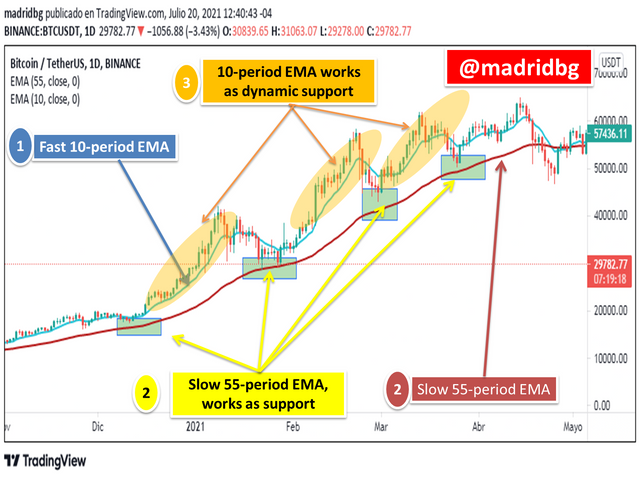
Behavior of the 10-period and 55-period EMAs when the scenario is bullish.
As we can see in the chart the 10-period EMA allows us to closely follow the price to such a point and when there is a strong contraction the 55-period EMA behaves as a strong support zone since the price respects it, the idea behind placing in 55 periods has to do with the fact that it marks us better zones to place our stop loss, aspect that we will describe later in this writing.
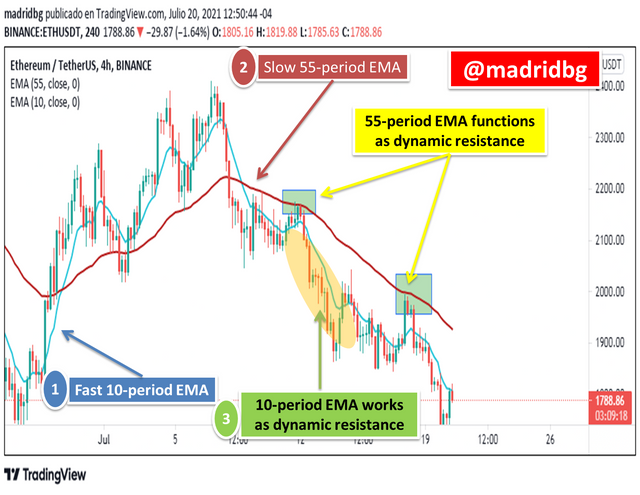
Behavior of the 10-period and 55-period EMAs when the scenario is bearish.
As we can see in the chart below, the combination of the 10 and 55 period EMAs fits the bearish scenario very easily, the first one (10 period EMA) follows the price closely, behaving as a resistance zone and the 55 period EMA when the contractions are stronger marks strong resistance points that we can use to set our stop losses, aspects that we will discuss later.
3. Explain the trade entry and exit criteria for buy and sell positions using dynamic support and resistance on any crypto asset using any time frame of your choice.
In this section of the subject we will address the most relevant aspects that we must take into account to carry out market entry and exit operations either in the form of purchase or sale.
Criteria for entry and exit in buying position, in order to enter in buying by using the strategy of dynamic support and resistance we will use as a reference in BTC/USDT pair in daily temporality, where it is advisable to take into account the following aspects:
1. The price must move above both moving averages previously established in the charts, according to the instructions we will work with the 50 and 100 period EMAs respectively (Pattern 1 and 2).
2. As we are in an uptrend, the entry should occur once the price has reached the 50 period EMA and make the respective rebound (pattern 3), it is at this point that we can consider as an entry signal, since sometimes we enter together above the EMA and the price ends up not respecting and generated invalid configurations.
3. In case the price has made a strong contraction, to such an extent that it has reached our 100 EMA, it is advisable to wait for it to cross the 50 EMA and enter above it.
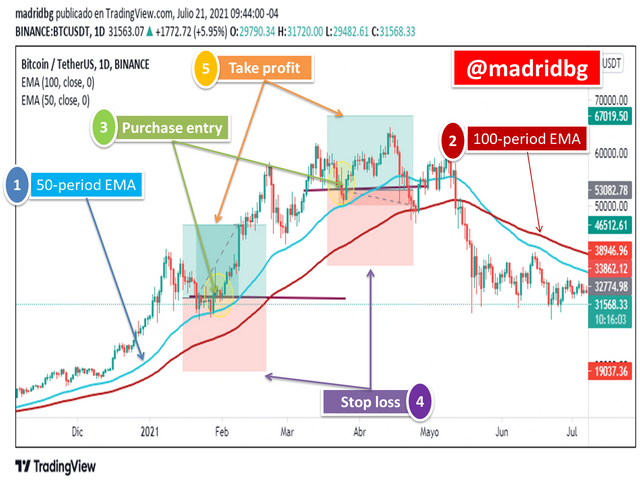
With respect to the exits of the market in purchase positions, we must consider placing stop loss that allows to protect our trading before an imminent change of trend that induces us to lose our capital, at this point it is advisable to take into account the following aspects:
1. Place the stop loss below the 100-period exponential moving average (pattern 4), in case the price touches our stop we have to consider the entry as invalid and seek new positions.
2. In case the price action moves in the analyzed or desired direction, we should set the take profit zones (pattern 5) that goes in correspondence with the 1:1 risk-reward ratio.
Note: in order not to make the work so extensive in the previous chart we can observe the configurations of entry and exit of the market in buy positions, respecting the configuration of support and dynamic resistance.
Entry and exit criteria in sell position, in order to enter in sell positions by using the dynamic support and resistance strategy we will use as a reference in ETH/USDT pair in 4 hours timeframe, where it is advised to take into account the following aspects,
1. The price must move below both moving averages previously established in the charts, according to the instructions we will work with the 50 and 100 period EMAs respectively (Pattern 1 and 2).
2. As we are in a downtrend, the entry should occur once the price has reached the 50 period EMA and make the respective rebound (pattern 3), it is at this point that we can consider as an entry signal, since sometimes we enter right at the EMA and the price ends up not respecting and generated invalid configurations.
3. In case the price has made a strong contraction, to such an extent that it has reached our 100 EMA, it is advisable to wait for it to cross the 50 EMA and enter below it.
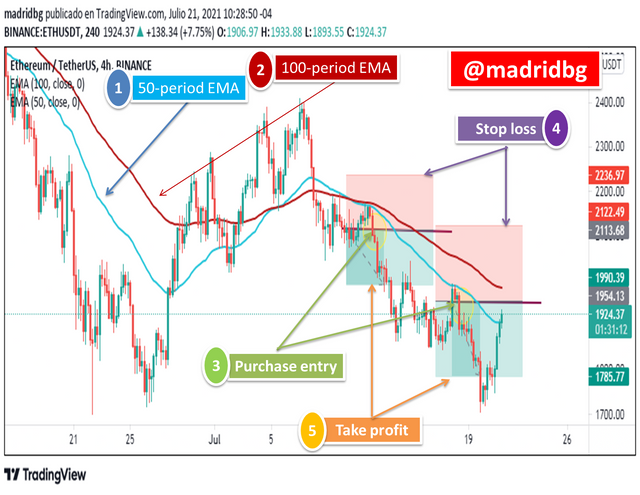
With respect to the exits of the market in sale positions, we must consider placing stop loss that allows to protect our trading before an imminent change of trend that induces us to lose our capital, at this point it is advisable to take into account the following aspects:
1. Place the stop loss above the 100-period exponential moving average (pattern 4), in case the price touches our stop we have to consider the entry as invalid and seek new entry positions.
2. In case the price action moves in the analyzed or desired direction, we should set the take profit zones (pattern 5) that goes in correspondence with the 1:1 risk-reward ratio.
Note: in order not to make the work so extensive in the previous chart we can observe the configurations of entry and exit of the market in sell positions, respecting the configuration of support and dynamic resistance.
4. Perform 2 demo trades on cryptoassets using the Dynamic Support and Resistance strategy. You can use a lower time period for these demo trades.
This part of the thematic, I consider it the practical training since the teacher challenges us to implement what we have studied, in this sense, let's go to the demonstration.
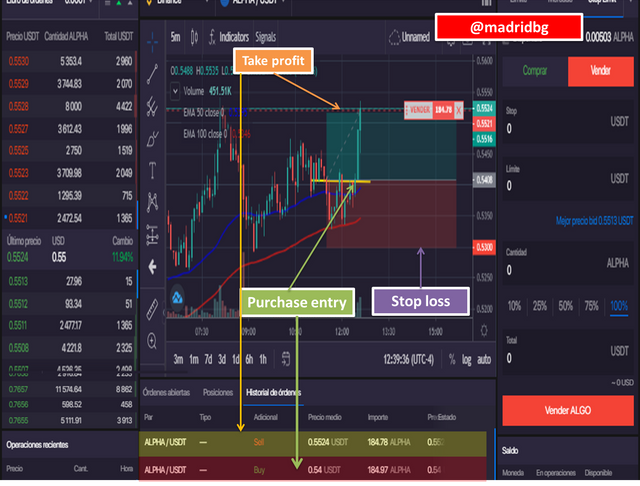
Trade 1: entry and exit in buy for the ALPHA/USDT pair in 5 minutes timeframe.
This trade was intended to implement the knowledge acquired about supports and dynamic resistance, in this particular we managed to obtain an entry that meets the expectations of any trade, which is to generate income.
As we observe in the following chart, we entered according to the approaches provided by the professor establishing stop loss and take profit zones, where if we analyze the price action we realize that the operation was closed according to the expected obtaining the established profits. Therefore the strategy has worked 100%.
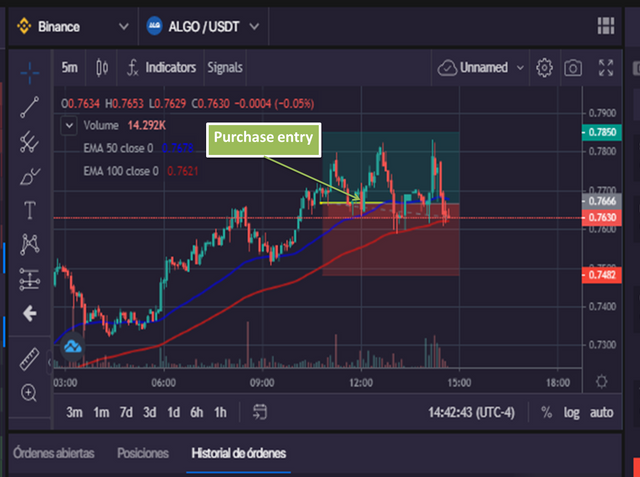
Trade 2: buy entry and exit for the ALGO/USDT pair in 5-minute time frame.
As in the previous operation, we follow the methodology of the dynamic support and resistance strategy, at this point let's look at the chart and evaluate the results obtained.
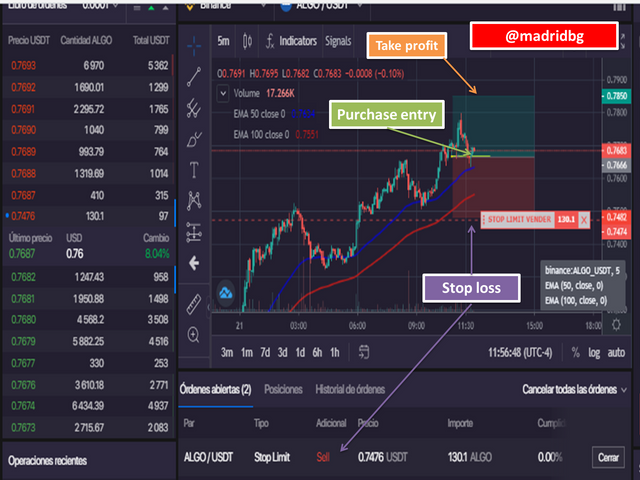
As we can see in the chart, we stipulated our stop loss and take profit zones in search of the desired profits. However, although initially the price moved in our favor, after some time it failed to reach our take profit level, once in this scenario we must choose to take partial profits or let the price continue to move in the corresponding direction.
In particular, we let the price develop as seen in the image below, where it has made significant corrections until the 100-period EMA respects it as support, but has not generated the momentum needed to overcome our take profit, which allows me to infer that the strategy has paid off and in scenario like this in better to get the partial profits generated.
FINAL CONSIDERATIONS
The use of moving averages will always be an indicative that will allow us to evaluate the price action and if we use this tool to establish dynamic support and resistance zones we will obtain greater efficiency when approaching the market, hence the importance of understanding and studying this strategy addressed by the professor.
Among the aspects that we must take into account when facing the market, the following stand out:
1. Combine the EMAs according to our trading style.
2. Have clear entry and exit criteria for the market stipulated according to the strategy.
3. Establish dynamic support and resistance zones according to the EMAs and price action tracking.
OF INTEREST

#cryptoacademy #cryptokraze-s3week4 #venezuela #steemexclusive #steemit #technicalanalysis #steemitcryptoacademy
Dear @madridbg
Thank you for participating in Steemit Crypto Academy Season 03 and making efforts to complete the homework task. You got 10/10 Grade Points according to the following Scale;
Key Notes:
*.You have shown good understanding of the strategy by making precise charts for different elements of the strategy.
We appreciate your efforts in Crypto academy and look forward for your next homework tasks.
Regards
@cryptokraze
Thank you very much @cryptokraze for such a valuable assessment of my activity, no doubt this detailed description motivates us to continue working and publishing quality content. Greetings and thanks again