Candlestick patterns - Steemit Crypto Academy Season 4 - Homework Post for [ @reminiscence01 ] Task 10.
INTRODUCTION
After going through this wonderful and impact with each other. I must say that it has really made and help me understand a lot when it comes to the Japanese candlestick chart and how easy it is for newbie and traders to make use of it in capital management, I will complete, the tags by giving my best answers to the following questions.

Questions
1a) Explain the Japanese candlestick chart? (Original screenshot required).
b) In your own words, explain why the Japanese Candlestick chart is the most used in the financial market.
c) Describe a bullish and a bearish candle. Also, explain its anatomy. (Original screenshot required)
Explain the Japanese candlestick chart? (Original screenshot required).
The Japanese Candlestick is a technical tools that is of great importance and benefits when it comes to buying and selling digital assets, such as cryptocurrency. The traders use this tool to perform a lot of things which have benefited him or her greatly, this candlestick chart was founded and developed by cereals trader(rice trader) who was from Japan, by the name Munchisa Homma. The Japanese Candlestick is very important that it is also used by traders of forex also in utilizing their own assets and in making decisions.
The Japanese candlestick chart is very important and useful in that, with it the trader can be able to perform so many useful things such as, taking a look at the chart and predicting the trend movement, and also the price movement. It also help traders in utilizing your their funds, which will generate profit, and also help them in decision making.
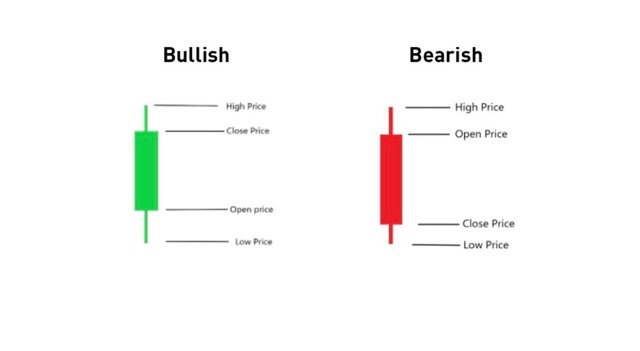
Talking about the Japanese Candlestick charts, you cannot complete it without mentioning the two important things inside it, which are the two candlesticks in it, because it is what makes the chart complete, the two candlesticks, in a Japanese candlesticks are the bullish candlestick, and the bearish candlestick, the bullish candlestick, is the candlestick that is green in color, and always signifies when there is an increase in price of assets, or the market is moving in an uptrend direction. When we are talking about the bearish candlestick, It is the inverse of the bullish candlestick. The Bearish candle has to do with when the prices of assets is at decreasing rate and signifies when the market is a downtrend or bearish trend.
Source
The 2 candlestick (bullish and bearish candlestick) are important and they have basically the same characteristics which are
which play important role in the Japanese candlestick chart, the 2 candlestick also have the same components which are the low, the open, the high and the close
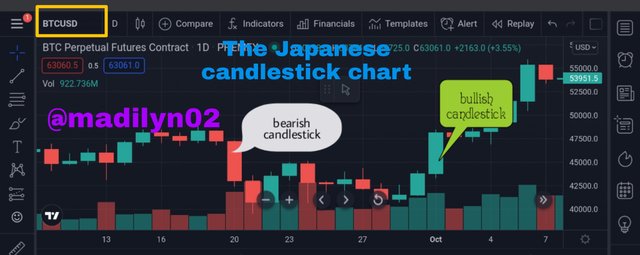
I will be using BTCUSD cryptocurrency pair in the Japanese candlestick below to show this 2 candles
Source
b) In your own words, explain why the Japanese Candlestick chart is the most used in the financial market.
- Trend movement
- Price movement
- Entry and Exits in the market
- Prediction
- Easy to use
- Profit making
- Capital Management
Trend movement
With the Japanese Candlestick, a trader will be able to know how the trend of the market is moving which will play a vital role here, if the trend is in bullish trend or in bearish trends and the trader can make use of this opportunity and know what to do in the markets by making the favourable decision.
Price movement
The chart also helps traders in knowing the price movement which by this they will know if the price is increasing or decreasing. If the price is increasing, the trader can enter the market and sell his assets but when decreasing we can buy assets at a lower rate and keep till the price rise again, so that we sell and make profit.
Entry and Exit of the market
Talking about to enter and exit the market, it is related to the market trend and the price movement because when the price is at increasing rates or bullish trend, it is the best time to enter the market and make a lot of money. But when the price is reducing, it is also favorable for traders to enter and buy assets at lower rates. It's also important to exit the market when the price is reducing so as not to lose the profit you make when the market was increasing.
prediction of price movements.
when talking about how to predict the price movements using the Japanese candlestick chart, it is for people that are professional not anyone because the will have to study the chart, combined with another indicator to be able to do this
Easy to use
The Japanese candlestick chart is very easy to use. It is a priceless chart that someone with little idea about cryptocurrency can adapt slowly. Let's say imagine you telling someone the bullish candle is green when which means it is increasing price and red which means price is decreasing. It will be easy for someone like a newbie to use it slowly.
Profits making
Profit making has to do with a situation in which a trader enters the market when it is in bullish trend and sells out the asset he bought when the price was low and this will aid in profit making
Capital Management
Capital Management as to do with existing the market when the price is low So as not to lose the profit made earlier.
c) Describe a bullish and a bearish candle. Also, explain its anatomy. (Original screenshot required)
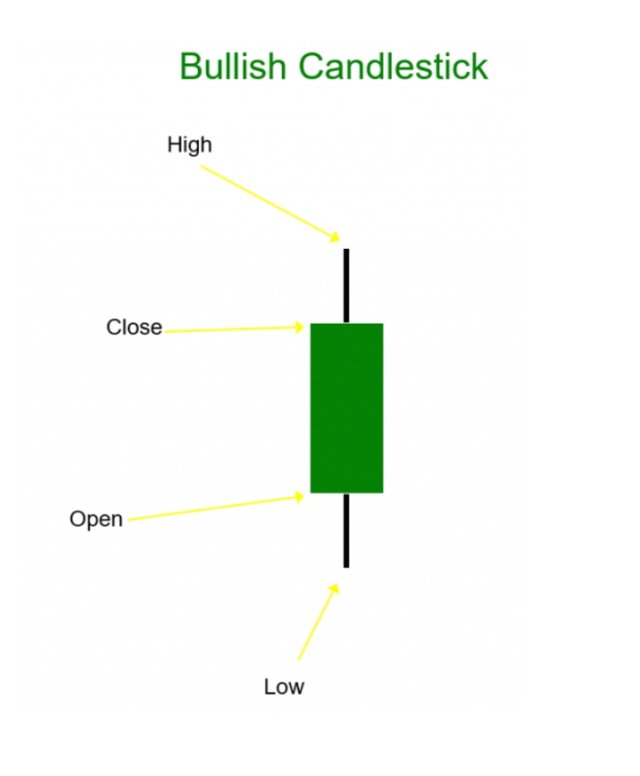
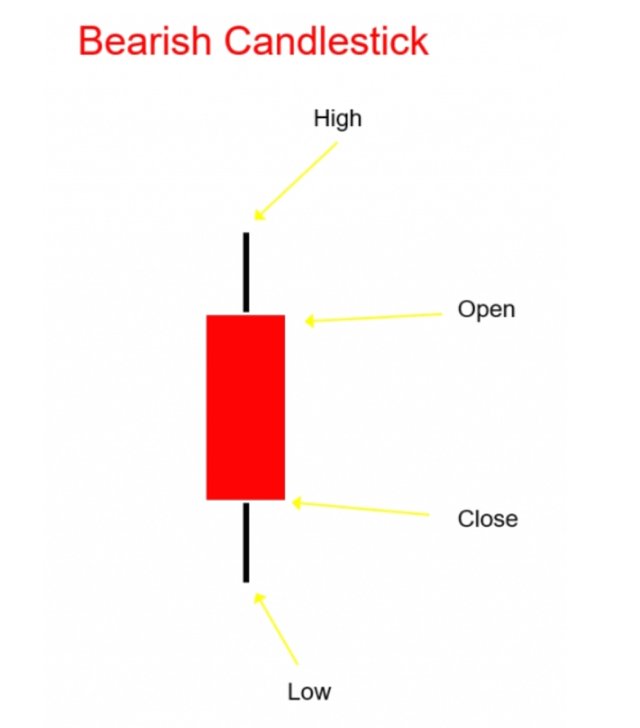
Bullish Candlestick
This type of candlestick is one of the candlesticks that is found on the Japanese candlestick and it shows when the market price is increasing and when the market is moving in a bullish trend. The bullish candle is the type of candle in which traders usually use when they see the signal to enter the market and sell out assets which will generate profits. This assets sold here is always gotten at a lower price (bearish candlestick) which means they bought at low and sold at high when price increased to generate more profits the candlestick has four components which are
Source
The open
when we talk about the open in bullish this has to do with the price in which the market is opening with or beginning with.The high
The high is the highest price of an asset in the bullish candle stick at a particular period of time.The close
when we make when we talk about the open in bullish this has to do with the price in which
the market is closing or ending with.The low
The high is the lowest price of an asset in the bullish candlestick at a particular period of time.
The bullish candlestick is sometime refer to as the positive candlestick and it is very useful to trader especially when the trader spot a bullish trend which mean that there is an increase in price and the trader can maximize or utilized this opportunity by entering the market to make profit.
I will be showing a bullish trend of BTCUSD to show a bullish trend below
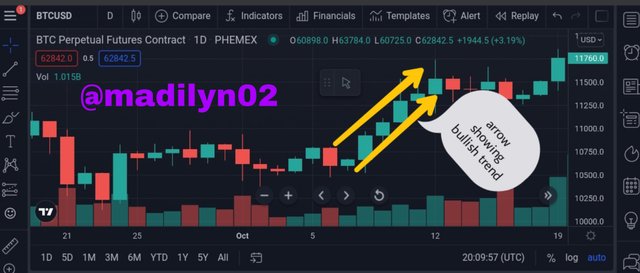
Source
Bearish Candlestick
This type of candlestick is one of the candlesticks but inverse of bullish candle, it is also found on the Japanese candlestick and it shows when the market price is decreasing and when the market is moving in a bearish trend the bearish candle is the type of candle in which traders usually when they see the signal to exist the market with they generate profits the made when the market was in bullish trend, so as not to lose.
Source
The open
when we make when we talk about the open in bearish this has to do with the price in which
the market is opening with or beginning with.The high
The high is the highest price of an asset in the bearish candle stick at a particular period of time.The close
when we make when we talk about the open in bearish this has to do with the price in which
the market is closing or ending with.The low
The high is the lowest price of an asset in the bearish candlestick at a particular period of time.
The bearish candlestick is sometime refer to as the negative candlestick and it is very useful to trader especially when the trader spot a bullish trend which mean that there is an derease in price and the trader can maximize or utilized this opportunity by existing the market with already made profit.
I will be showing a bearish trend of BTCUSD to show a bearish trend below
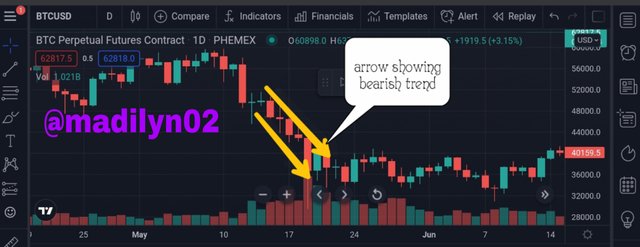
Source
CONCLUSION
From this lecture, it has shown me that there is alot when we are talking about the Japanese candlestick chart and we should always be care when using it because with it, we can really achieve alot.
Great thanks to prof @reminiscence01 for the lecture.
I am also grateful to prof @dilchamo and prof @nane15 . Thank you
#club5050 😀