Crypto season 3 week 4 - homework post for professor @cryptokraze - Dynamic Support and Resistance
Hello Everyone, so today I invite you all to read my today Dynamic Support and Resistance subject which is given by Professor @cryptokraze.
So let us continue with our homework.
1. What do you understand about the Concept of Dynamic Support and Resistance? Give Chart Examples from Crypto Assets.
So normally the support and resistance are usually Horizontal lines from where the prices go up or down. While the Dynamic support and resistance work on the Exponential Moving Average and moves alongside the price and show the fluctuation in the prices of the asset or market.
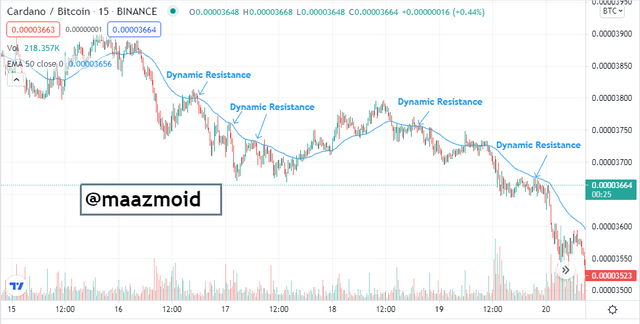
Dynamic Resistance:
So I will be using Exponential Moving Average (EMA) in that and will see the dynamic resistance. So this whenever the price touches the EMA line the price will go down in that.
So here I have used the ADA/BTC chart of the 15 min timeframe and here you can see the Dynamic Resistance. As the point where the candles touch the EMA line the prices again go down from that point.
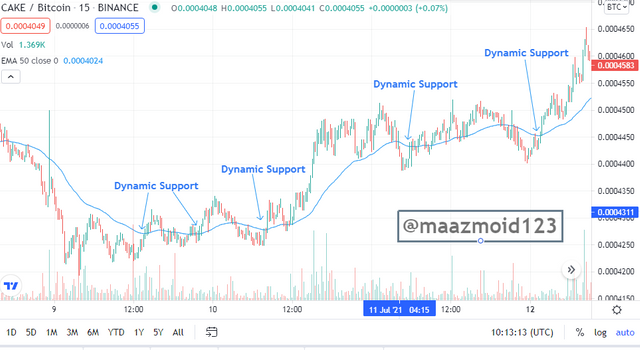
Dynamic Support:
So here as well I will be using Exponential Moving Average (EMA) in that and will see the dynamic Support. So this whenever the price touches the EMA line the price will go up in that.
So here I have used the CAKE/BTC chart of the 15 min timeframe and here you can see the Dynamic Resistance. At the point where the candles touch the EMA line the prices again go up from that point.
2. Make a combination of Two different EMAs other than 50 and 100 and show them on Crypto charts as Support and Resistance.
So as the professor asked to use the combination of two different EMAs other than 50 and 100 so I will be using the combination of 60 and 150 lines. So in this, the green line is the 60 EMA, and the Below line is 150 EMA.
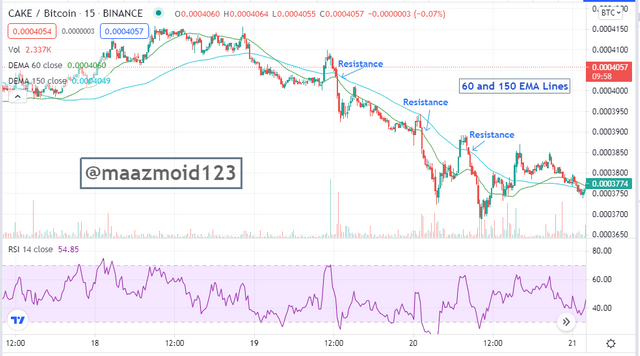
EMA 60 and 150 Resistance Level:
So in this, I have to use the chart of CAKE/BTC of 15 minutes time frames. And I am using the 60 EMA Line and 150 EMA Line.
So when the candles touch the 60 EMA line the prices will go down. And if it then touches 150 EMA line the price will change more.
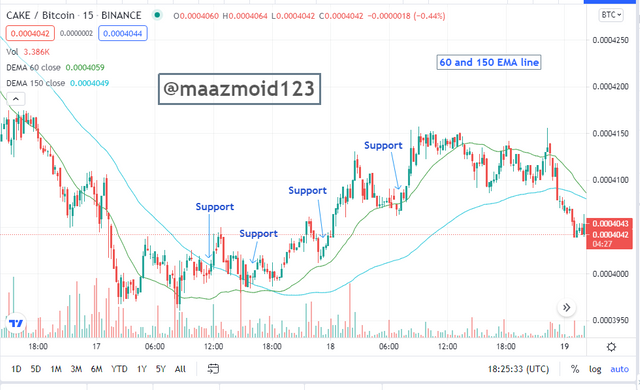
EMA 60 and 150 Support Level:
So in this, I a, also using the chart of CAKE/BTC of 15 minutes time frames. And I am using the 60 EMA Line and 150 EMA Line.
So when the candles touch the 60 EMA line the prices will go up. And if it then touches 150 EMA line the price will change more.
3. Explain Trade Entry and Exit Criteria for both Buy and Sell Positions using dynamic support and resistance on any Crypto Asset using any time frame of your choice
Trade Entry:
So now I will tell both the buy and sell trade entry criteria.
Trade Entry for Buying Position:
So as you have to put the two EMA's or Exponential Moving Averages on your chart as I have used 60 and 150 but you can also take it more or less also.
The price of the asset or candles showed be above both of the EMA lines.
Don't just buy when you see the price touch the EMA line wait for some time to cross that line then buy, as usual, the market changes its direction also.
So when the price got or move above the 60 EMA line, then you can make your purchase.
To take a profit wait for the price to go above the 60 EMA.
As when the price moves above 60 EMA, then make a buy order.
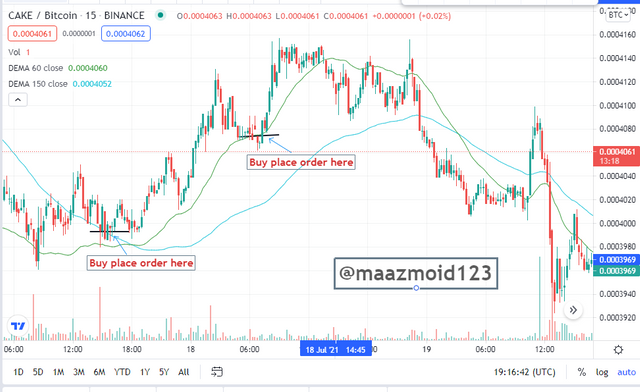
Note: So by this strategy, we can enter the market at some moments or in other words it has more opportunities to enter in the market. As if we see in the picture above there are 2 moments where the price touches the EMA line and then moves back up.
Trade Entry for Sell Position:
So as you have to put the two EMA's or Exponential Moving Averages on your chart as I have used 60 and 150 but you can also take it more or less also.
The price of the asset or candles showed be below both of the EMA lines.
Don't just sell when you see the price touch the EMA line wait for some time to cross that line then sell, as usual, the market changes its direction also.
So when the price got or moves below the 60 EMA line, then you can make your purchase.
To take a profit sell wait for the price to go below the 60 EMA.
As when the price moves below 60 EMA, then make a sell order.
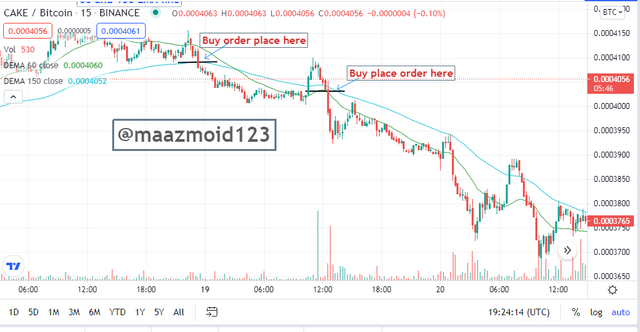
Note: And just like the buying order, in seel order also you will get more opportunities to sell, as mostly the price touch again the EMA line and then moves in the same direction again.
Trade Exit Criteria:
So now I will tell both the buy and sell trade Exit criteria.
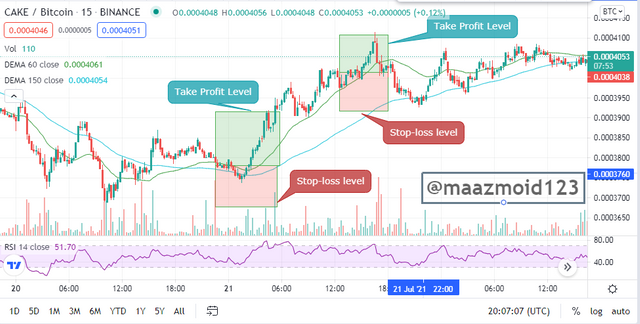
Trade Exit for Buy Position:
So usually in trading there are chances of the signals to go in the wrong way so we must set a stop loss.
The stop loss must be below the 150 EMA line to save us from a big loss.
So we must cancel the trade if the price goes below stop loss, as it will count as invalidate.
Our profit level should be 1:1 (Risk: Reward) at least to make it equal to our stop loss.
The recommended profit should be 1:1, but you can also go for 1:2 but it will increase the risk.
Exit the market when you get a good profit.
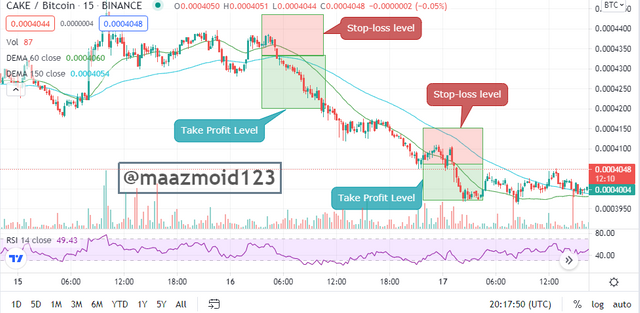
Trade Exit for Sell Position:
So similarly in this usually in trading there are chances of the signals to go in the wrong way so we must set a stop loss.
The stop loss must be Above the 150 EMA or Exponential Moving Average line to save us from a big loss.
So we must cancel the trade if the price goes Above stop loss, as it will count as invalidate. And we should then wait for another signal.
Our profit level should be 1:1 (Risk: Reward) at least to make it equal to our stop loss.
The recommended profit should be 1:1, but you can also go for 1:2 but it will increase the risk.
Exit the market when you get a good profit.
4. Place 2 demo trades on crypto assets using Dynamic Support and Resistance strategy. You can use a lower timeframe for these demo trades
So now I am gonna show you all the 2 demo trades on crypto assets using Dynamic Support and Resistance strategy. And I will be doing this on Trading View.
1. CAKE/BTC on 15 minutes TIme Frame:
Here I have taken a chart of CAKE/BTC on 15 minutes Time Frame. And I have take the EMA or Exponential Moving Average at 50 and 100.
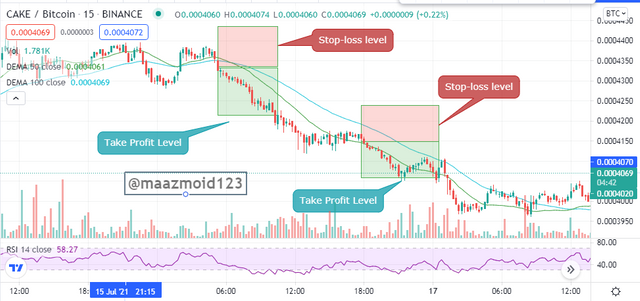
So here I will just wait for the price against the 50 EMA I placed my sell order.
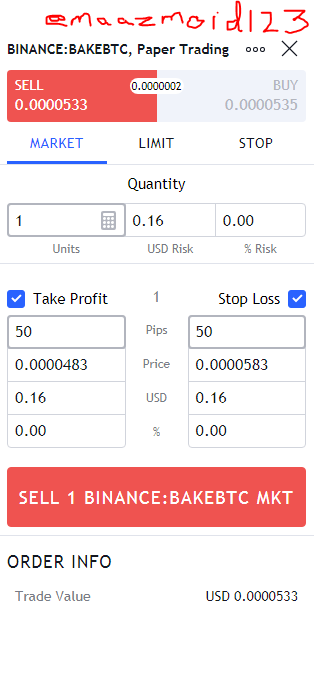
I also have places the Stop profit at 50% and Stop loss at 50 % also.
2. ADA/BTC on 15 minutes Time Frame:
So in this we can see the perfect buying opportunities and as I have taken a chart of CAKE/BTC on 15 minutes Time Frame. And I have take the EMA or Exponential Moving Average at 50 and 100.
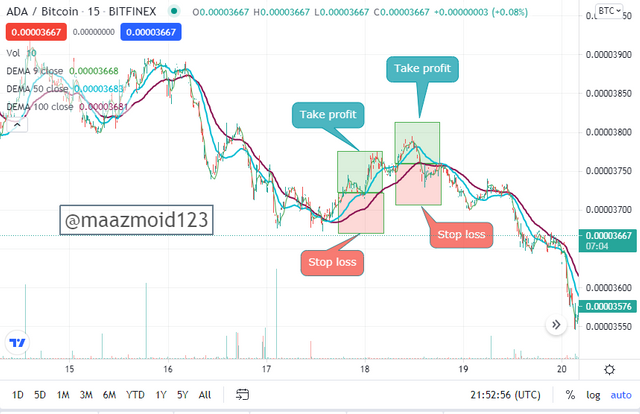
So here I will just wait for the price against the 50 EMA I placed my Buy order.
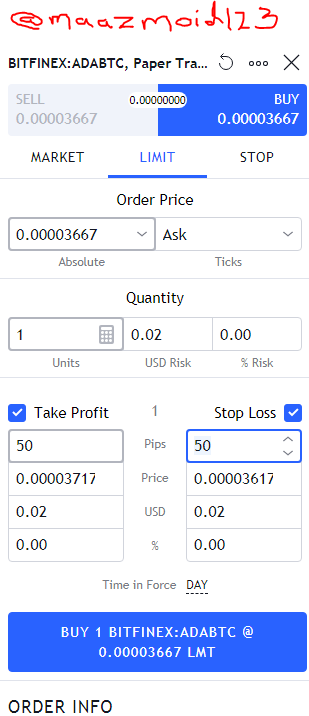
I also have places the Stop profit at 50% and Stop loss at 50 % also.
Conclusion:
So it was a really nice topic to cover and I have learned a lot the EMA were a real deal and I hope I will make some more good profits with this Dynamic support and resistance technique.
Regards,
@maazmoid123
Note: All screenshots are taken by me from tradingview.com
Dear @maazmoid123
Thank you for participating in Steemit Crypto Academy Season 03 and making efforts to complete the homework task. You got 6/10 Grade Points according to the following Scale;
Key Notes:
We appreciate your efforts in Crypto academy and look forward for your next homework tasks.
Regards
@cryptokraze