Steemit Crypto Academy Season 3 Week 4 - Beginner's Course Candlestick Patterns: Homework Post by @lukman1
Hello Professor @reminiscence01, it's always been a pleasure attending your lectures. This particular lecture has helped me a lot as I'm preparing to enter into the trading of crypto assets. I have made a lot of research in order to get more understanding about this particular topic.
I'm grateful for the lecture and guidance.
Below is my homework submission for your assignment.
Question 1: In your own words, explain the psychology behind the formation of the following candlestick patterns.
The bullish engulfing candlestick is one of the technical analysis tool that traders always look out for when making decisions on the prices in a market.
The bullish engulfing candlestick always covers the bearish candlestick completely. This means that, the bullish candlestick is always the second candlestick in this pattern.
The bullish engulfing candlestick always occurs when buyers take control of the market price. This indicates that, sellers where initially the controllers of the market but because of their inability to push price further lower, buyers take that as an advantage and takes control of the market.
When a situation like this happens, it means that buyers are pushing prices upwards.

The bullish engulfing candlestick pattern always occurs in a downtrend, and then pushes price upwards.
When bullish engulfing candlestick pattern occurs, price will usually reverse in the opposite direction. We can read all this using a chart.
The Doji candlestick is not a bullish or bearish candlestick. The Doji candlestick pattern is a tool for technical analysis that most traders considers in making decisions on price in the market.
This candlestick denotes uncertainty about the price in the market by both buyers and sellers.
This makes it difficult for traders to easily determine the direction of the next candlestick to be form.
The Doji candlestick also indicates that buyers are not controlling the market price at the same time sellers are not also in control of the market price.
Unlike the Japanese candlestick, the Doji candlestick has its open and close price exactly the same.
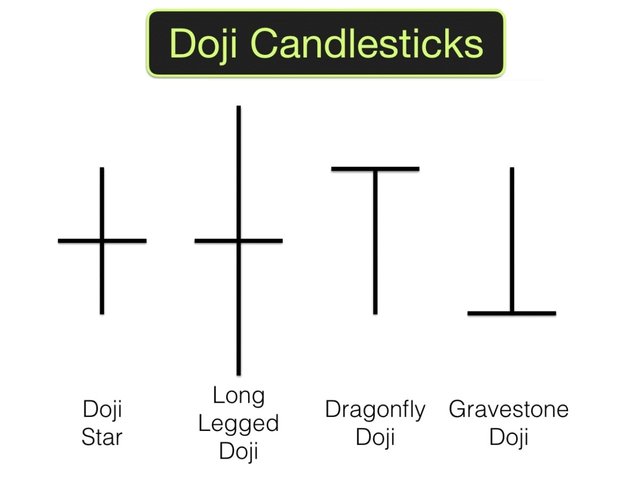
There are different types of Doji candlestick pattern. This are;
- Neutral Doji: This is a type of Doji candlestick whereby the price open and close at the middle of the candlestick.
Just like the Japanese candlestick, the Doji candlestick also has high and low points. The price opening and closing both occurs at the middle of this points.
Unlike other types, the neutral Doji is a small candlestick pattern. In the formation of the neutral Doji candlestick, buying and selling activities is at equilibrium.
- Long-Legged Doji: As the name suggest, the Long-Legged Doji candlestick is a long candlestick pattern.
The price open and close at the center of the day's high and low.
The long-legged candlestick forms when the demand of commodities as well as its Supply are at equilibrium.
- Gravestone Doji: In this type of Doji pattern, the opening and closing of the price occurs at the day's low.
The gravestone Doji pattern usually forms at the bottom of the downtrend.
When the forces of demand and supply are at equilibrium, this patterns forms. The trend's future direction is determine by the prior trend and Doji pattern.
- Dragonfly Doji: In the Dragonfly Doji pattern, the opening and closing of the price occurs at the day's high.
This pattern forms at the highest level of an uptrend. It also forms when the forces of demand and supply are at an equilibrium.
Trends are identified using the Doji patterns.
One important feature of the Dragonfly Doji is that, they are used as entry and exit points. The pattern is used as an exit point when the Doji patterns forms at the resistance level.
The pattern is also used as entry point when the Doji patterns forms at the support level.
Taking the name of this candlestick into consideration, you will get a clue and a picture of how this candlestick looks like.
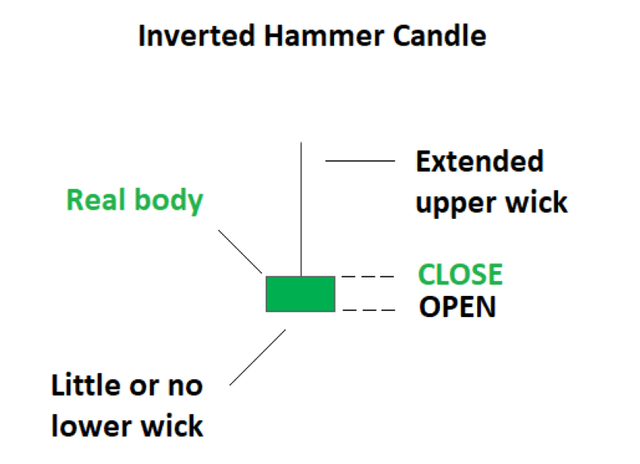
The candlestick looks like a hammer due to its long lower wick and a short body on the candle holder.
There is usually a little or no wick at the top of the candle holder.
The hammer candlestick is a bullish reversal candlestick pattern. The hammer consist of one candle. There is a sign of a potential reversal of price in the market when you see a hammer form in a downtrend.
The long lower wick on the hammer candlestick denotes a period where sellers were initially controlling the market, buyers then find their way to be able to stop the sellers and reverse the control.
Buyers push prices upwards to close near the high point for the day. This results in the body of the candle at the top being short.
After seeing this chart pattern in the market, most traders will wait for the opening price of the next period to be higher than the closing price of the previous period to confirm that the buyer is really in control.
The two other things that traders hope to place more importance on are the lower long wick and the increase in trading volume during the time period when the hammer is formed.
The hammer body is three times shorter than the shadow body.
The hammer candlestick can be form as inverted.
Below is the inverted Hammer candlestick.
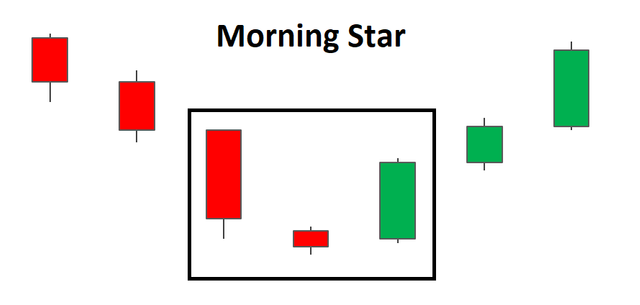
Morningstar is a visual pattern made up of three candles and is interpreted by technical analysts as a bullish signal.
Morningstar is formed after a downtrend, and it marked the beginning of an upward rally.
The morning star candlestick is a sign of a reversal of the previous price trend.
Morning star pattern forms at the downtrend of a chart. In the formation of the pattern, there is a formation of three consecutive candlesticks.
The first candle form in the pattern is always a bearish candle. The second candle is a doji candlestick which is indecisive in nature and the third candle form is always a bullish in nature.
The psychology behind the morning star candlestick pattern comes from the formation of each of the three candles form.
As indicated earlier, the first candle form is a bearish candlestick. This candlestick stick denotes that sellers are controlling the price.
The second candlestick is the indecisive candle (Doji candlestick). The formation of this candle indicates that, sellers are not able to push price further down again. One can even use the size or volume of the candle to determine that. The candle is usually very small and low in volume. It shows how weak the candle is.
The third candle is a very strong bullish candle. The bullish candle engulfs the indecisive Doji candle. When this bullish candle forms, it indicates that buyers have now taken control over the prices in the market.
The evening star candlestick pattern is the vice versa of the morning star candlestick pattern.
The evening star a three candlestick interpreted by technical analysts as a strong bearish signal.
The evening star pattern is formed after an uptrend and it mark the beginning of a downward rally.
The evening star candlestick is a sign of a reversal of the previous price trend.
The evening star pattern forms at the uptrend of a chart. In the formation of the pattern, there is a formation of three consecutive candlesticks.
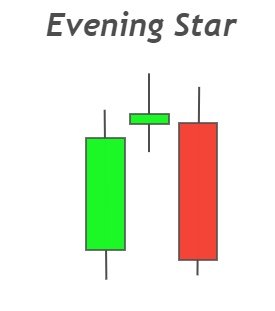
The first candle form in the pattern is always a bullish candle. The second candle is a doji candlestick which is indecisive in nature and the third candle form is always a bearish in nature.
The psychology behind the evening star candlestick pattern comes from the formation of each of the three candles form.
As indicated earlier, the first candle form is a bullish candlestick. This candlestick denotes that buyers are controlling the price thereby pushing upwards.
The second candlestick is the indecisive candle (Doji candlestick). The formation of this candle indicates that, buyers are not able to push price further up again. One can even use the size or volume of the candle to determine that. The candle is usually very small and low in volume.
The third candle is a very strong bearish candle. The bearish candle engulfs the indecisive Doji candle. When this bearish candle forms, it indicates that sellers have now taken control over the prices in the market.
Question 2:Identify these candlestick patterns listed in question one on any cryptocurrency pair chart and explain how price reacted after the formation. (Screenshot your chart for this exercise)
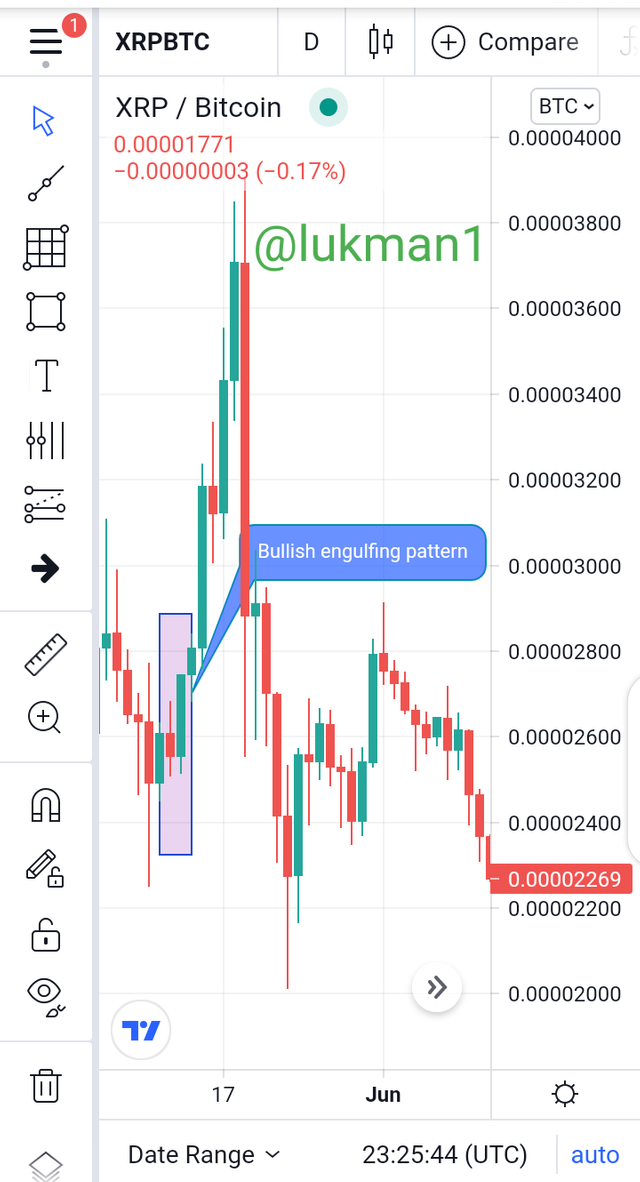
The bullish engulfing candlestick denotes that buyers are in control of prices in the market. The bullish pattern occurs at downtrend pushing the price upwards.
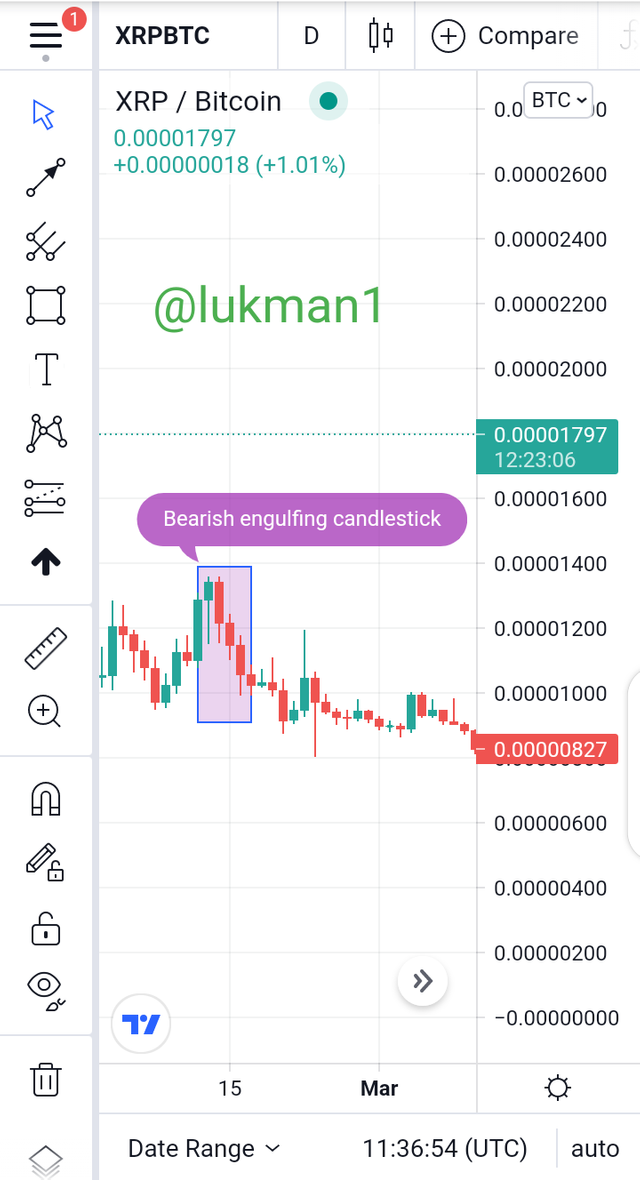
The bearish engulfing candlestick pattern denotes that sellers are in control of prices in the market. The bearish pattern occurs at the uptrend pushing the price downwards.
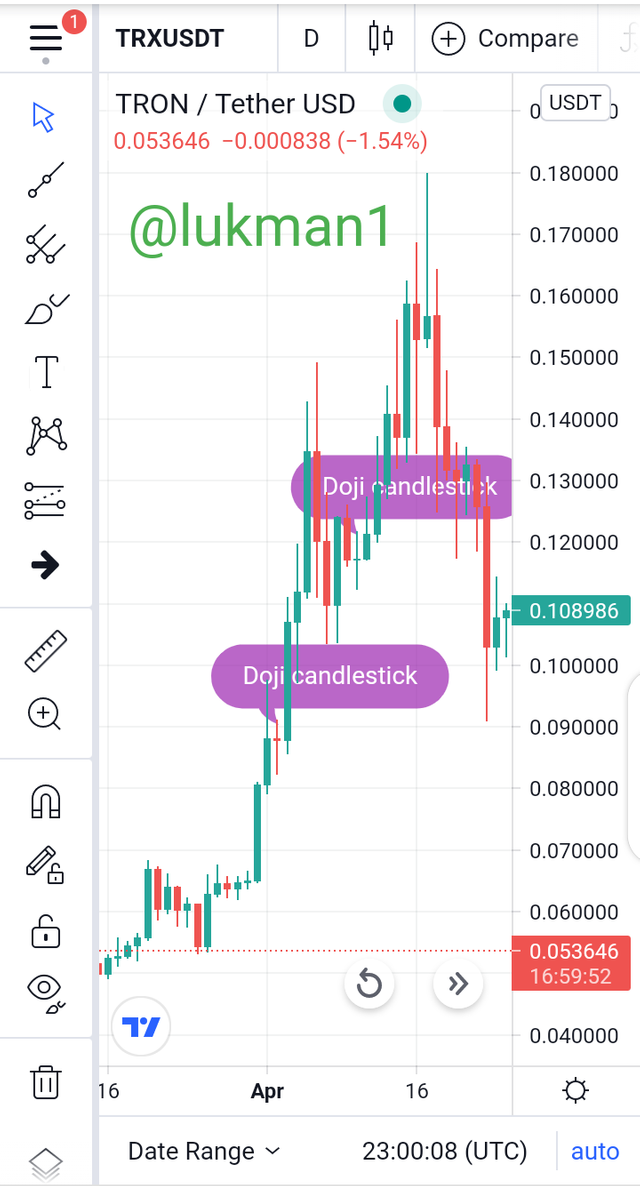
Formation of the Doji candlestick on the charts denotes uncertainty or indecision about price in the market.
The Doji candlestick can occur at any point in the market. It can form at both the uptrend or the downtrend.
The Doji candlestick can also be either a bullish or bearish.
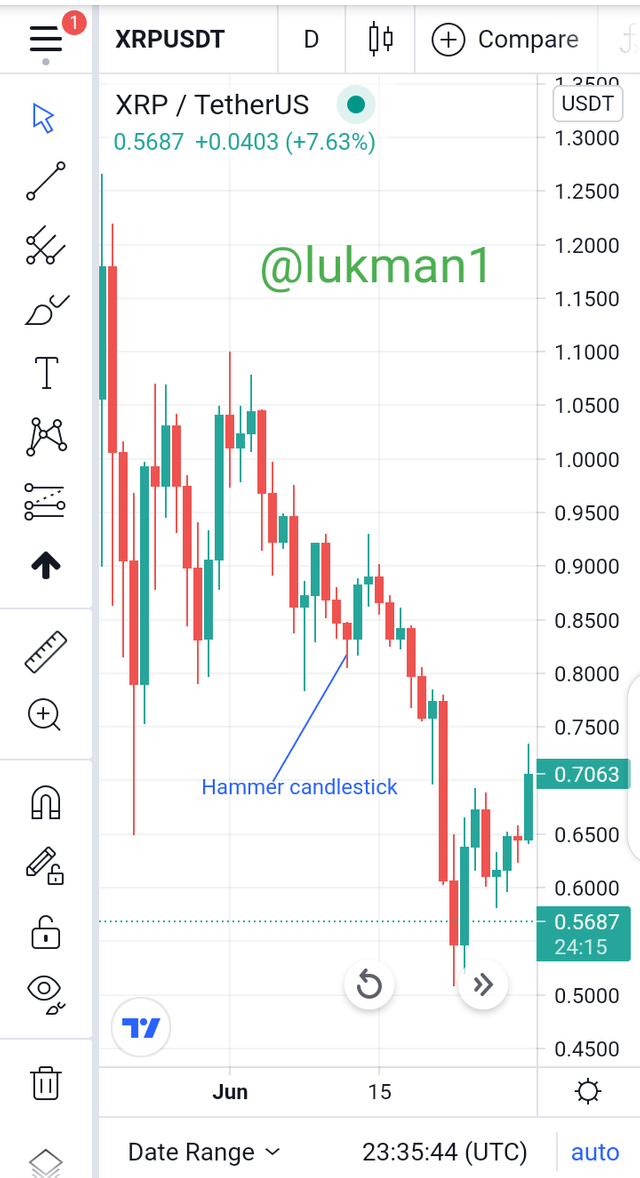
The hammer consist of one candle. There is a sign of a potential reversal of price in the market when you see a hammer form in a downtrend.
The hammer candlestick can be a bullish or a bearish candle.
When the hammer formed is a bullish, there is a potential that buyers are to take control of the market.
When the hammer formed is bearish, there is a potential that sellers are to take control of the market.
The morning star candlestick is a sign of a reversal of the previous price trend and it consist of three candlesticks.
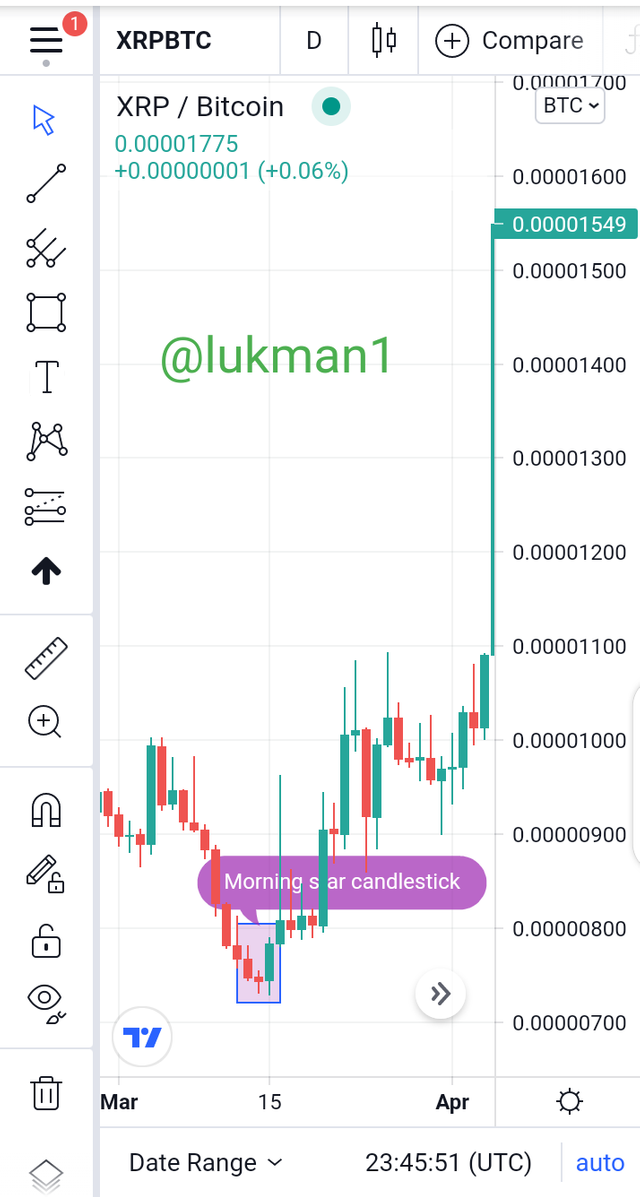
The first candle is a bearish and it indicates that sellers are in control of the market.
The second candle is the Doji candlestick, which signifies indecision about among buyers and sellers.
The third candle is a bullish and it indicates that buyers are in control of price.
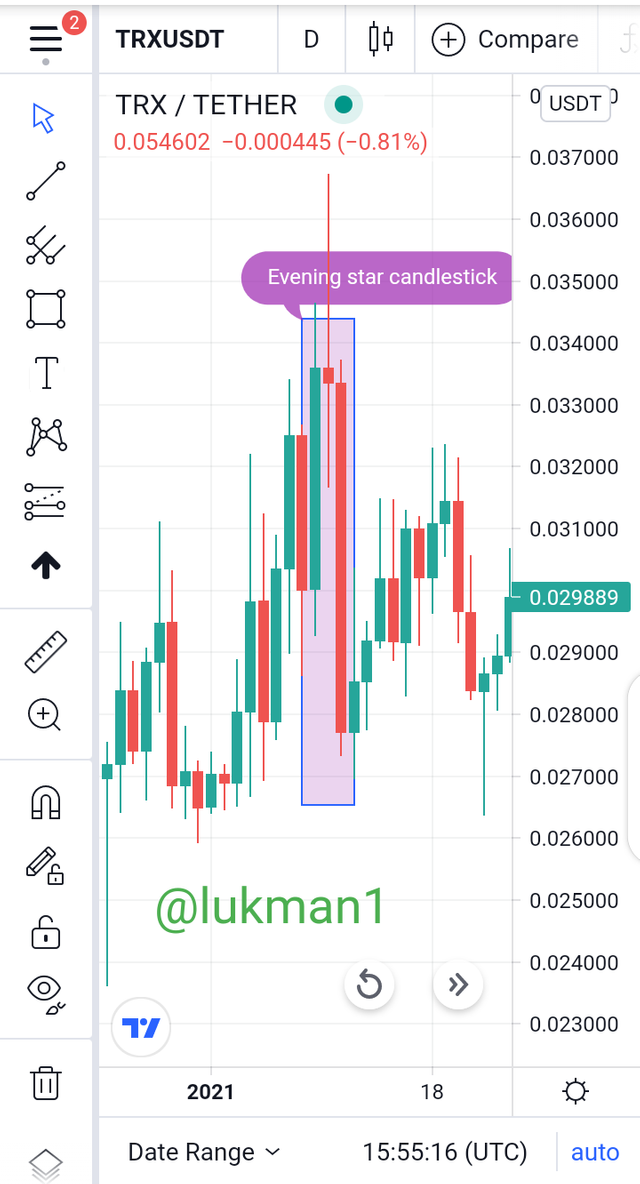
The evening star pattern forms at the uptrend of a chart. In the formation of the pattern, there is a formation of three consecutive candlesticks.
The first candle is a bullish and it indicates that buyers are in control of price.
The second candle is the Doji candlestick, which signifies indecision about among buyers and sellers.
The third candle is a bearish and it indicates that sellers are in control of the market.
Question 3: Using a demo account, open a trade using any of the Candlestick patterns on any cryptocurrency pair. You can use a lower timeframe for this exercise. (Screenshot your chart for this exercise)
The platform I will be using to answer this question is the Meta4 trading platform. This platform provide users with demo accounts to enlighten and guide them about how trading is done.
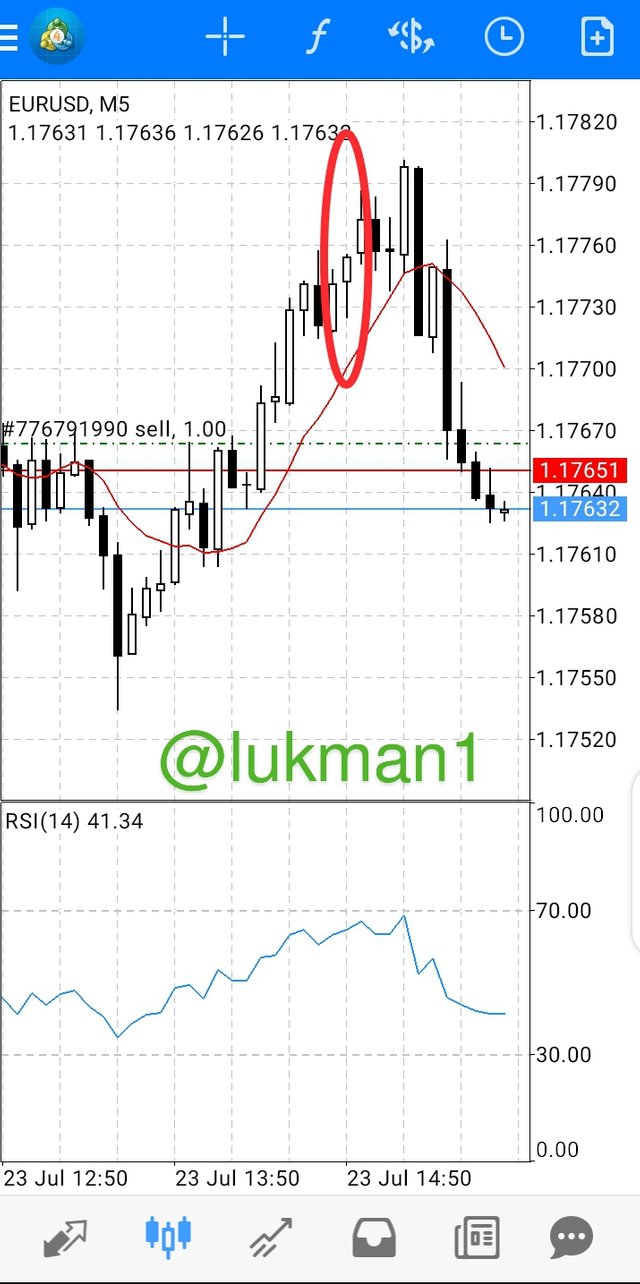
From the above chart, you will realize that I have circled a number of candlesticks. Well, this candlesticks are the bullish candlesticks. This means that, buyers are in control of the market and they control price as well.
So as a trader, I set a time frame of 2minutes for the formation of the next candlestick.
If you observe carefully, you will see the next candlestick formed which is a bearish candlestick signalling that sellers are taking control of prices. As a trader, I will sell at this point because I will be making profit.
I then place a sell order in my demo trading account.

Understanding the formation of candlesticks as well as knowing the psychology behind the formation of each candle is important for traders to analyze the market trends.
It helps the trader to know when to sell and when to buy assets in the markets.
Therefore, it's incumbent on any trader who wishes to make enough profit whiles avoiding loss to learn the formation pattern of the various candlesticks, and the psychology behind the formation of each candlestick.
Hello @lukman1, I’m glad you participated in the 4th Week of the Beginner’s class at the Steemit Crypto Academy. Your grades in this task are as follows:
Observations:
Please remove this image from your work with watermark. Only use copyright free image sources.
Recommendation / Feedback:
You have explained every question in detail. All you have to do is to work on your presentation and writing skills.
Thank you for completing this homework task.
Thank you for the feedback Prof. I will do as you say
Hello @steemcurator02, my homework post has been reviewed and marked by Professor @reminiscence01 but it has not been curated.
This is the link to my homework post:
https://steemit.com/hive-108451/@lukman1/steemit-crypto-academy-season-3-week-4-beginner-s-course-candlestick-patterns-homework-post-by-lukman1
Hoping to get your curation very soon
Pls @lukman I need your help... Have not been able to scan my work pls can I have your WhatsApp number so you can help me with it
No problem.
0504203976