CryptoAcademy Season 3 Week 7| Home work Post for Professor @lenonmc21 |"Analysis and Trading with the indicators "Stochastic Oscillator +" Parabolic Sar "
Hello fellow steemians, it's been another wonderful week and a great pleasure to attend this week's lecture. All thanks goes to the Almighty Allah and also a big thanks goes to Professor @lenonmc21 who took his time and make sure to digest this lecture to our understanding. This lecture was really helpful as I learned a lot from it.
Below is my homework submission post.
Stochastic Oscillator?
The stochastic oscillator is among the technical indicators or tools used by traders and investors when analysing the trend reversal of assets in the market. The stochastic oscillator uses both the support and resistance levels as a momentum indicator.
This indicator was developed in the late 1950s by a man called George Lane. The "stochastic" as a term basically refers to the level of a recent price in connection to its price range over a specific time period. This technique attempts to indicate the turning points of price by relating the closing price of a security to its price span.
The stochastic indicator is used to estimates the momentum of price trends and movements. Momentum is basically the speed rate in price movement in the market. The ideology behind the stochastic oscillator is that the price momentum of the tool usually changes before the price of the tool changes direction. Therefore, this indicator can be used to predict trend changes.
The stochastic oscillator additionally correlates the first recent price to the range for a given period of time . The stochastic oscillator can be calculated using mathematical formulas. This calculation is done by deducting the low for the time period from the recent closing price and then divide by the total.
The stochastic oscillator is very easy to understand and comprehend, it also has high level of accuracy. Stochastics are a favoured technical indicator which makes most investors and analysts to use them in studying and predicting trend reversals in the market. One important use of Stochastics is that, they are used to indicate when a commodity or an asset has moved into an oversold or overbought position.
The Stochastic indicator is always shown as two lines on the graph. Among the two lines, the major line is called the "%K". The %K line is always considered as the stochastic oscillator or indicator. The %K line is shown as a solid line on the chart. The real value of price momentum is exhibited by this line. The %K line is regarded as the fast stochastic line.
There is a formula which is normally used in calculating this line. Below is a screenshot of the formula used in calculating the %K line.
%K line = (CCP - BPM) ÷ (HPM - BPM) × 100
The full meaning of the parameters in the formula above is shown below:
"% K" stands for stochastic line
"CCP" stands for current closing price
"BPM" stands for bottom price marketed
"HPM" stands for highest price marketed
The %D line is always the second line of the stochastic oscillator and this line as compared to %K line, it's not fast. The line is a moving average of the %K line. This line is a discontinous line and it's shown as a dotted line on the chart. Because of it's slow movement as compared to the %K line, the %D line is considered as the slow stochastic indicator.
One of the importance of this line is that it signals the traders whenever a trend reversal is to occur.
As I already indicated that the stochastic indicator is range bound, and this range bound is from 0 to 100. For an oversold condition to occur, the stochastic line, be it the %K or %D falls below a certain level and this level is 20. So whenever the stochastic line falls below 20, an oversold condition has occurred. Traders usually place a buy instrument when they realized the stochastic line falls below 20 and rises above that same 20.
The overbought limit is the direct opposite of the oversold limit. For an overbought condition to occur, the stochastic line must rise above a certain level and this level is 80. So whenever the stochastic line rises above 80, an overbought condition has occurred. Traders usually place a sell instrument when they realized the oscillator rises above 80 and falls below 80.
There are various ways the stochastic indicator can be used in a trade. Some of this ways are:
- Used as trade Signal: The stochastic indicator is also an important tool used in signalling trade in the market. Traders and investors usually use the two stochastic lines(%K and %D line) to enter a trade. It's always advisable that before a trader use this tool to enter a trade, he must be very experience with it's usage. For instance, a buy order may be signalled if it happens that an asset has entered the oversold region and the %K and %D lines crosses each other upward. Also, a sell order may be signalled if it happens the asset enter an overbought region and the %K and %D lines crosses each other.
- To determine trend reversal: The stochastic indicator is mostly used with other indicators to determine a potential trend reversal in the market. An asset can move on a bullish trend or a bearish trend. So when an asset in a bullish trend is to be reverse to a bearish trend, the stochastic oscillator detects this action. The same way applies to when an asset in a bearish trend is to be reverse into a bullish trend. This helps traders to be more cautious about any possible change in the market trend.
The parabolic sar is a technical indicator that was developed by a man called J. Welles Wilder Jr. This same man is the also the creator of the Relative Strength Index(RSI). The parabolic sar is used to ascertain the direction of the price of an asset. This indicator is also used to create awareness as to when the price direction is changing.
The parabolic sar is known by most traders as the "Stop and Reversal system", this means that the acronym "SAR" stands for "Stop And Reversal".
Apart from it being used in determining the direction of the price of an asset, the parabolic sar is also used to determine potential reversals in price of an asset. Another important thing to know about this indicator is that, it uses a tracking method called "SAR," to know desirable entry and exit points in the market.
The parabolic sar indicator is seen as a sequence of dots on a graph. This series of dots are either placed below or above the price bars on a chart. When the dots are below the price bar, it is regarded to be a bullish signal. Contrarily, when the dots are seen above the price bar, it signals that the bears are in control of the market.
Whenever there is a flip in the dots, there is an indication that a potential change in price direction is likely to occur. For instance, if it happens that the dots are above the price, and when the dots flip below the price, it may give a sign that there will be further rise in price.
As the stock price rises, these dots will rise, first slowly, then accelerating and accelerating with the trend. As the trend develops, the SAR starts to move a little faster and the dots quickly catch up in price.
Explain in detail what the price must do for the Parabolic Sar to change from bullish to bearish direction and vice versa.
The parabolic sar is always lower than the price when an asset is in a bullish trend or an uptrend. In this upward trend, the price of the asset keeps rising whilst the parabolic dots keep falling below that price. To change the direction of the parabolic sar from a bullish direction(upward trend) to a bearish direction(downward trend), the price of the asset must touch the parabolic sar. In this case, the upward trend will change its direction into a downward trend.
Also, the parabolic sar is always higher than the price when the asset is in bearish trend or a downtrend. In this downtrend, the price of the asset keeps falling whilst the parabolic dots keeps rising above that price. To change the direction of the parabolic sar from a bearish direction (downward trend) to a bullish direction(upward trend), the price of the asset must touch the parabolic sar upward down. In this case, the downward trend will change its direction into an upward trend.
- Entry and Exit Point: The parabolic sar is also used in detecting the possible entry and exit points of trading orders. For example, if an upward trend(bullish trend) is about to change a direction, you will realize that the price will cross the dots from bottom to top. After seeing the price cross, traders who have been following the upward trend will start to withdraw their assets and exit the orders. Also, it's important for a trader to know that this time is the best point to prepare an entry into the market for a sell order.
- It is used in tracking trends: The parabolic sar is one of the technical tools or indicators that helps in tracking trends faster. This indicator helps to detect the direction an asset price will move within a specific time frame. As I already indicated how this indicator helps in determining the price direction and reversal, which is, a bullish trend is in action when the sequence of dots are below the asset price. And also, a bearish trend is in action when the series of dots are above the asset price.

In order to add the stochastic indicator to the chart, we need to first visit TradingView.
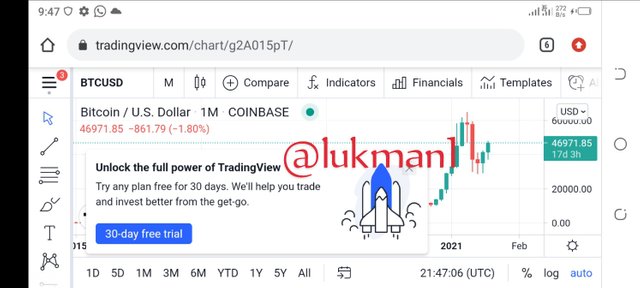
The official page of the TradingView platform will be displayed as shown below.
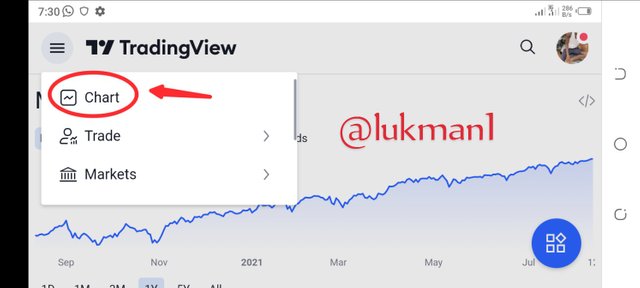
- I will now click on the feature highlighted in the screenshot below.
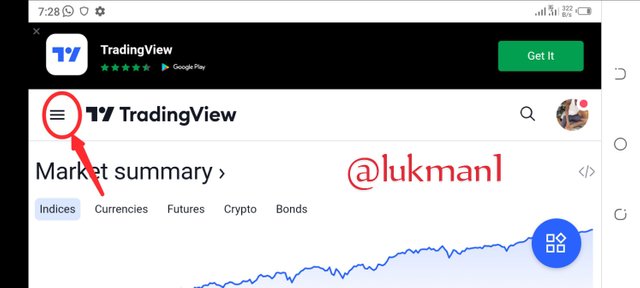
- A number of features will be displayed and you now click on chart.
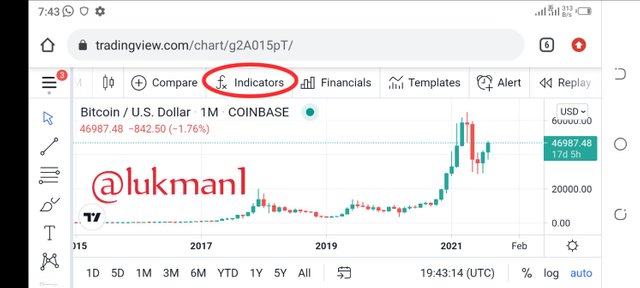
- The chart page will now be displayed, it's in this page that we will be adding the stochastic oscillator.
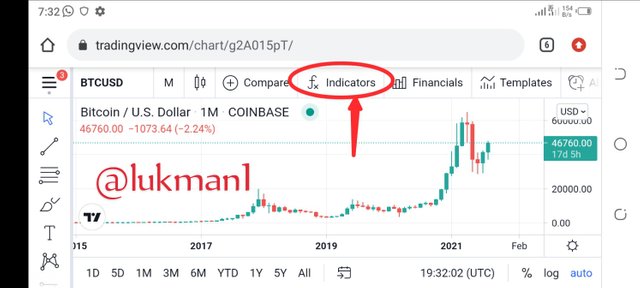
- At the topside of the chart, there is an icon name indicator, click on this indicator icon as shown in the screenshot below.
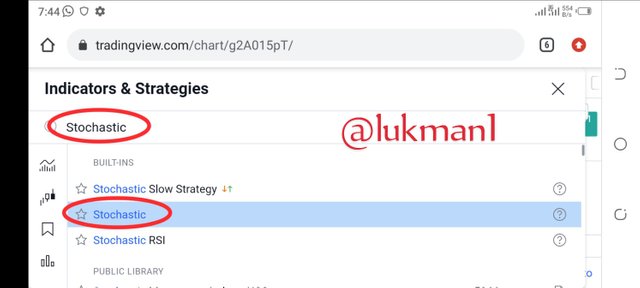
A page appears where you are provided with a search bar, type "Stochastic" in it and then click on the stochastic as shown below in the screenshot.
The stochastic oscillator will now be added to our chart as you can see in below in the screenshot.
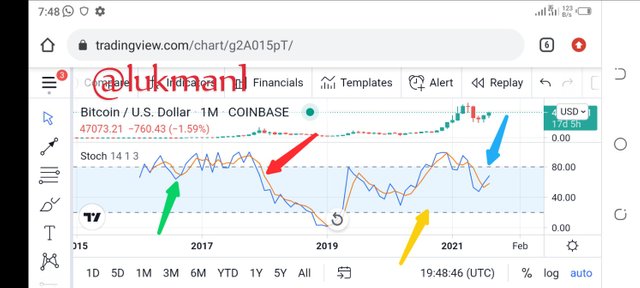
You will realize that, the stochastic oscillator consist of two lines with different colors, well that's the %K and %D lines. The brown line is the %D line(pointed by red arrow) whilst the blue line is the %K line(pointed by Green arrow).
The oscillator also consist of two regions which are the oversold(pointed by yellow arrow) and overbought(pointed by blue arrow) regions in the chart. The oversold zone begins from the point 20 downwards and the overbought zone begins from the point 80 to 100.
- In order to add the parabolic sar indicator to our chart, we have to click on the indicator feature again.
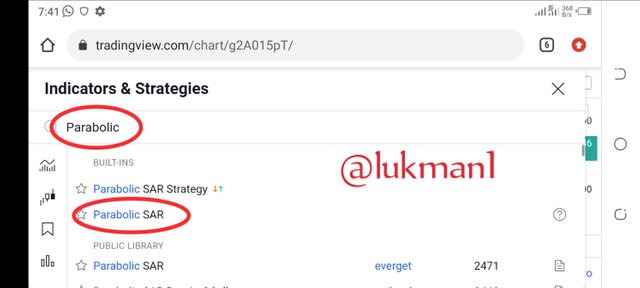
A page appears where you are provided with a search bar, type "parabolic sar" in it and then click on the parabolic sar as shown below in the screenshot.
The parabolic sar will now be added to our chart as we can see it in the chart below.
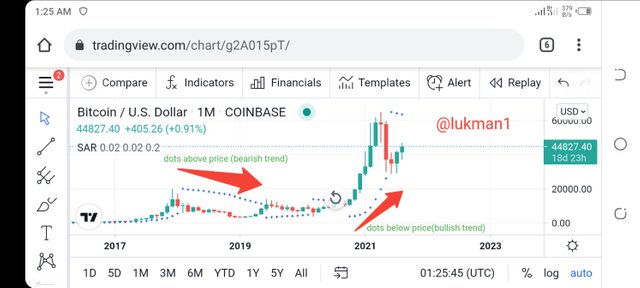
- Looking at the parabolic sar in the chart, you will realize that it consist of dots above and below the price. They all have their various indications and what they stand for. In the chart, the dots below the price indicates a bullish or upward trend whilst the dots above the price indicates bearish or downward trend.
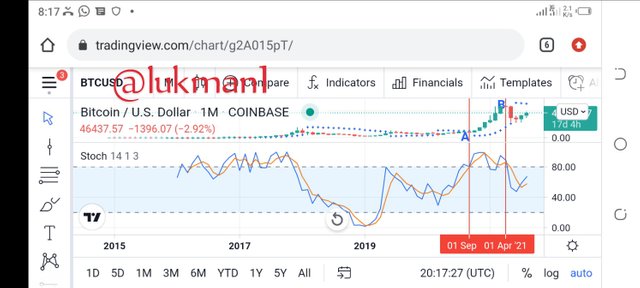
I have added the two indicators(Stochastic oscillator and parabolic sar) together in the chart below.
I will now use this two indicators to stimulate a trade in order to gain profit whilst avoiding loss.
In the screenshot above, the two vertical lines I added indicates the entry and exit points.
A represents the entry point and whilst B represent the exit point.
In the trade. You will realize that, at point A, I enter the trade immediately the parabolic sar begins to gain an uptrend (dots below the price begins to rise upwards).
At point B, the market trend begins to change to a downtrend, so I will take profit, sell my coins and exit the trade in order to avoid loss.
Trading with both the stochastic indicator and parabolic sar allows traders and investors to make the best entry and exit points in order to gain a lot of profit whilst avoiding loss. This indicators helps in alerting traders as when to buy and when to sell their assets also.
I will like to say a big thank you to Professor @lenonmc21 for this wonderful lectures on "Trading with Stochastic oscillator and Parabolic sar indicators". This lecture was very insightful as it helps me to stimulate a trade on my own as well as learning the best entry and exit points in a market.
Thank you.