Crypto Academy Season 3 Week 2 - Homework Post for @reminiscence01 || Beginner's Course: Introduction to Charts || by @lukman1
Hello fellow steemians, it's another wonderful week and I'm grateful to take part in Prof @reminiscence01 class. In fact, this class is one of the most exciting class I have attended so far in this season. Because I'm more interested in charts, I was compelled to make further research about this topic and I must testify to the fact that I have really learned a lot.
Below is my submission for the homework post of your lecture Prof.
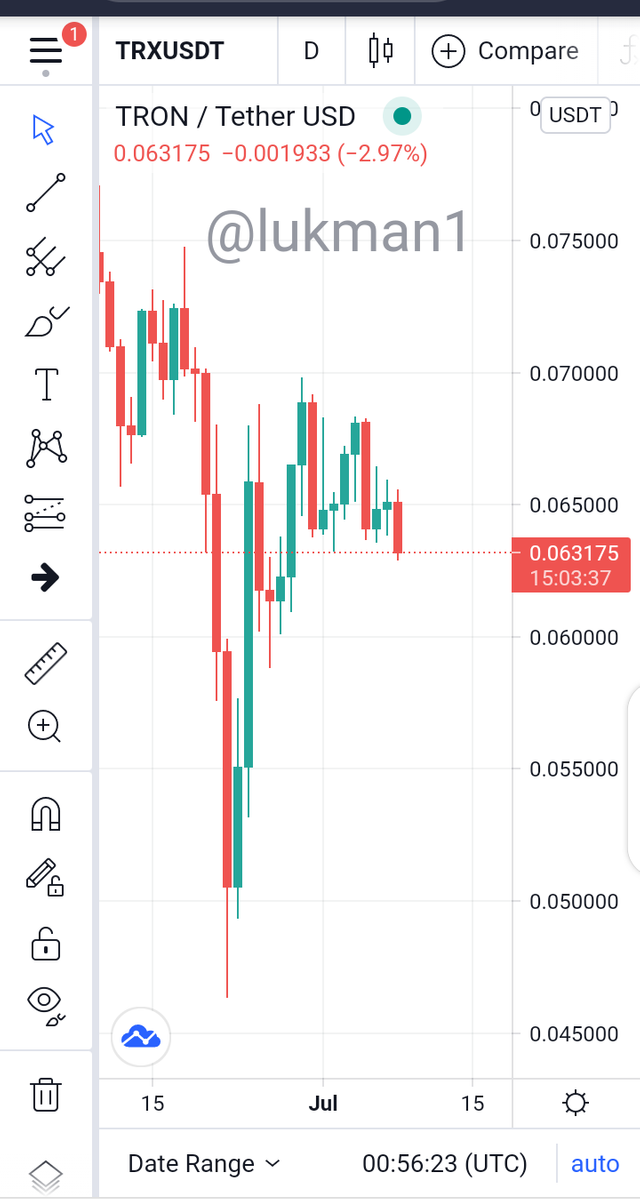
- Explain the Japanese Candlestick Chart? (Chart screenshot required)
The candlestick chart originated in Japan more than 100 years before the development of the histogram. The Japanese candlestick chart was discovered by a Japanese man in the year 1700s.
Candlesticks are used to show the emotions or feelings of most traders. The candle shows this feelings by using different colours to usually indicate the size of the price changes.
Traders use candlestick charts to make decisions on trading based on constant occurring patterns that always helps traders to predict the short-term direction of prices.
The Japanese candlestick has four basic parts or components. It's advisable for each and every trader to try as much as possible to know what each component of the candlestick stands for.
Just like how other normal charts are used to show markets prices and movements their using unique parts, the same applies to candlestick.
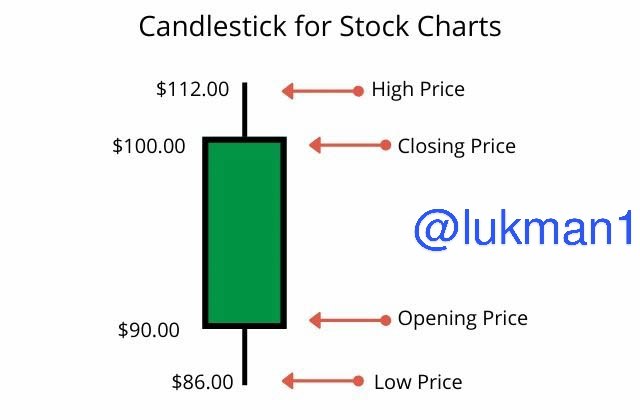
As I already stated above, the candlestick has four main components which are: the market's open, high, low and close price for a day.
The candlestick has a very wide part, which is called the real body. The function of this real body is that, it represents the price range from the opening and closing of the day's transaction.
You might observe that the real body is empty sometimes or filled with black colour. Well, it all have its meaning.
When the real body is filled with black, it basically means that the close was lower than the open. When the close is higher than the open, it means that the real body is empty.
The candlestick is mostly shaded with different colours when reading them in charts. A downcandle is mostly shaded red and upcandles are mostly shaded green.
One thing about this candle colours is that, a trader can decide to change these colours to his preferred colours in his or her trading platform.
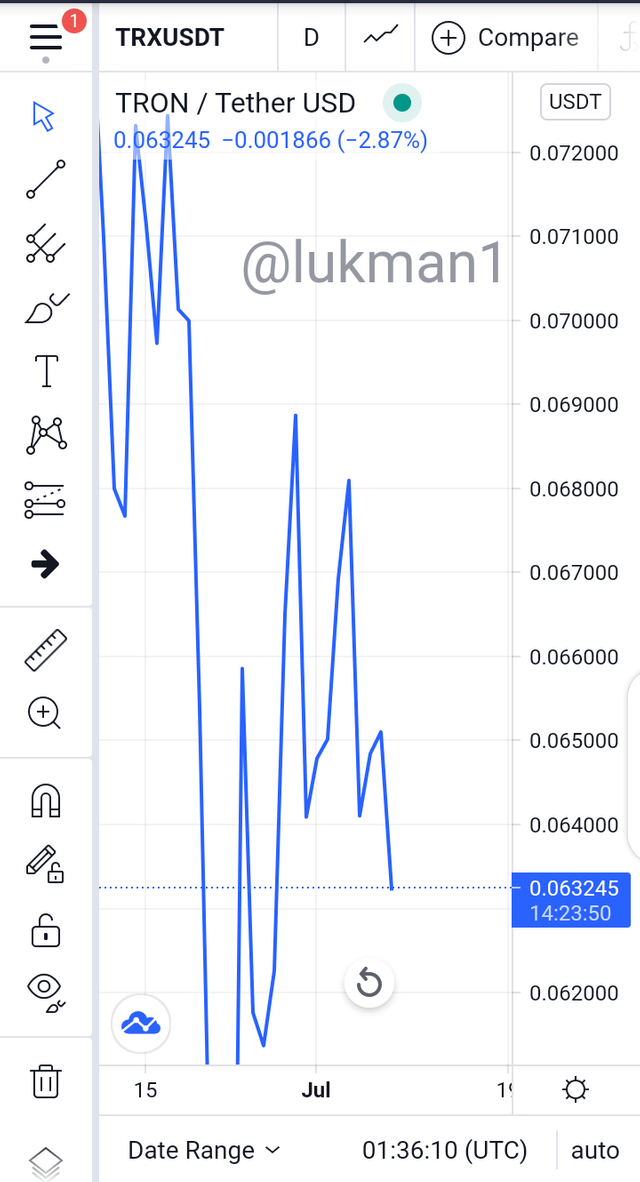
- Describe any other two types of charts? (Screenshot required)
The line chart is also an example of a chart just like the bar chart and candlestick chart.
The line chart also give us information but this information is represented as a series of data points. This series of data points are connected by a straight line.
Another name given to the data points is markers.
This type of charts is very common in many Fields as it is a basic type of chart.
The line chart is generally used to study the trend and movement of data over a period of time.
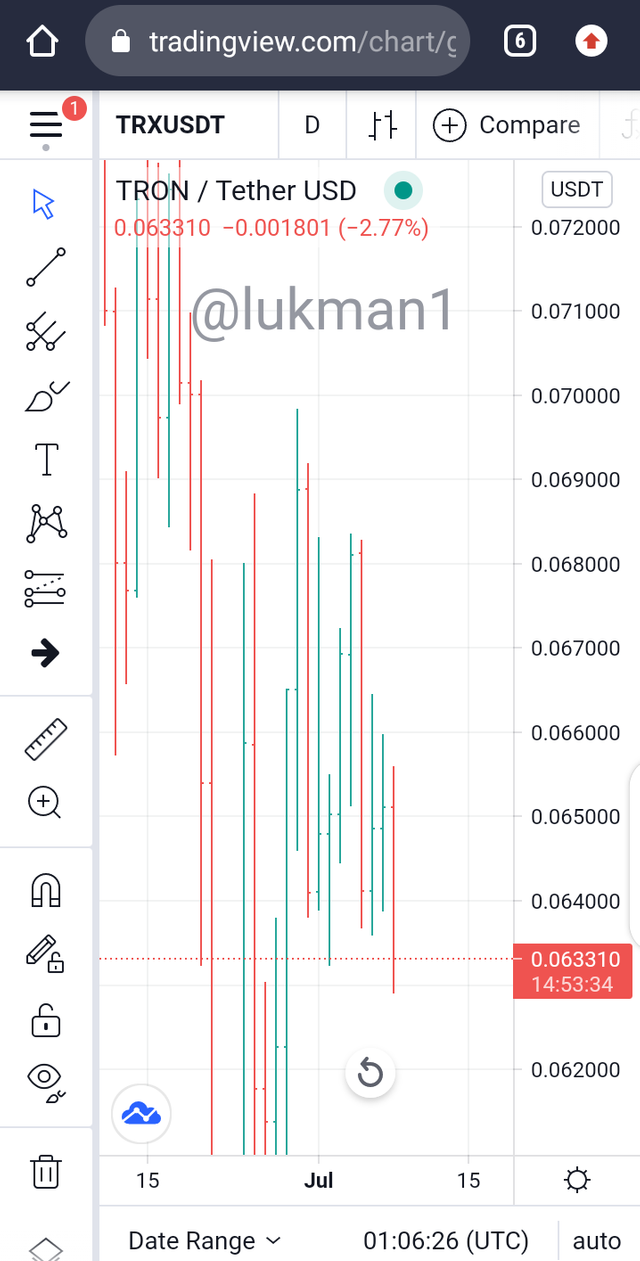
A bar chart also presents data which can be read and analyze.
But for the bar chart, data or information is represented in the form of bars on the graph.
The bars are normally rectangular in shape, with each bar having its height or length which is proportional to the values they represent.
- In your own words, explain why the Japanese Candlestick chart is mostly used by traders.
Comparing the candlestick charts to other charts, one will get to realize that the candlestick chart is very easy to analyse, understand or comprehend.
A trader can determine the strength and weakness of a commodity in a market by just looking at the colours of the candlestick.
A trader can also determine the price of a good or commodity looking at the length of the candlestick as well, unlike other charts.
One thing I have also learned about the Japanese candlestick is that, it gives more accurate and detailed information about movements of price(either increasing or decreasing). But the bar chart does not if compared to the candlesticks.
- Describe a bullish candle and a bearish candle identifying its anatomy? (Screenshot is required)
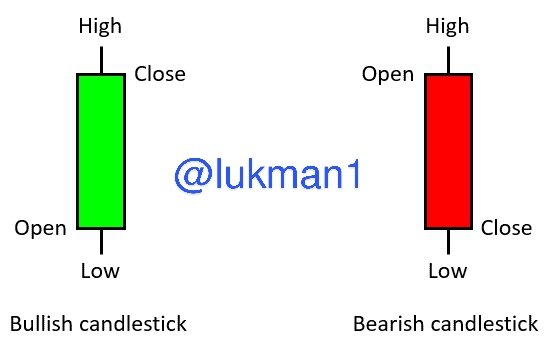
Looking at the image above, you will realize that the part of the candle label open is under or below the part labelled part close. This phenomenon indicates the rising of goods.
The bullish candle also alerts traders that there is going to an increase in prices of goods after there have been a decrease in prices.
For bullish candles, the color of the candle can also be used to determine which candle is bullied. Mostly, the bullish candle is filled with a default green colour. But the trader can change the colour of candles to his prefer colour.
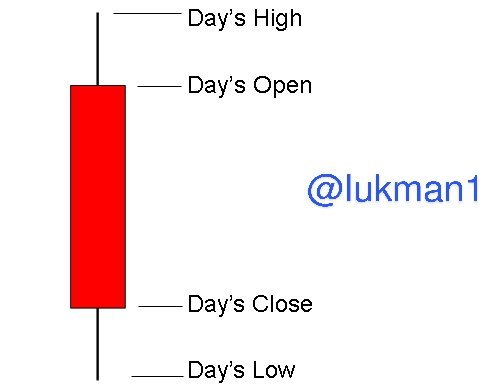
The bearish candlestick is the opposite of the bullish candlestick. Studying the candle image above, you will realize that the close part is below the open.
This also alerts the traders that there might be an increase of prices of goods. Just like the bullish candle, one can as well use the colour of the candle on a chart to identify the bearish candle.
The bearish candle is normally filled with red colour. As we all know red signifies danger, it means something weard is going to happen to the market which is a reduction in price.
Charts are very important to both traders and investors. Charts allow traders to carryout analysis on the current status of our commodities. Charts are also essential in the prediction on whether there is going to be an increment or decrease in the prices of goods.
The Japanese candlestick chart is one of the most reliable and easy to use tool. Its analysis is also not tedious as well.
The bullish and bearish candlestick both play a major role in the analysis of our markets situations. This kind of analysis is known as technical analysis.
I have learned a lot from you Prof @reminiscence01 and I will like to use this medium to thank you for this wonderful lectures.
Thank you.
Hello @lukman1 , I’m glad you participated in the 2nd week of the Beginner’s class at the Steemit Crypto Academy. Your grades in this task are as follows:
Observation
This is not true. When the closing price in higher than the opening price, this mean an improvement in the price of the asset, thus formation of a bullish candle.
Recommendation / Feedback:
There were confusions in your work. I suggest you spend quality time to perform your homework task and also proof your work before submission.
Thank you for participating in tjis homework task.
Thank you for the assessment Prof. I will take into consideration all the mistakes you highlighted and I will make sure to improve on them
Hello @steemcurator02, my homework post have been reviewed and mark by Prof @remininscence01 but it's not yet curated.
I will be hoping to see your curation very soon. This is the link to my homework post.
https://steemit.com/hive-108451/@lukman1/crypto-academy-season-3-week-2-homework-post-for-reminiscence01-or-or-beginner-s-course-introduction-to-charts-or-or-by-lukman1
Thank you
Hello @steemcurator02, my assignment have been reviewed and mark but it has not been curated.
This is the link to my homework post.
https://steemit.com/hive-108451/@lukman1/crypto-academy-season-3-week-2-homework-post-for-reminiscence01-or-or-beginner-s-course-introduction-to-charts-or-or-by-lukman1
I'm hoping to receive your curation very soon.