In-depth Study of Market Maker Concept - Steemit Crypto Academy | S4W6 | Homework Post for @reddileep by @lovveday
INTRODUCTION
Hello everyone and welcome to the 6th week of the crypto Academy. It have been have been so educative. Those paid online classes cannot deliver the way our professors do. Today, i will be writing based d on my understanding of the class. i hope you enjoy the post.

1. Define The Concept Of Market Making In Your Own Words.
The value of cryptocurrencies fluctuates on a daily basis. They're on a steady rise or declining trajectory. To put it in another way, cryptocurrency will never be steady. The price of these coins rises and falls due to our actions as humans.
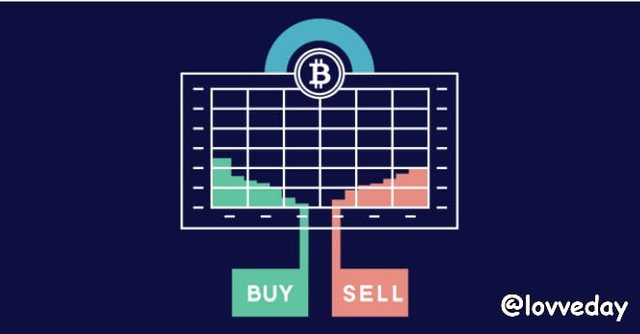
Many purchase and sell orders can be seen in any coin's order book nowadays. These orders are usually within a set budget.
Market makers are those who open buy and sell orders for the coin in the market at regular intervals and ensure that liquidity is given by these transactions.
Market makers ensure the liquidity of an asset on an exchange while profiting from the difference between the bid and ask price. These market makers buy and sell assets to investors and ensure that the market is liquid, in the sense that the seller does not have to go out and find a buyer; instead, the market makers handle these details and keep the exchange moving.
What is the significance of market makers?
Market makers are critical because they help to bridge the gap between sellers and buyers by ensuring that investments are validated and approved on time.
When you wish to sell crypto in your hand, for example, there must be a buyer willing to buy it at the same price in order for the deal to take place. To put it another way, the market must be fluid. Here's where market makers come into play. Buy and sell orders are opened by market makers in a specific price range. They ensure the market's liquidity in this way. These individuals profit from the bid-ask spread.
2. Explain The Psychology Behind Market Maker. (Screenshot Required)
Market makers' principal goal is to provide liquidity to guarantee that the market runs smoothly. They function as wholesalers in the financial market, ensuring that huge quantities of assets are available in order for trades to be conducted quickly.
Market makers ensure that assets are available to both buyers and sellers. They can establish their prices based on the asset's demand and supply. Market makers quote their prices, which are shown in the order book, ensuring that the bid prices are slightly lower than the ask prices, as shown in the image below.
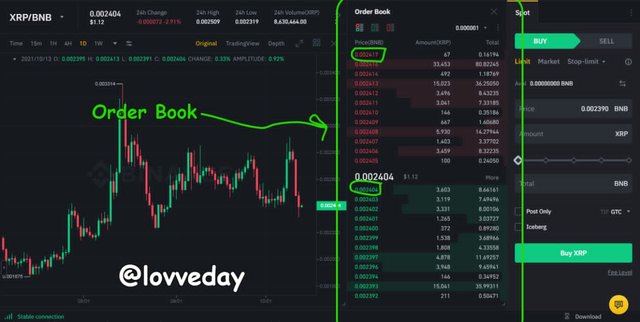
Most traders are able to enter a market due to the availability of an asset, while others can decide to sell an asset after purchasing it due to a fall in bid prices. The difference between the bid and ask price allows market makers to profit.
For instance say the bid price for an asset is $5, this means that the amount the market maker paid for it is actually $5, and so you are most likely to see an ask price that is slightly higher than the bid price, say $5.07, this means that the market maker has actually benefited $0.07 from the trade. Because market makers take the risk, this profit serves as compensation to them. They keep the market moving whether the price of the asset they own lowers or not. In a nutshell, market makers' motivation is to provide liquidity and speedy trade execution while attempting to lower asset prices.
3. Explain The Benefits Of Market Maker Concept?
SUPPLY LIQUIDITY:
The most important benefit of market makers, as I've emphasized several times in this article, is that they provide liquidity to the market.
Liquidity improves as they create buyers and sellers in specific price ranges in the market.
Market makers' sell and buy orders help to reduce the spread in the order book, resulting in a more efficient bid-ask spread.
REDUCE SLIPPAGE:
Slippage reduces as the Bid-Ask Spread lowers.
REDUCED VOLATILITY:
Because they supply a certain amount of resource flow to the market, market makers lessen price volatility.
They cause the price of the cryptocurrency in which they invest to rise. The price of the coin is altered upwards by increasing both the Ask and Bid prices at the same time.
As prices rise, the number of people who invest will rise as well.
Small investors gain greatly from the presence of market markers since they are given a little spread, allowing them to make good market entries and exits. As previously said, market makers save small investors a lot of money.
4. Explain The Disadvantages Of Market Maker Concept?
1. Different market makers may operate within an asset, resulting in a conflict of interest that will be extremely destructive to the investor's asset.
2. There is a tremendous demand for liquidity in order to keep the spread stable, yet most of the time investors are provided with liquidity that is only available for a limited time. As a result of this incident, investors suffer significant losses.
3. By boosting prices needlessly, market makers might produce false signals. A novice investor who sees the price of a coin rise may believe that it will rise in value and buy it at a high price. When the market makers restore normalcy, unskilled investors sell the coins at low prices, resulting in a loss.
5. Explain Any Two Indicators That Are Used In The Market Maker Concept And Explore Them Through Charts. (Screenshot Required)
THE MOVING AVERAGE INDICATOR:
Traders prefer to apply the moving average indicator because it is simple to read and interpret. Aside from physically looking at the trend movement when performing chart analysis on any pair of trades, looking at the indicator is another technique to fully comprehend the trend. When the MA line appears twice on the chart, the indicator is easier to read and comprehend. After that, the length is adjusted so that the indicator's movement can be seen clearly. When one of the MA lines crosses the other, the indicator now displays a signal of a change in trend. The golden cross is the focal point of this intersection.
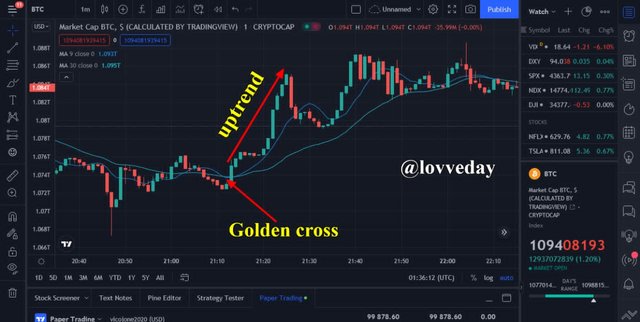
When the MA lines are seen below the price of the asset it indicates an uptrend movement as shown in the image above.
But when the MA lines are seen above the price of the asset it indicates a downtrend movement as shown in the image below.
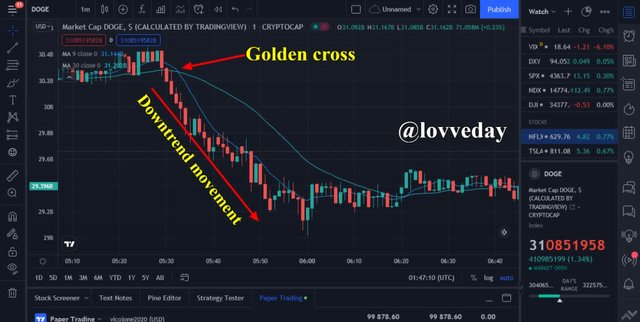
When the MA indicator records a downtrend, traders in the market make their sells, just like with other indicators. As a result, this period represents a period of asset distribution, as indicated by the indicator. During this phase, traders usually disperse their assets.
Similarly, when the MA indicator shows an uptrend, it is a signal for traders to buy. As a result, this is a time of asset accumulation, as indicated by the indicator. During this phase, traders are more likely to accumulate their assets.
HOW MARKET MAKERS EXPLORE THE INDICATOR
As a result, market makers use fake signals to extract money from small traders. For example, if a golden cross exists, and the law predicts that the trend will reverse, but instead of the trend reversing, the trend will breakout or possibly make a small shift, and another golden cross will form, leading traders astray. Retail traders may lose their assets at this time because the market makers may have influenced the analysis performed before performing the trade.
THE RELATIVE STRENGHT INDEX
The Relative Strength Index (RSI) is a technical indicator used in the analysis of cryptocurrency. This indicator is used to illustrate the current and historical strength of an asset on a chart based on the asset's closing price for a specific time period. Traders may simply determine the peak of recent price moves using this indicator to assess an asset's overbought and oversold regions.
A bullish trend is indicated by a trade that varies between 50 and 100, whereas a bearish trend is indicated by numbers between 0 and 50. When the value is 50, it is said to be neutral, indicating that the bullish and bearish trends are in equilibrium. Using this indicator alone during a transaction may cause a trader to initiate or stop a trade too soon, resulting in loss or poor profit.
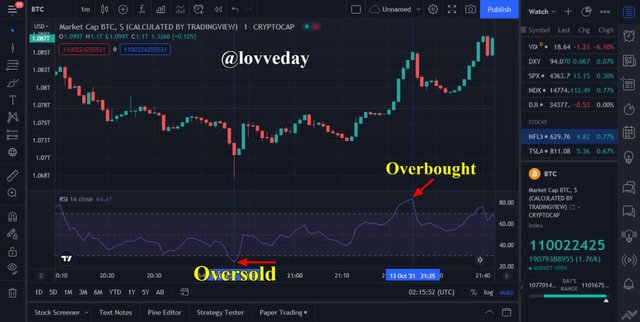
The price trend and the RSI indicator are partially linked in that when the price trend is downward, the RSI indicator reaches the oversold region, and it is at this time that investors tend to buy as many assets as possible in preparation of a likely price reversal to the positive end.
The RSI is captured at the oversold level in the image above, which is also reflected as a downtrend on the chart and hence a favorable entry point for traders. It wasn't long until you observed a tiny upward movement, as you can see.
When the price begins to trend upwards, the RSI follows suit by entering the overbought zone, implying that investors are more likely to sell their assets in expectation of a shift in the market's trend toward the bearish end.
As can also be seen in the image above, the RSI is in the overbought region which is replicated by an uptrend in the price chart, indicating an exit point in the market as the bearish move is about to begin, and as can be seen in the image, this downward move didn't take long to begin. As a result, investors now rely on the RSI indicator to make trading decisions that are likely to suit their trading methods.
HOW MARKET MAKERS EXPLORE THE INDICATOR
Market makers often use this indication to maximize profit by generating a sell signal so that traders can place the trade, then instantly changing the signal to a buy signal once the transaction trade has been entered. Because this indication is based on price, traders may be tempted to make rash decisions while utilizing it, resulting in a loss, while market makers earn more profits.
CONCLUSION
Market makers, much like in the financial markets, are crucial in crypto markets. Both positive and bad features can be found. While these individuals maintain market liquidity, there remains the potential for market manipulation. When it comes to investment, little investors like us must think about both scenarios.
Thanks for reading through
Note: All charts were taken from source
Cc: @reddileep
https://steemit.com/hive-172186/@adil69/pcj9n-achievement-6-task-by-adil69-understanding-curation-and-community
Please verify my achievement @lovveday
Discord Link send me i want to say something @ lovveday
https://steemit.com/hive-172186/@dani303/2erv3u-achievement-2-the-basic-security-or-or-by-dani303
Please verify sir
hi sir @lovveday
verify my post
https://steemit.com/hive-172186/@imran333/uw86m-achievement-2-imran333-task-basic-security-on-steem