[ Crypto Trading with Moving Average ]-Steemit Crypto Academy | S6W2 | Homework Post for @shemul21
QUESTIONS
•Explain Your Understanding of Moving Average.
•What Are The Different Types of Moving Average? Differentiate Between Them.
•Identify Entry and Exit Points Using Moving Average. (Demonstrate with Screenshots)
•What do you understand by Crossover? Explain in Your Own Words.
•Explain The Limitations of Moving Average.
•Conclusion.
Explain Your Understanding of Moving Average.
Moving average is an indicator used in trading securities all over the world. The Moving average can be use for technical analysis as it can calculate and identify market price. It is worth mentioning that the moving average is a productive indicator.
The moving average helps to smooth out price noise, provide trade signals, peak trends and spot trends reversals by constantly establishing updated average price
It is understood that the moving average operates with past market price to calculate the averages, so short term investors will use a shorter average length that is sensitive to a change in price, it does not lag. But long term investors will use a larger average period and it is not sensitive to price change. Therefore it lags.

What Are The Different Types of Moving Average? Differentiate Between Them.
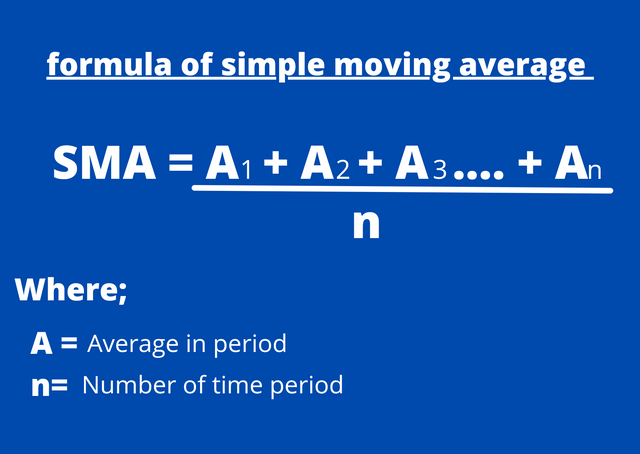
Simple Moving Average (SMA)
Like the name goes SIMPLE, it's the simplest type of moving average. It's calculation involves taking the arithmetic mean of some set of value(prices) over a specific time frame. It just like your normal mathematics where you add up some set of numbers and divide by the number of elements that was being added
Formula:
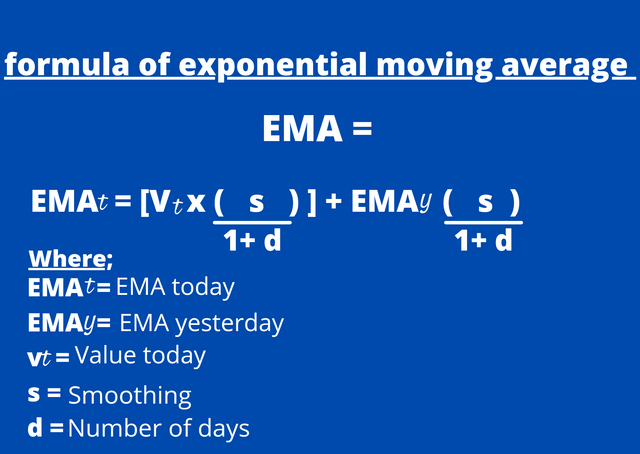
Exponential Moving Average (EMA)
The SMA and EMA are quite similar because they both deal with price values. But The exponential moving average gives More weight to current prices just to make it more responsive to new Information. Short term traders often use this indicator because of how it reacts to price fluctuations, but the best is to combine both the SMA and EMA for better decision making.
Formula:
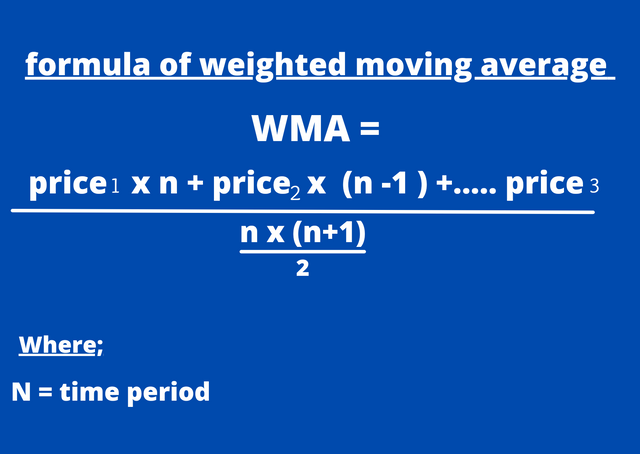
Weighted moving average (WMA)
The weighted moving average put more weight on recent data and less on past data. Also, weighted moving average is used by traders to generate trade signals I.e buy and sell signals.
Formula:
Difference between the three types of moving average SMA, EMA, WMA
| SMA | EMA | WMA |
|---|---|---|
| Average price data is calculated over a specific time frame | In calculations, it give preference to current trend and data | it gives preference to the most recent price data before average is calculated |
| For long term trade, the SMA is very effective | for short term trade, the EMA is effective | the WMA is effective for both short and long term trade. Maybe more effective to short term trade |
| It a slow or lagging indicator as it is used for long term trade | EMA is faster than the SMA as it concentrate on current price data | WMA is lags than EMA but faster than SMA as it givetows more weight on current price data |
Identify Entry and Exit Points Using Moving Average. (Demonstrate with Screenshots)
To identify entry and exit point is a part of the technical analysis we have to be good at. As we already know what the moving average and it's types we can apply them in a chart and find out trade signals (entry and exit points).
Combining the three type of moving average indicator, I will show how to determine a entry point and an exit point
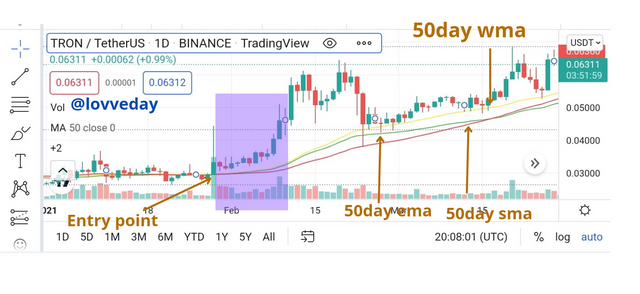
From the image above you can see that I used a 50 day SMA and a 50day EMA and a 50 day WMA indicators to determine the entry point of our trade. In the Image, I have marked the place where all indicators went below the price, which indicates a bullish move in price data. So I will take an entry point from there.
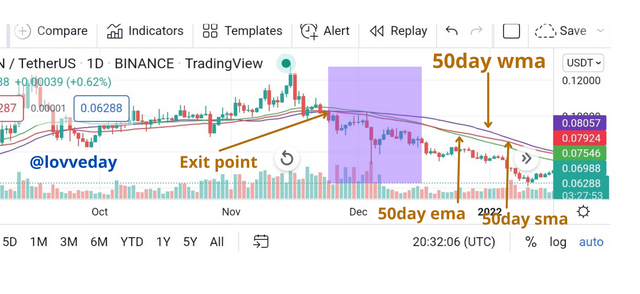
And from the image above where I still used the same 50day SMA, 50 day EMA, and 50 day WMA indicator to determine the exit point our trade. In the image, I have marked the place where all indicators went above the price which indicates a bearish move in price data. So I will take an exit point from there.
Entry point using SMA and EMA
The SMA and EMA indicator can be combined together to get entry and exit point easily as we already know, the SMA focus on long term data while the EMA focuses on short term price data
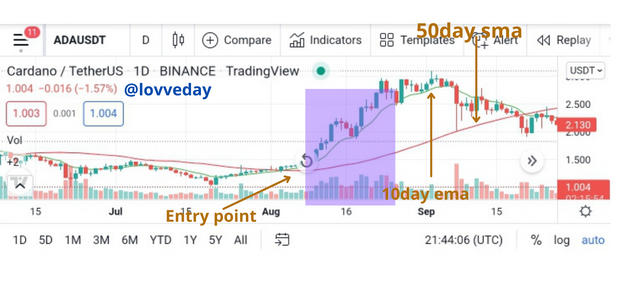
According to the image above, I have used a 50 day SMA and 10 day EMA in my trade chart. Where you see that both the indicators are below the price trend, that's where we take our entry point
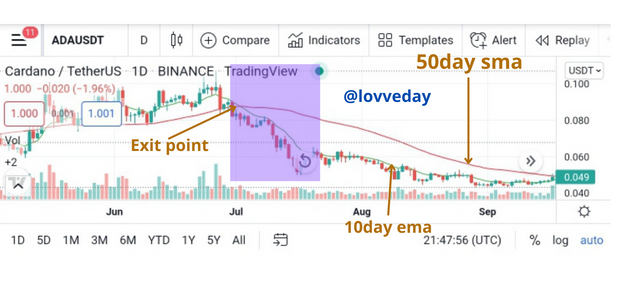
Exit point using SMA and EMA
From the image below, I have also used a 50day SMA and 10 day EMA in my trade chart. Where you see that both the indicators are above the price trend is where we take our exit point
What do you understand by Crossover? Explain in Your Own Words.
Cross over in other words moving average crossover. When you combine the same type of moving average indicator on a trading chart instead of the conventional one is referred to as crossover. An example of crossover is to combine a 60 day EMA and a 200 day EMA. The 60 day EMA tends to react to price more quickly as it is the faster moving average indicator in this trading chart while the 200day EMA is the lagging indicator as it needs more data point to calculate it's average.
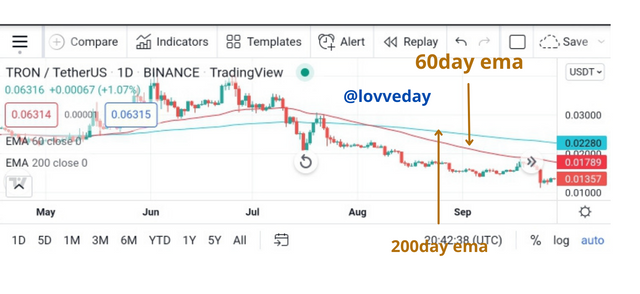
The image above tries to explain the example I gave earlier the line that is closer to the candlestick is the 60 day EMA, while the line that is further from the candle stick is the 200 day EMA.
There are some key point that you need to know about moving average crossover strategy.
• When the shorter period EMA climbed above the longer period EMA, we can make it our entry position.
• But when the longer period EMA comes above the shorter period EMA, when should make an exit or sell signal
With what i just said am going to make an example,
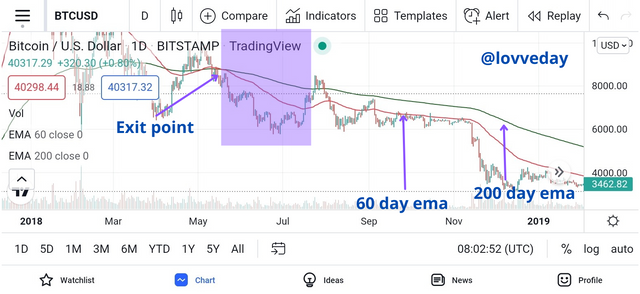
In the image below, i used a 60 day EMA and a 200 day EMA, When the 200 day ema climbs above the 60 day ema and they are both above the price trend, it a point of exit signal
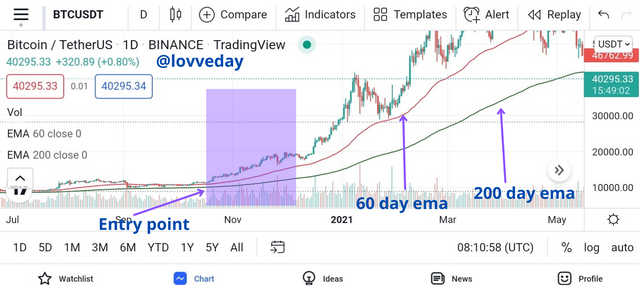
From the image below, you can see i also used a 60 day EMA and a 200 day EMA, when the 60 day ema is above the 200 day ema, and they are botb below the price trend, it can be used as a entry point.
Explain The Limitations of Moving Average.
Moving average have numerous benefits, but in all the package comes with a limitations, which are;
• An individual must depend on his own instinct with extreme caution when choosing a time period as there is no guildlines.
• Traders are not alerted swiftly to a change in trend direction with this indicator as it is considered a lagging indicator
• Moving average is problematic as it spreads out over any period of time. What happens to be an uptrend with a 50 day ma might be a down trend in a 200 day ma and this make trading risky
• moving average eliminate various time series of changes thereby uncovering the long-term trend of time series
• It can give inaccurate forcasts
conclusion
Studing the moving average was very enlightening. I want to appreciate my professor @shemul21 for his detailed explanation on the course.
Moving average indicatior is a popular indicator for traders worldwide. Although it has advantages but there was room for some disadvantage. So it now on our instinct that we make pocket changing decision.
Thanks for reading my post, do leave me a comment.
All images are from tradingview.com