Crypto Academy Week 12 | homework post for @kouba | trading with RSI | by @loveth01.
.jpeg)
What is the Relative Strength Index (RSI)?
The Relative Strength Index (RSI) is a from of measurements that is used by technical analyst to measures the magnitude of new price changes to evaluate the overbought or oversold condition of stock or other asset prices in the market. The RSI is displayed as a to and fro signals (a line graph which moves between two extremes; either high or low) and it reads from 0 to 100. This indicator was originally based on J. Welles Wilder Jr. And it was developed and introduced in his 1978 book titled "New Concepts".
The normal interpretation and usage of RSI is that a value of 70 or more will indicate that the asset in the market is overbought or it is overvalued, and may be in preparation for a trend reversal or in price adjustment. If the RSI value is 30 or less, it means the asset is oversold or undervaluation.
The RSI goes up as the number and size of positive closing prices upsurge, and it also shrinks as the number and size of losses upturns. RSI is up to 100 or 0 in a very strong trending market.
Sometimes, during the downtrend, the RSI may peak near the 50% level rather than the 70%. This can be used by investors to more reliably communicate bearish conditions. Many investors apply a horizontal trend line between 30% and 70% when there is a strong trend to better identify extremes. When the price of a stock or asset is in a long-term horizontal channel, it is generally unnecessary to correct the level of overbought or oversold.
The concept associated with using a trend-appropriate overbought or oversold level is to focus on the trending trading signals and technologies. Having said that, using a bullish signal when the price is in a bullish trend and a bearish signal when a stock is in a bearish trend will help a trader to watch out and avoid many false alarms that the RSI may generate.
RSI and RSI range interpretation
In general, if the RSI exceeds the horizontal baseline 30, it is a bullish signal, and if it falls below the horizontal baseline 70, it is a bearish signal. In other words, if the value of RSI is interpreted as 70 or higher, the securities are being overbought or overvalued, and you can prepare for a trend reversal or adjustment price decline. An RSI of 30 or less shows oversold or undervalued conditions.
During the trend, the RSI reading can go down to a band or range. During the uptrend, the RSI tends to be above 30 and should reach 70 frequently. The RSI occasionally exceeds 70 during a downtrend, and the indicator often hits 30 or less. These guidelines is helpful in determine trend strength and identify potential reversals. For example, if the RSI couldnt reach 70 on several uninterrupted price movements during an uptrend, but then it drops below 30, the trend will be weakened and may finally fall.
However for a downtrend, it is the opposite. If the downtrend does not reach below 30 and rises above 70, the downtrend weakens and may reverse to an uptrend. Trend lines and moving averages are useful tools to include when using RSI in this way.
How is it calculated?
(1) First average increase = (total increase for 14 days) ÷ 14
Average increase = (Average increase up to the previous day x 13 + Most recent increase) ÷ 14
(2) First average decline = (total decline for 14 days) ÷ 14
Average decline = (Average decline up to the previous day x 13 + most recent decline) ÷ 14
RSI is designed to indicate whether a security is overbought or oversold in relation to the latest price level. RSI is calculated using the average price increase and loss over a given period. The default period is 14 periods with values between 0 and 100.
Can the RSI be trusted on cryptocurrency trading and why?
Yes;
The Relative Strength Index (RSI) is "contrarian" trading method that has an effectual oscillator for the range market. In other words, it is a consolidating market, with a stance of selling when it goes up and buying when it goes down.
How can the RSI indicator be configured on the chart and what is the meaning of length parameter ? Why is it equal to 14? Can it be altered?
Step 1: go to tradingview.com
Step 2: log in and select which pair to trade
Step 3: select FX
Step 5: click on Relative strength index
Step 5: click on setting which appear on the chart
Step 6: set the input and you can style your chart as you prefer.
The steps are outlined in the images below:
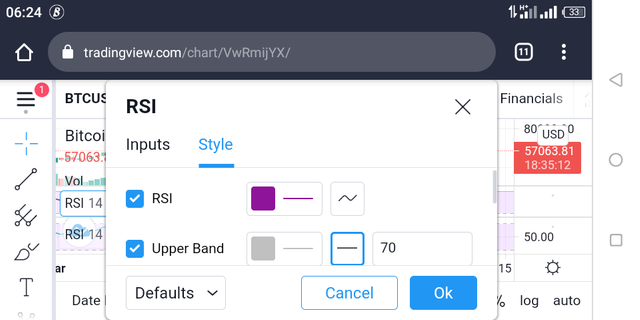
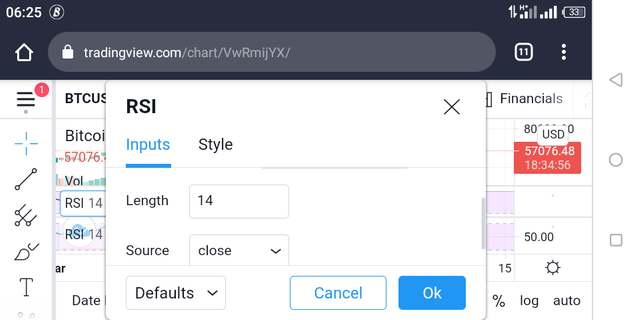
Length parameter can be referred to as the average period of time taken by the asset to increase or decrease.
I think it is equal to 14 by default because that was the value that was originally used by J. Welles Wilder Jr. (The inventor) and it is taken as constant.
Yes, it can be changed depend on the what is to be taken as the average period.
How to filter RSI signals to differentiate and take note of true signals from false signals?
By using a bearish swing rejection signal. Like most trading techniques, this signal is most reliable when following a general long-term trend.
How to interpret the overbought and oversold signals when you trade cryptocurrencies?
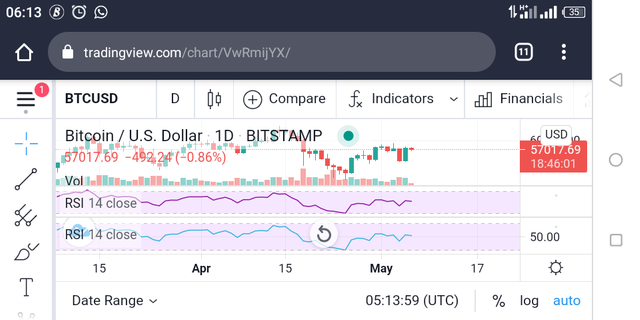
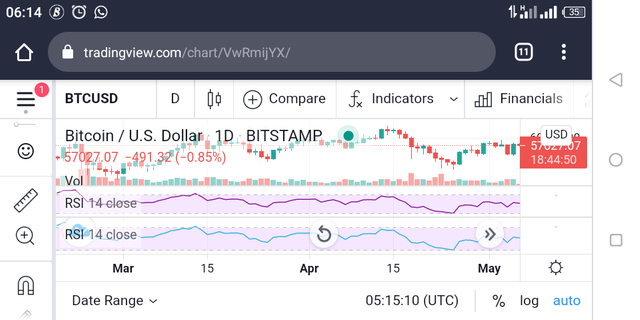
Looking at the image below; The arrows are showing overbought signal.

Looking at the image below: oversold signal is indicated with the circles.

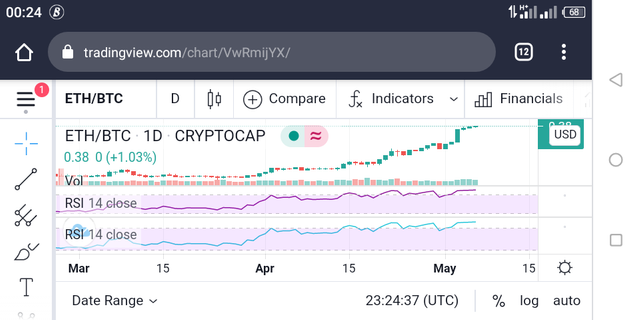
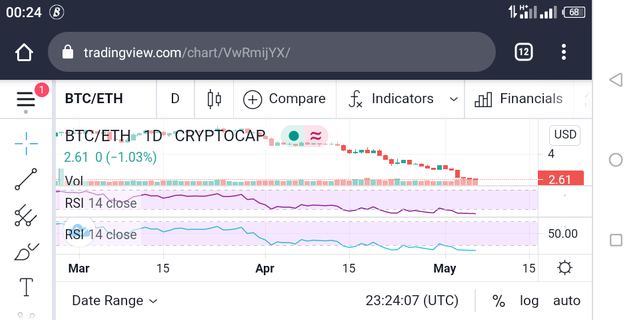
Reviewing Crytocurrency price index :
In this chart the value of ETH as compared to the value of BTC shows that there is an overbought in the price according to the signal 1 shown below but in chart 2, the value of a BTC as compared to ETH shows that there is an oversold in the price if the assests in the market.
In conclusion,
The knowledge of RSI will allow trader knows the condition of each asset they plan or want to buy.
I try to circle it in question 5 but anytime I move it to my gallery to enable me select the screenshot the circle will disappear that why the circle is not showing.
Thank you at professor @kouba this is my homework post.
Hi @loveth01
Thanks for your participation in the Steemit Crypto Academy
Feedback
This is just average work done. Kindly put more effort into your work.
Homework task
5
Okay professor, thanks.