Support and Resistance Breakouts - Steemit Crypto Academy |S6W3| - Homework Post for Professor @pelon53


In order to understand the market, technical analysis is without a doubt the most important sort of analysis available to retail traders today. One of the most important technical analysis tools is the chart's support and resistance levels. Every trader looks for these critical levels before making any trading decisions. Before making any market judgments, a trader must first understand how price behaves at support and resistance levels.
The important levels of support and resistance on the chart are where there is a lot of buying and selling interest. The market takes a breather at this time to build momentum for the following wave of market action. The supply and demand of price generate price reactions at the support and resistance levels.
Support and resistance levels are essential because they aid traders in determining the likelihood of a price reversal or continuance in the market. Price rejection at support and resistance levels acts as market reversal markers. The breaking of support and resistance levels also acts as a continuation of the previous trend.
Identifying support and resistance on the chart also aids traders in locating entry and exit points on the chart. Because these are the locations of considerable buying and selling activity, traders prefer to put their take-profit positions at the nearest support and resistance levels.
The typical interpretation of support and resistance is that price will reverse to the upside when it reaches support and vice versa when it reaches resistance, however this is not always the case. When prices reach this levels, anything might happen depending on market buying and selling interest. A breakthrough is regarded for a continuation of the bullish trend if there is still buying demand at a resistance level. If there is still selling demand at a support level, price breaks out below the resistance level, indicating that the downturn will continue.
Breakout of a Resistance
The market considers the resistance to be a hotspot for selling. Buying orders are generally closed at the resistance, resulting in selling pressure in the market, causing the price to fall. In certain circumstances, we might notice strong price demand in the market, causing the price to break through the resistance level. The breakthrough of price above the resistance level suggests that buyers have a strong desire to keep pushing the price higher. Traders might construct a buy position by taking advantage of a breakout at resistance. The chart below shows an example of a breakout at resistance.
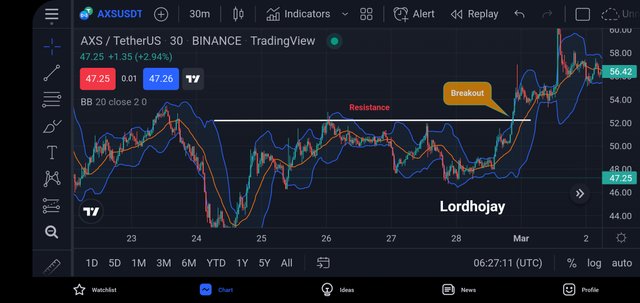
I've included the Bollinger band as a filter to the breakout in the chart above. The Bollinger band is a price volatility indicator that is based on volatility. The Bollinger band's upper and lower bands act as price dynamic support and resistance. The candlestick breaks out of the Bollinger band, signaling a Bollinger band breakout. The breakthrough around the resistance level depicted on the chart can also be noticed on the Bollinger band, as the breakout candle is seen outside the upper band in the chart above.
The support level, as I previously stated, acts as a level of significant purchasing interest in the market. Traders always look for purchase chances after booking profits on their sell positions. Although it is common for price to be rejected at the support level, this is not always the case. Price may break through the support level under significant selling pressure, continuing the negative trend. The chart below shows an example of a support breakthrough.
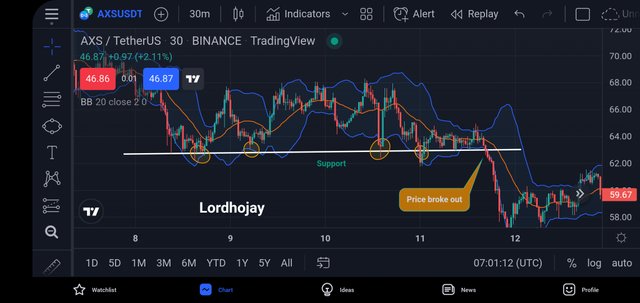
Price was repeatedly rejected at a support level before breaking below it, as shown in the chart above. The more a level is challenged, the more likely it is that price will break through it, which is exactly what occurred here on AXS/USDT. In addition, the Bollinger band has been introduced to corroborate the breakout. As we observe price bounce off the bottom band of the Bollinger band, it provides as support. When a candlestick breaks below the bottom band, it is called a breakout. The breakout candle of the support indicated on the chart also aligns with the breakout on the Bollinger band, as we observe a bearish candle breakout below the Bollinger band's lower band in the chart above.
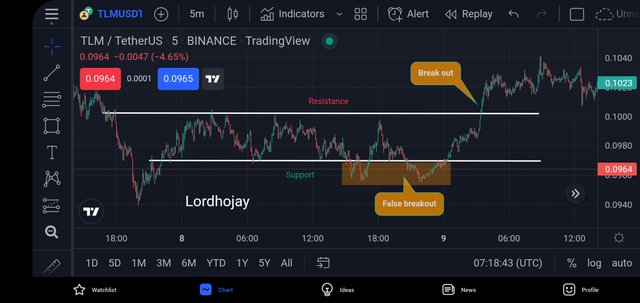
When a price breaks through a support or resistance zone and then reverses in the other direction, this is known as a false breakout. In a fake break out, instead of continuing in the direction of the breakout, the price moves in the opposite direction. False breakout is a strategy used by strong hands in the market to entice retail traders to place non-profitable orders.
An example of a false breakout is seen in the image below. As can be seen, price breaks through the support zone before turning upwards. Any trader who enters the market shortly after this bogus break out will lose the transaction. Waiting for a definite breakthrough at either of the zones is one of the reasons to avoid trading fake breakouts. Before contemplating placing an order in the market, traders might wait for price to retest a broken support or resistance level and establish a new high or low.
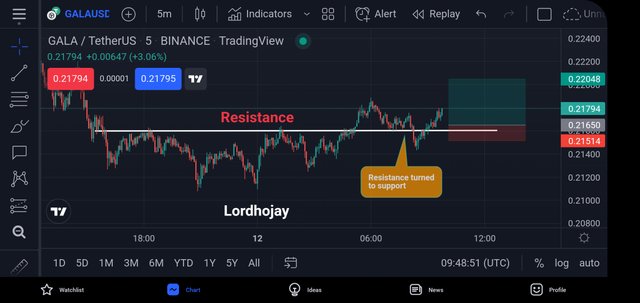
For this question, I will use a 5-minutes chart of the GALA/USDT crypto pair.
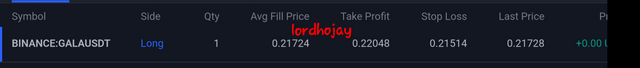
I noted that price has repeatedly tested a resistance level. This is usually a hint that price will break over this barrier, signaling a bullish continuation. Price eventually broke through the barrier and retested it, forming a support. At this time, the breakout has been confirmed as not being a fake breakout. Before starting a buy position, I waited for the price to reverse back up. The profit objective for this position was established at the closest resistance and the stoploss was set below the broken resistance. The trade's specifics may be seen in the chart below.
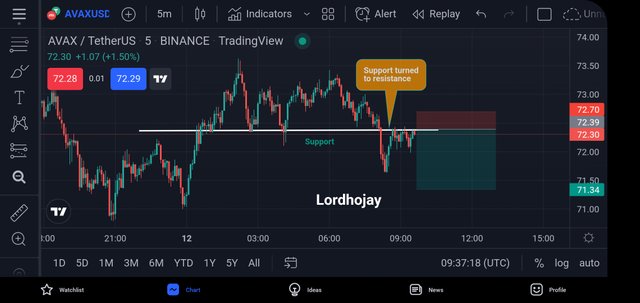
For this part, I will use a 5-minutes chart of the AVAX/USDT crypto pair.
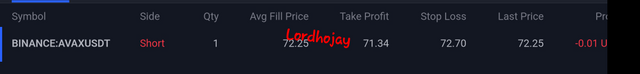
I noted that the price had broken through a support level. Waiting for a retest of the broken support to turn resistance took patience. This will provide me with proof that the breakout is not a hoax. Price returned to retest the broken support, which had now turned resistance, after some time. After the price reversed back down, I entered a sell trade with a stoploss put above the broken support. The trade's specifics may be seen in the screenshot below.
Traders are always experimenting with resistance and support levels. Some traders specialize in reversals, while others only trade breakouts. It is critical to have a trading plan and to practice correctly before entering the markets with a real account, regardless of the type of transaction. Price action trading is preferred by certain traders, while technical indicators are preferred by others. In any scenario, extreme vigilance is required.
Thank you prof @pelon53 for this class.