Strategy and use of Donchian Channels - Crypto Academy / S5W1 - Homework post for @ lenonmc21


Richard Donchain created the indicator to aid him in identifying and evaluating market movements. The Donchain channel indication is extensively used today to illustrate market instability, trend breakouts, reversal signals, and overbought/oversold market scenarios to traders.
The Donchian Channel has parts which are the upper band displaying the previous period's highest price and the lower band displaying the previous period's lowest price. The average of the two prices is shown in the center line.
The three bands depict current market momentum in an assest allowing traders to establish a market position in anticipation of a price rise or decline based on suggestive indications.

Using the basic methods below, you can compute all three lines of the Donchian channels. The timeframe which the Donchian channel is estimated, which might be minutes, hours, days, or months. For channel calculations, traders frequently utilize a 20-day period as a baseline.
Upper channel = preceding timeframe period's highest high
Lower channel = previous timeframe period's lowest low
(higher channel – lower channel) 2) = middle line
The period will be the number of periods being measured, and n will be a variable period length based on the measurement time frame under investigation – such as minutes, hours, days, weeks, or months.
Traders utilize Donchain channels in one of three ways to discover trading opportunities in a market. Traders use the Donchain Channels Indicator to identify reversals by measuring market volatility, breakout positions, and overbought and oversold situations. These three applications will be discussed in further depth below.
Volatility is high: When the gap between the upper band or channel and the lower band or channel is longer, the market is said to be volatile. The wider the gap between the upper and lower bars, the more volatile the market is. And we all know how fickle asset prices are in a tumultuous market.

Low volatility: In contrast to High Volatility, when the gap between the upper and lower bands is less, the market is deemed to be less volatile. That is, the closer the upper and lower channels are, the less volatile the market is and the more stable the price of an assest is.

Overbought zone:Areas in the overbought zone imply that an asset has been overpriced. When the price of an asset is on an upswing, generally in a bullish market, it enters an overbought zone. This position typically indicates that there are more buyers than sellers in the market, causing the price to rise.
When the price chart hits and likely pushes the upper channel higher, the overbought positions may be identified using the Donchain channels.

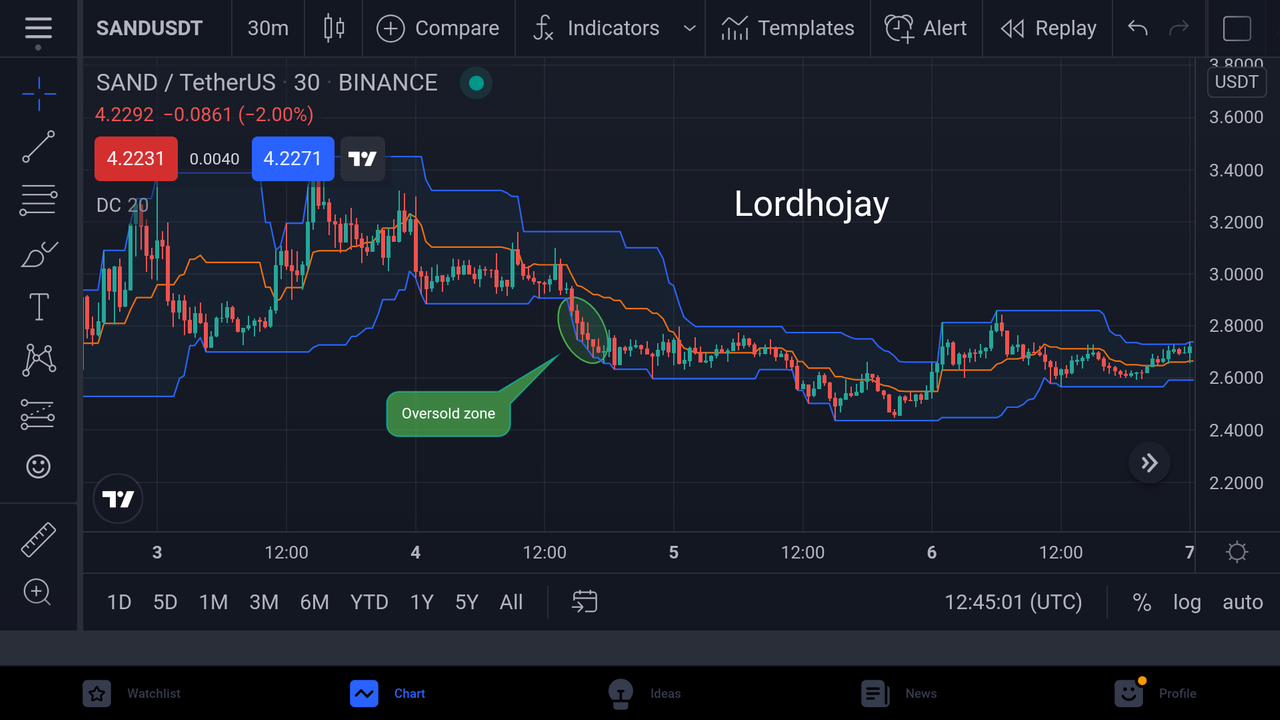
Oversold Zone:Oversold Zones are indicators of a financial asset's undervaluation. Oversold positions are most common during a downtrend, when prices are consistently making lower lows, and they indicate that selling are outnumbering purchasers in the market, driving the price down. When the price chart reaches the bottom channel or band, the oversold condition is identified using the Donchain channels.
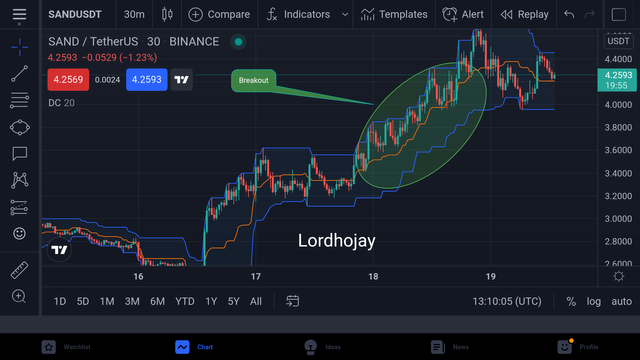
Breakouts: A breakout happens in a bullish market when price is in an Overbought position and instead of reversing lower, price breaks and continues upward. In a bearish market, a breakout occurs when price is in an oversold position and instead of turning higher, price breaks and continues to fall.
Make 1 inning using the "Donchian Channel Breakout Strategy" and make 1 inning using the "Reversal and Retracement Strategy" . You must explain the step by step of how you analyzed to take your entry and make them into a demo account so I can evaluate how the operation was taken.
Reversal Strategy

For the this particular question I have choosen the TLM/USDT pair which is in an uptrend. According to this chart the price crossed the middle band after three higher highs. Which signals a reversal so i decided to go short by placing a sell order with a stop loss.
Breakout

For this particular question I'm going to choose the AVAX/USDT
The price of the assest struggles a bit after hitting the top band three time which signal a break through so I placed an order to buy at the possibile next support.
Donchian Channels may be used for a variety of purposes, including determining market volatility, determining the potential of the market being overbought or oversold, and determining if the current trend is a strong trend or not. You may utilize the Donchian Channels Breakout Strategy or the Reversal and Retracement Strategy while trading with the Donchian Channels indicator.
Thanks your prof. @lenonmc21 for this class.