Crypto Academy / Season 3 / Week 8 - Homework Post for [@asaj]: Crypto Assets and the Random Index (KDJ) / by @lordhojay
(Question 1) In your own words define the random index and explain how it is calculated
In trading, traders used both technical and fundamental analysis to analyse market which in turns help them to predict the movement of an asset and the direction of price over a certain period of time. Many tools are employed to carry out technical analysis in trading, part of which is called Indicator. Indicators are technical tools used by traders to predict the future trend and price of an asset or commodity.
There are many indicators used by traders to carry out their analysis, one of which is Random Index which is popularly known as KDJ Indicator. It is a technical tool used to predicts or determine the changes in price, the entry and exit point and the trend and the possible reversal area of an asset.
This indicator is similar to stochastic indicator in that it measures both oversold and overbought region of an asset. The difference is that while stochastic consists two line %K and %D, KDJ indicator has %J line in addition to %K and %D lines. The %J line shows the divergence of the other two lines.
Calculation of Random Index Line
% K line, D line and J line are calculated as follows;
%K = ( 2/3 × Kp)+ (1/3 × RSV)
%D = (2/3 × Dp) + (1/3 × %K)
%J = (3× %K) – (2 × %D)
Kp is the previous day of K value.
Dp is the previous day value of D.
T raders often use 50 for Kp and Dp if there is no previous day value for for them.
But RSV is immature index value which calculated thus;
RSV =(C -L)/(H-L) ×100
C= the closing price for the period in consideration
L = The lowest price for the period in consideration
H = The highest price for the period in consideration
(Question 2) Is the random index reliable? Explain
There is no technical tool that has 100% reliability. Yes, no indicator could be vouched for to be 100 percent accurate in financial trading. The wide range of indicators we have today is as result one limitation or the other from the previous indicators.
For a trader to determine the reliability and accuracy of any indicator, many back test must have been done on such an indicator, and especially because of the irregularity of price the best way to know how reliable an indicator is is to practice with demo account many times to have the real experience of it.
As I said earlier, no indicator is 100% accurate. Likewise, random index indicator is not 100% reliable but it works very well when it is mastered by traders. Additionally it reliability can be reinforced when combined with another indicator. In short, a good experience of this wonderful indicator is needed over a period of time for a trader to able to predict how reliable and accurate it is for technical analysis.
More so, KDJ work well for market that is trending. It does not work for ranging market.
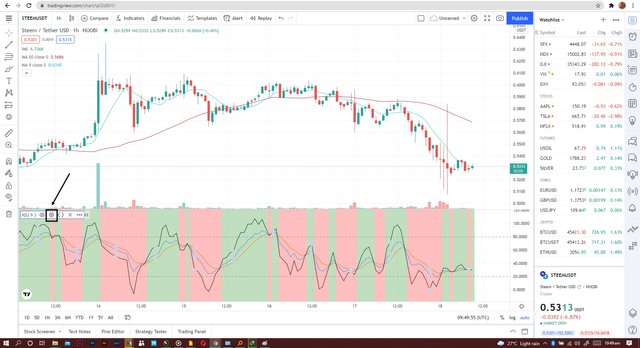
(Question 3) How is the random index added to a chart and what are the recommended parameters? (Screenshot required)
This is the first step. The first step is to create a chart.
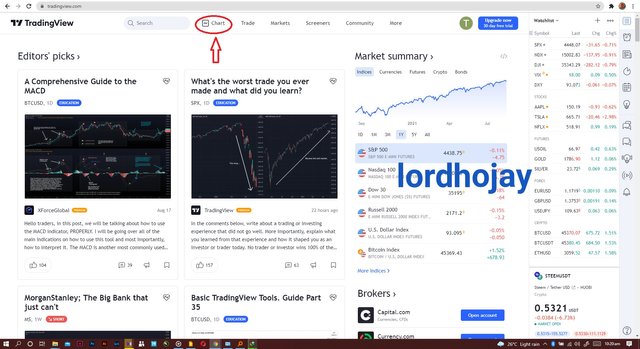
The following is the second step. On Tradingview, there is an icon named fx indicators in the upper center of the chart. Select it by clicking on it.
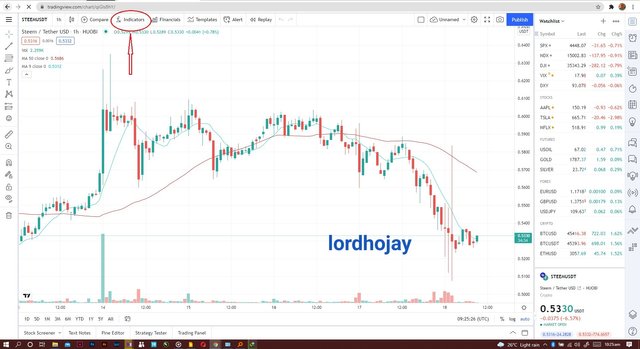
A new page will appear once we click on the forex indicators.
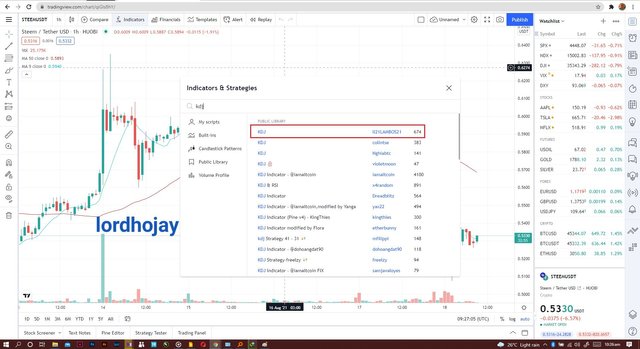
The KDJ indication will appear when we put KDJ into the search field.
Then we'll click on it.
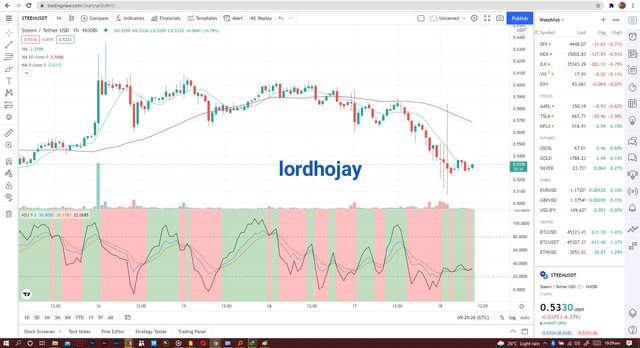
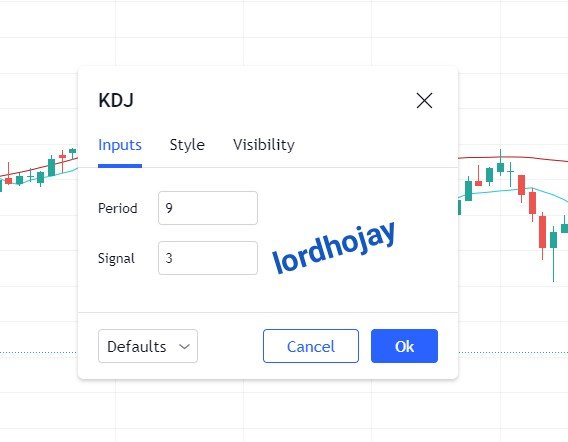
Recommended configuration for the KDJ indicator
I pressed the button and selected the setting icon.
The period and signal were set at 9 and 3, respectively
The K and D lines are now green and red, respectively, while the J-line is black.
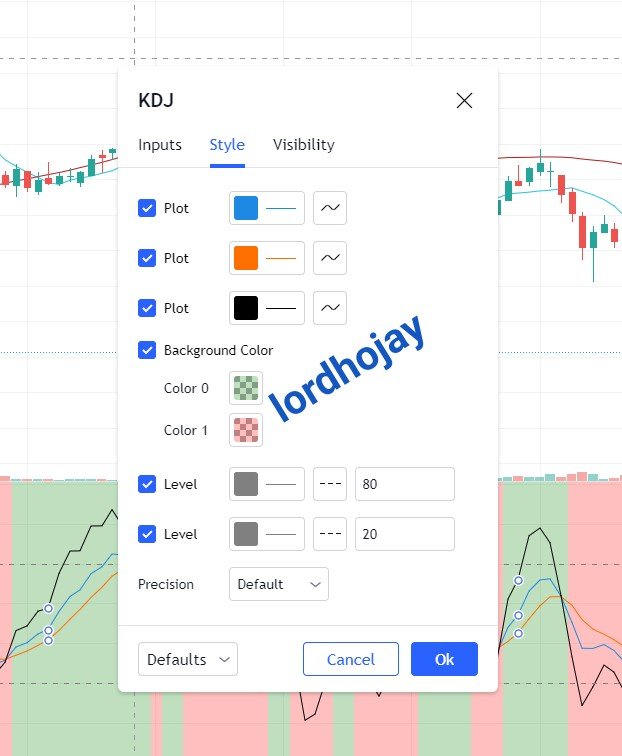
We can change the minute, hour, day, and week on our KDJ indicator using the visibility option.
(Question 4) Differences between KDJ, ADX, and ATR
| KDJ | ADX | ATR |
|---|---|---|
| KDJ assists traders in determining price movement changes | ADX is a volatility indicator. | ATR (Average True Range) is a volatility indicator that monitors an asset's movement over time. |
| KDJ is set to 9,3,3 by default | ADX is set to 14,14,14 by default | ATR is set to 14, 14, 14 by default. |
| KDJ has three line indicators: %K, %D, and %J | ADX is a one line trend | ATR is a single line indicator. |
| It is only useful in trending markets. | It may be utilized in trending and ranging markets. | It moves in the same way as a basic average indicator. |
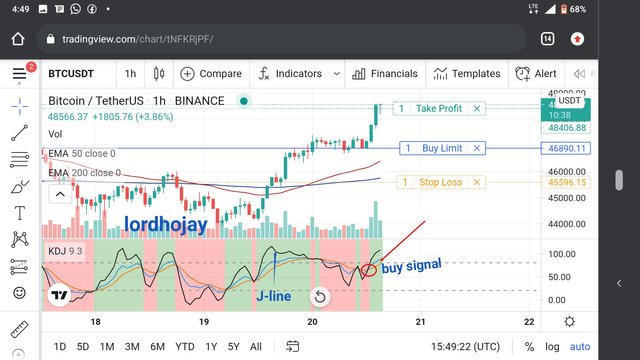
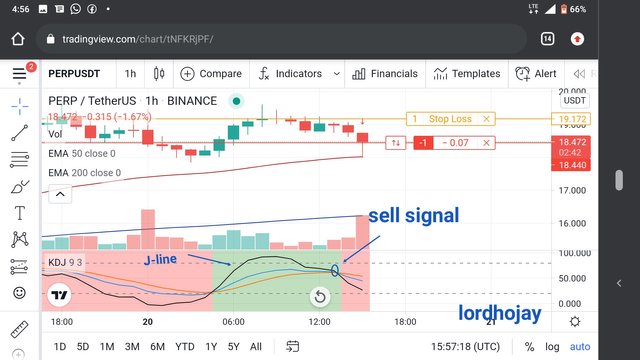
(Question 5) Use the signals of the random index to buy and sell any two cryptocurrencies. (Screenshot required)
The J-line (black) has just crossed up above the K and D lines, indicating a buy signal, as shown in the screenshot above. As a result, I put up a purchase order on the BTCUSD pair.
The J-line (black) has just crossed below the K and D lines, indicating a sell signal, as shown in the screenshot above. As a result, I put a sell order on the PERPUSDT currency pair.
Conclusion
KDJ is a one-of-a-kind indicator that employs its J-line to detect overbought and oversold conditions. It is accurate in determining the intensity of a trend when the J-line reaches the 80 or 20% mark. This indicator is simple to use and can be added to any chart. This indication will go a long way toward assisting investors in making either short-term or long-term gains.
Thank you, professor @asaj
Hi @lordhojay, thanks for performing the above task the eighth week of Steemit Crypto Academy Season 3. The time and effort put into this work is appreciated. Hence, you have scored 5 out of 10. Here are the details:
Remarks
Commendable effort but fair performance. You have demonstrated a good understanding of the topic. You have performed the assigned task excellently. However, your answer to task 5 could have been better if you had analysed two coins with clears charts providing the buy and sell signals as well as a screenshot of your demo account summary. Also, you did not provide the level of details we look out for in the academy.
Thank you professor. I will work harder next time