Steemit Crypto Academy | Season 4 : Trading with Strong, Weak and Gap Levels | Homework task for @allbert
Hi all Crypto friends wherever you are,
I hope you are all in good health and kept away from various diseases.

It's great to be back studying at Crypto Academy Season 4 and meet again with Prof. @allbert
This is my homework post for Prof. Hopefully my homework is in accordance with the material that Prof. Say it. And I am very happy, because I have learned a lot from Prof.'s class. This.
Thank you very much Prof.

1- Graphically, explain the difference between Weak and Strong Levels. (Screenshots required) Explain what happens in the market for these differences to occur.
In the price chart, we can see there are support and resistance levels which are the peaks and valleys of the price of an asset. Where we can clearly see price moving high and price moving low, not only that, in the price chart we can also see that if there are strong highs and lows, then we can also see weak highs and lows. These two levels, support and resistance provide an imaginary line that serves to minimize risk in trading. And we really hope to be able to recognize this line well.
As the support and resistance levels are in the chart that creates an imaginary line, which line gives or produces strong and weak levels in each trading time. In trading, we can decide to buy or sell. And to get these two decisions, we can rely on an imaginary line. The decision to buy can be made when the price of an asset must rise and penetrate above the resistance level where the price will rise higher so that it forms a level at another peak where at that time we can place a buy order. Vice versa, we can make the decision to sell when the price of an asset breaks below the support level, and forms a valley below the previous one.
Strong Levels
Take a look at the screenshot below which will show the market performance levels at strong support and resistance levels which at these levels usually make traders place buy and sell orders. High levels on long positions and waiting on strong resistance levels as well. And usually the volume on large trades is at a strong level, so imaginary lines are applied for traders to make decisions for their prices.
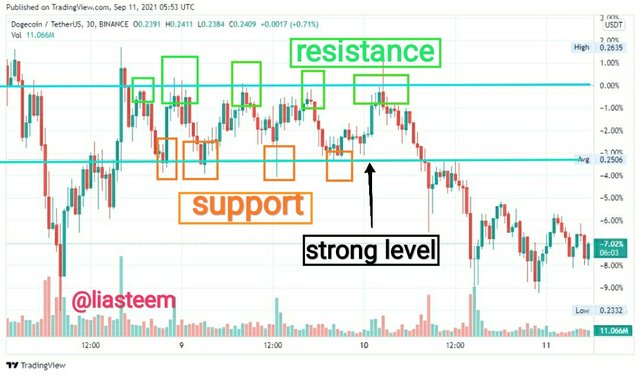
We can see some support and resistance levels in the screenshot above. We can see the formation of a strong level in the market after several times the price of Dogecoin/TetherUS rose. This creates the formation of strong levels in the market as prices reach support and resistance levels, and pending orders are executed thereby making the market liquid. And when the price reaches a strong level, pending orders are activated thereby triggering a large number of up and down market prices to move, and affect the price of Dogecoin/TetherUS after reaching both levels, namely support and resistance levels.
Weak Level
Take a look at the screenshot below, we can see a very fast change in the price trend, and we can see that the Level is Weak which means that the trading volume is not so high as to make the market trend in the opposite direction over a longer timeframe. This is why we can spot and see rapid trend changes which we refer to as weak support and resistance levels.
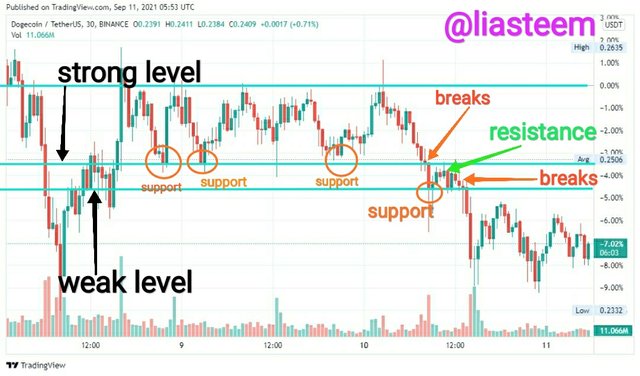
We can see some support and resistance levels in the screenshot above. We can see the formation of a weak level in the market after one time the price of Dogecoin/TetherUS returned to the resistance level. This creates the formation of weak levels in the market as the price reaches the support level, and pending orders are executed in smaller numbers, with much lower volume and are quickly exhausted making the market liquid. So it affects the price of Dogecoin/TetherUS which only goes up once so that when it reaches back to the support level, there are no pending orders anymore and this causes the support and resistance levels to be broken.
2-Explain what a Gap is. (Required Screenshots) What happens in the market to cause It.
What a Gap is
As the name suggests, a gap is a jump that occurs due to the price of a Crypto asset where the jump passes a certain level and creates a new level without passing the next level. Or a gap can be interpreted as a jump from one candle to another without crossing the previous candle and creating a new important level, which results from sudden market movements due to the process of buying and selling with large volumes. Take a look at the screenshots below!
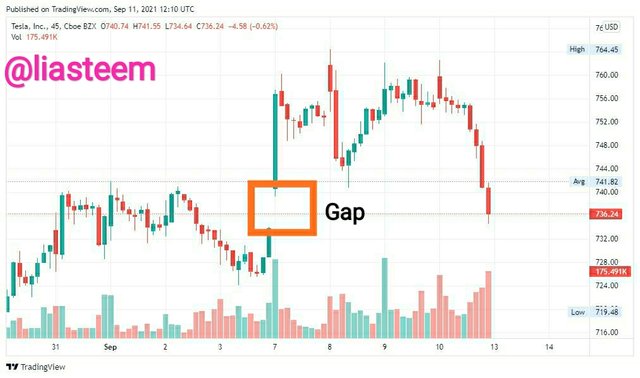
We can see from the screenshot above how the gap occurs in the Apple.Inc market. As explained by the meaning of the gap, in the Apple.Inc market, there was a sudden spike in price due to high trading volume. Why is that? This happens because of the buying/selling process with high trading volume. However, gaps occurring in the market also have another possibility that many of the crypto traders take assets so this creates a gap and will fill over time.
3- Explain the types of Gap (Screenshots required, it is not allowed to use the same images of the class).
Explain the types of Gap (Screenshots required)
There are several types of Gap;
- Breakaway Gap
Breakaway Gap is a gap that occurs and indicates a breakout in the structure of the market movement and this type of gap indicates strong support and resistance levels. After this type of gap is formed and then creates a gap this is where it indicates the start of a new trend being created.
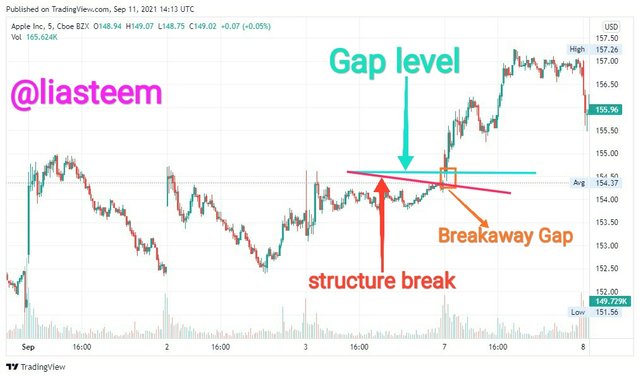
By looking at the chart above, ....... The breakaway gap formed which ...... Experiencing a price decline which indicates that this breakaway gap is very clearly formed from a down market trend to a high market trend and indicates the beginning of a a new market trend that represents a strong level of support or resistance.
- Runaway Gap
Runaway is a type of gap that occurs when the market trend is still new and the market trend is still ongoing both during an uptrend and downtrend and usually occurs in the middle of the market structure.
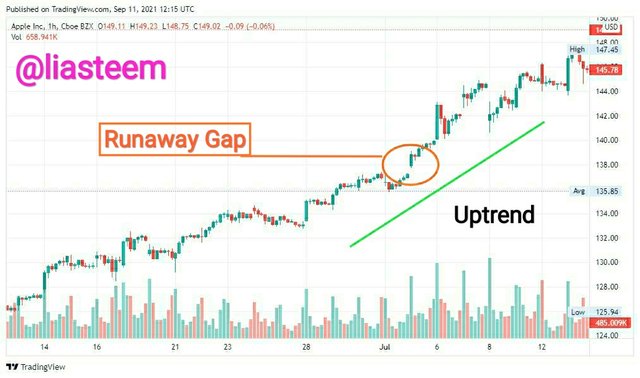
We can see how the gap is formed when the market trend is uptrend and this gap occurs in the middle of the market structure.
- Exhaust Gap
Type Exhaustion Gap is a gap that is very difficult to identify because this gap occurs very close to the end of the trend. Because this gap occurs near the end of the trend, so we can only recognize it after the trend moves forward. And usually the market price will move and fill the gap that is formed and usually this gap is traded in the opposite direction.
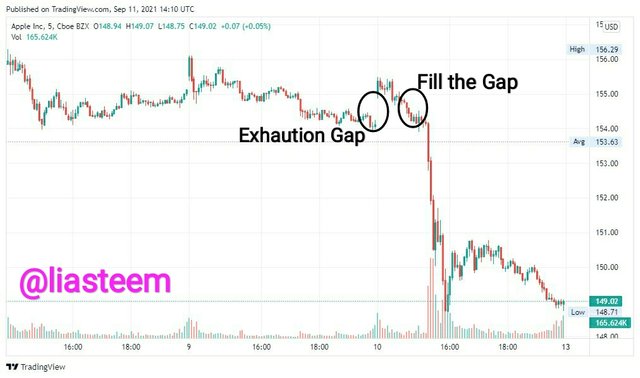
The exit gap in the chart above is formed when Apple Inc. Experiencing price increases and the market trend is uptrend. And the exit gap will be filled with the movement of the market trend that is experiencing a price decline or a downtrend.
4- Through a Demo account, perform the (buy/sell) through Strong Supports and resistances. Explain the procedure (Required Screenshots).
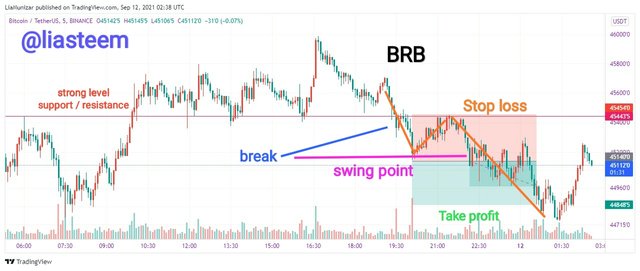
From the screenshot above, I use the BRB (Break Retest Break) strategy that goes through Strong Supports and resistances. I chose Bitcoin/ TetherUS to show the Strong Supports and resistances levels. in this chart I set the ratio of Stop Loss and Take Profit 1:1. The chart above shows that the support and resistance levels were broken and created swing points and when the market price went up the Bitcoin/TetherUS price also broke the swing point, and I placed my sell after the break of the swing point.
5- Through a Demo account, perform the (buy/sell) through Gaps levels. Explain the procedure (Required Screenshots).
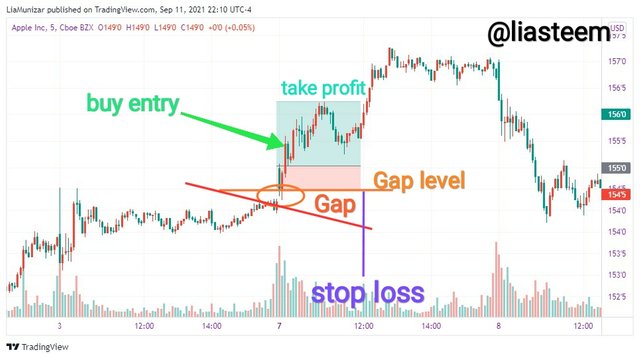
From the chart above, it shows that I placed my buy entry with the Apple Inc cryptocurrency after the Gap formed and the market structure broke the Bullish candle. I also set the ratio of Stop Loss and Take Profit 1: 2.
Conclusion
In analyzing price trends, there are many ways that we can do to minimize the occurrence of risk, one of which is by looking at the support and resistance levels which are the peaks and valleys of the price of an asset. Where we can clearly see price moving high and price moving low, not only that, in the price chart we can also see that if there are strong highs and lows, then we can also see weak highs and lows. These two levels, support and resistance provide an imaginary line that serves to minimize risk in trading. And we really hope to be able to recognize this line well.
Many thanks to Prof. I hope my homework can be accepted and if there are errors, please correct them. Thank you for your attention.
Regards.
Sorry but your post was published out of the time indicated in the Academy. September 11th, 11.59 UTC
😌 ...
Thanks you very much Prof.
Kak Riana kan ada ikut MiniCrypto tapi tugas riana udah 2 hari gadiperiksa kak, ini tugas yang udah Riana Buat kak
https://steemit.com/hive-153970/@rnadewi/mini-crypto-program-part-2-or-or-how-psychology-influences-market-cycles-by-rnadewi
Sepertinya kakak melewatkan pemeriksaan tugas Riana, karena tugas diatas Riana udah pada kakak periksa semua, tapi tugas Riana Belum kak.