Steemit Crypto Academy | Season 3: Week 7 || How to create an account on TradingView, how to use indicators,tools, features of tradingview by @liasteem
Assalamu'alaikum, Prof. @yousafharoonkhan
I am your new student in this class, I hope you are always healthy and fine.
I want to collect my homework in class prof. who gave very interesting lectures.
I hope this will be of much use to me as well as others.
If there is an error, I beg prof. To correct my homework.
Thank you very much Prof.

Defining the TradingView site

TradingView is a place where all crypto traders can see clear and good trading charts in all parts of the world where they trade crypto. traders to view different trading charts.
TradingView can also be interpreted where all traders get all the information, be it traders who have been in the crypto trading cycle for a long time or who have just joined the crypto market world, like me.
This TradingView application is used by traders to see some of the trends that are happening in the market cycle, because this TradingView application uses several charts, it will be very easy for market users to see, learn, and even analyze how the current trading cycle is, whether they will get loss or gain. What is clear, all crypto traders want results not lose results.
With this TradingView application, we can learn a lot and can help us, especially new traders in the crypto world to share ideas and information with charts that have been made so that traders and investors do not have to feel depressed due to their misunderstandings about the crypto trading cycle. At the moment. This will be very useful and very useful of course.
How to register an account in tradingview?
Alright guys, it's not fair if we talk about TradingView without knowing and without registering our account with this app, as the saying goes; "We'll never be able to do it before". Let's see
Take a look at the graphic I took from the screenshot below! Pay attention to every step so that our account is processed easily.
- First, we have to go to the link page that has been given by prof. In order to make it easier for us to understand and understand how to create an account in this application. This is link address. All screenshots below, were taken with my own personal smartphone screen display.
The screenshot below is an image of the TradingView application's start page, now look at the left corner with the people icon.

Click the icon then see the last option "start free trial".
- After we choose start free trial, then a long time will appear as shown below;


The screenshot above is the preferred option for payment of the TradingView application which is often used by traders and investors in conducting and studying the market situation before they invest their assets into the crypto trading cycle. Let's hit that option, and see what happens;


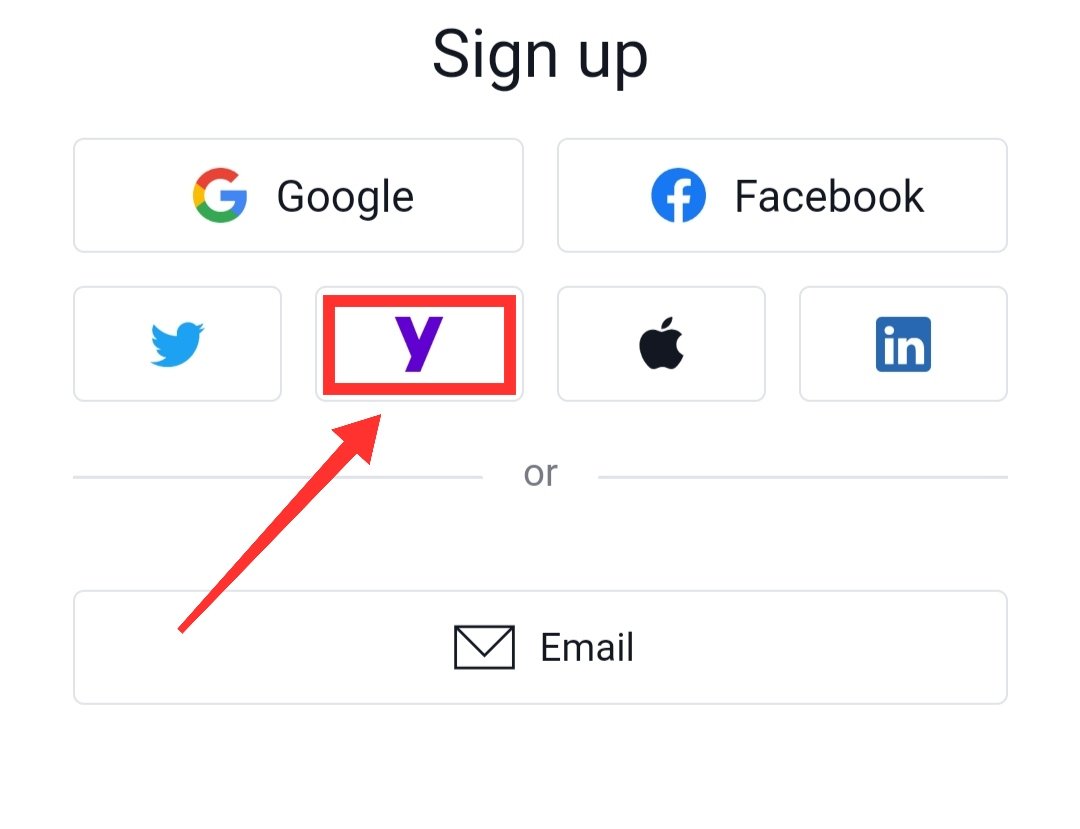


It turns out that we have to register an account to get logged in in order to access the TradingView application. I use Yahoo, because my email is already in use and can't sign in with my email. After filling in my data to the TradingView address, inputting a profile photo is very important, and after this process is complete, I finally managed to register an account to use this TradingView application. Take a look at the screenshots below!

My account has been registered on the TradingView platform
What are the different registration plan?(screenshot necessary)

The following is an explanation of several ways to register a plan that we can enjoy in this TradingView application.
"Monthly"
Various payment options are offered, ranging from "Pro, Pro+, and even Premium" with prices that vary according to each class.
Pro

Distraction-free trading and investing, with more charts, intervals and indicators
They offer $14.5 USD and 30 days of free usage with several benefits;
- Key benefits of Pros:
-5 indicators per chart
-2 charts in one window
-20 server-side alerts
-Ad-free
-Volume profile indicators
-Custom time intervals
-Multiple enhanced watchlists
-Bar replay on intraday bars
Pro+
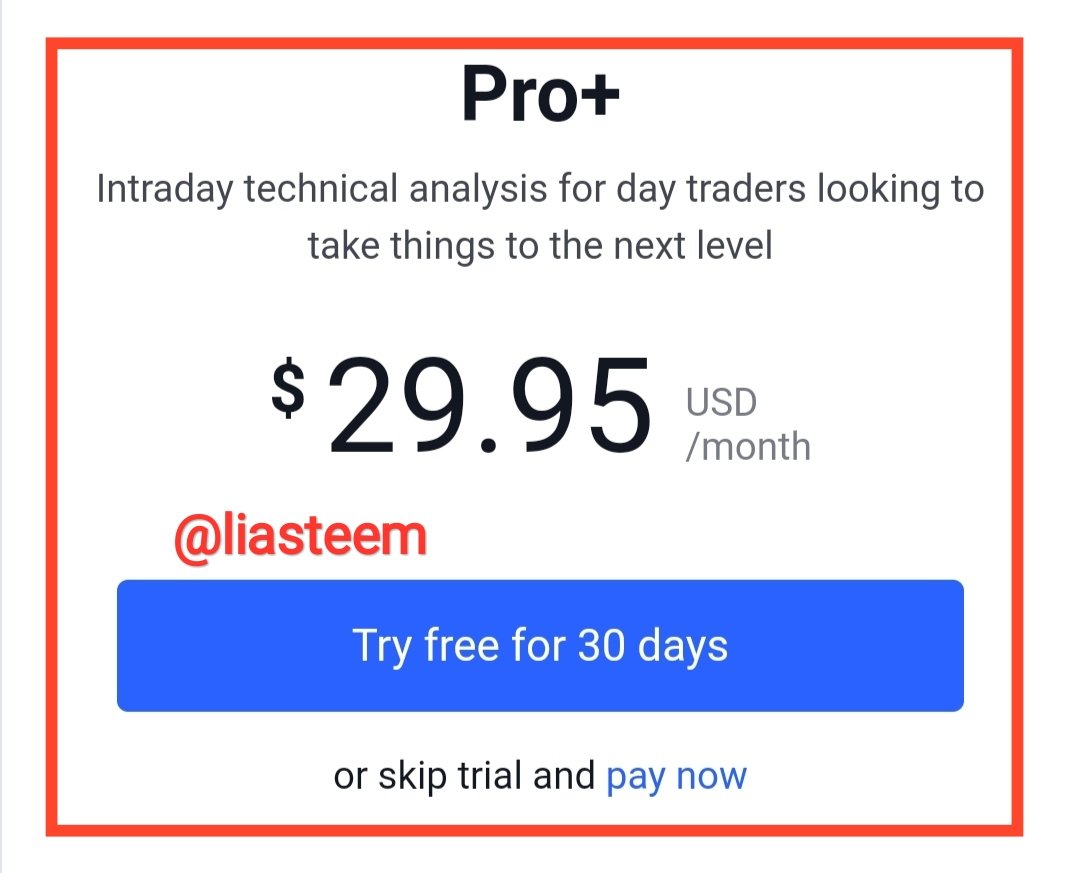
Intraday technical analysis for day traders looking to take things to the next level
They offer it for $29.95 USD/month
- All the benefits of Pro, plus:
-10 indicators per chart
-4 charts in one layout
-100 server-side alerts
-2 devices at the same time
-Intraday exotic charts
-Charts based on custom formulas
-Export data chart
-Indicators on indicators
Premium

Highest precision and maximum data to capture all possible opportunities
They offer a higher price of $59.95 USD/month
- Try free for 30 days, plus;
-25 indicators per chart
-8 charts in one layout
-400 server-side alerts
-5 devices at the same time
-Second-based intervals
-Alerts that don't expire
-4x more data on charts (20K bars)
-Publishing invite-only indicators
"Annually"
Not only monthly packages are offered, there is also an annual package which will definitely be more economical, but provides the benefits that we will get from using the TradingView application for a fee. This is no different from the monthly price, it's just that the package is once a year.
- Pro

Distraction-free trading and investing, with more charts, intervals and indicators.
Key benefits of Pros:
-5 indicators per chart
-2 charts in one window
-20 server-side alerts
-Ad-free
-Volume profile indicators
-Custom time intervals
-Multiple enhanced watchlists
-Bar replay on intraday bars
- Pro+

Intraday technical analysis for day traders looking to take things to the next level.
All the benefits of Pro, plus:
-10 indicators per chart
-4 charts in one layout
-100 server-side alerts
-2 devices at the same time
-Intraday exotic charts
-Charts based on custom formulas
-Export data chart
-Indicators on indicators
- Premium

Highest precision and maximum data to capture all possible opportunities.
The complete package, with:
-25 indicators per chart
-8 charts in one layout
-400 server-side alerts
-5 devices at the same time
-Second-based intervals
-Alerts that don't expire
-4x more data on charts (20K bars)
-Publishing invite-only indicators
Don't worry, besides this application offers several payment options according to its class and the benefits offered, this application also offers a free (free) option. Look at the article that I marked "try free basic". This free option does not offer more benefits, but it can still be used to see and learn how the market is doing with the appearance of chart features that may be simple.
2.Explain the different features of tradingView and what is your favorite feature and why?(screenshot necessary)
After the account is verified, let's go in with what is offered in this TradingView application. One of them is having various features. There are many features offered in this TradingView application, all of which provide the same benefits and the same goal, which is to increase trading and minimize losses. But I have to choose one of the TradingView features which is my favourite.
Some of the available features are as follows;
- Charts
- Market
- Screeners
- Community
*More
I will explain one by one;
- Charts

On the features chart, a graphic service is available that explains various things about the current market cycle, the total price of each item available in the market. It will be very beneficial for market users to know the history of transactions and trades. However, if you choose features with payment, then we will enjoy some of the other things offered in this section, of course something that is not on the "free trial" page.
- Market

In this feature, we are provided with several market trends that exist around the world, cryptocurrencies, currencies, stocks, indices, futures, bonds, sparks, where this feature also gives access to all well-known financial markets around the world on all assets, stocks. , indices, futures and bonds, which makes it easier for us to read the trading cycle when we want to trade or make a reference.
- Screeners

By using this screeners feature we can get the best results through the indicators of our choice. Which then filters all existing stock, then the stock is filtered and provides services according to our preferences which will save time and be faster. There are several types of screeners that users of the TradingView application can use and can trade with them. Namely, Stock Screener, Forex Screener and Crypto Screener.
- Community

Like other Community services, TradingView also provides the same service on Community features. Where we can have various communities available and we can join together to learn and show our abilities in the market cycle process whether selling or buying by looking at the opinions of expert traders.
- More

In more features, TradingView provides a variety of additional information that is also very important and useful, where we can find out about pricing, features, help center, about, and everything about Business.
What is your favorite feature and why?
My favorite feature is "chart", why? Because the features chart has all the information I need as a beginner to understand and learn trading as well as being a trader who doesn't misunderstand the current market cycle. The chart does not use words to describe all market information, but with just one chart view, I can easily read and understand what is available on the chart, be it stocks, assets, crypto currencies, gold, silver, and much more.
3.How to set up a chart in TradingView and use two tools to edit it.(screenshot necessary)
to set up a chart in TradingView is to look at one of the features provided by this TradingView application, namely "Chart". When we click on the chart, it will open a very cool chart display, and to set it we have to click on the chart.
Now let's set up a chart in TradingView!👇
Symbol

1.Look at the setting symbol on the right side of the top chart, click on it then several options will appear. To change the symbol on the graph, we simply click on settings and select the symbol menu, then there will be several options that we have to adjust to the tastes of each user, ranging from Body, Borders, wick, precision, to Time Zone. Look at the graph below, how I change the graphic symbol to my liking.
Appearance

2.After changing the symbol in the graph, then I proceed to change the appearance in the graph. Still with the same steps, click on the settings symbol then select the appearance option, there I changed a few things, take a look at the graph I changed, and see what I changed one by one. ️
I changed the background color from white to gray, Vert grid lines, Horz grid lines, Scales text, Scales lines, to Watermark.

Well, now I've changed the appearance of my graph. Now look at the difference between the two.
Use two tools to edit it.(screenshot necessary)

I will use two tools to set up the chart above,
- Cursor

The cursor is one of the tools provided to set up the chart, where the cursor serves to drag the chart back and forth, besides that the cursor also contains arrows, dots, and an eraser. Where we will easily use this tool to study graphs and find out all forms of information that we need.
- Trend line

The second tool I use is the trendline.
Where this trend line has a very varied line selection that suits our needs. Trend lines are very much used by traders to analyze techniques. This trend line is a line drawn from the top down if the trend is down, and drawn from the bottom up if the trend is up.
Here are my results before and after setting up the chart.


4.Explain how to add indicator in chart, what is your your favorite indicator and why? (screenshot necessary)
To add indicators in the chart is very easy. Adding indicators in the chart has one of its functions is that traders can perform market analysis of cryptocurrencies and other coins and this is the only feature that world traders use. Alright let's see how to add indicators in my chart.
How to add indicators to the chart
Indicators are the only feature that traders around the world use in charts. And with the help of indicators, traders carry out technical analysis of the cryptocurrency market and various coins. TradingView allows its users to use various indicators for free. And users can use these 3 indicators at once.

- First of all, let's click on the fx symbol above the chart which will display some indicators as we want.
- click the option that appears after the fx button is pressed and add whatever we want in the search field. I added the RSI (Relative Strength Index ) and lo and behold, there are several RSIs on offer.

What is your favorite indicator and why?
I'm going to enter the Relative Strength Index (RSI) and the RSI strategy and lo and behold, as soon as the options appear and the two RSIs will appear on the chart.

This is my favorite indicator, because just by looking I can analyze market techniques and it becomes very easy for me if at any time the market suddenly reverses, because this indicator has 3 lines attached at 40%, 50% and 70%. Market cycles are very clearly visible on these lines, look at one example, a line that crosses 70% allows the Bullish phase to end and a bearish phase will come, and vice versa, when the line crosses 50% allows an uptrend. This is a very easy indicator to understand.
5.Do you think TradingView is useful in predicting the market for cryptocurrency (trend / price)?
Of course TradingView is one of the platforms that is very useful in predicting the market, be it market prices, assets, and from this platform we as beginners make the trading process very easy and in TradingView there are lots of choices that we can adjust to our needs.
I feel much better after getting to know this TradingView platform. It is very easy to learn, even the market cycles that occur allow us to minimize losses due to our misunderstanding of the current market cycle. Even TradingView provides market cycles that occur in both the short and long term. This is also important information for us to make references.
In the market cycle, market analysis is very important, especially for traders and investors. TradingView makes it easy to predict, and even provides all information on currencies, assets, gold, silver, bitcoin, and everything about the cryptocurrency business. We can also benefit from the various features and indicators used by the whole world in trading.
6.Conclusion
TradingView is a place where all crypto traders can see clear and good trading charts in all parts of the world where they trade crypto. traders to view different trading charts.
Registering an account in TradingView is not difficult and so easy, I got this in this lecture from Prof. @yousafharoonkhan When registering an account, we are given several price options that can be paid monthly or annually with the level of service available in each package. TradingView not only provides a paid service, but also we can enjoy this TradingView platform for free, considering we are beginners in trading and in trends and currencies used by the whole world.
TradingView also has indicators that can analyze data, market prices, even the current cycles in the crypto market. Where indicators are the only feature used by traders around the world in trading to minimize the occurrence of unexpected trend changes.
Choosing TradingView as a platform for making decisions in market cycles is one of the most profitable actions in analyzing both rising and falling market trends and prices.
That's my homework for the Crypto Academy season 3 week 7 lecture to Prof. @yousafharoonkhan because of prof. I learned something new about crypto.
May you always be healthy.
Please correct me if I made a mistake.
Once again I thank Prof.
My thanks are also for all Steemian.
Greetings.
Respected first thank you very much for taking interest in SteemitCryptoAcademy
Season 3 | intermediate course class week 7
you explained very good, and your style of presentaion also is good, keep continue good work , thank you very much for taking participate in this class
steem on
Alhamdulillah...
Thanks you very much Prof. @yousafharoonkhan
😇🙏 May you always in peace and love.
Ma shah Allah , and same to you respected sister,May Allah bless you always success ameen, and steem on
Allahumma Aamiin..
🙏