Steemit Crypto Academy Contest / S4W1 - Crypto Market Technical Analysis by @liasteem

Hi friends in the Steemit Cryptoacademy, hope you are always healthy and fine❤❤❤
I'm very happy to still be able to participate in a very interesting contest from @steemitblog in which the Steemit Crypto Academy Contest Season 4 Week 1 starts with the theme;
But before I explain Ebout the Technical Analysis, I would like to invite my friends @amryksr @b-naj @mahyulmaulana @sailawana @asiahaiss @ikramulmaulana @rizkiblangpadang in this contest.
How would you define Technical Analysis in the Crypto ecosystem? Mention its Importance
Technical analysis is a technique that is used to analyze and predict market movements or market trends by studying the movement of previous stock market data (the most studied are market volume and price movements) using the help of indicators as support. Well, from the history of market movements, this is then taken as an investment and minimizes losses and increases profits.
To learn more about how technical analysis works, there are 3 basic concepts of technical analysis;
1. Market psychology
Overall we have seen how market psychology affects market trends, an influence that brings many changes.
2. Price moves in a trend
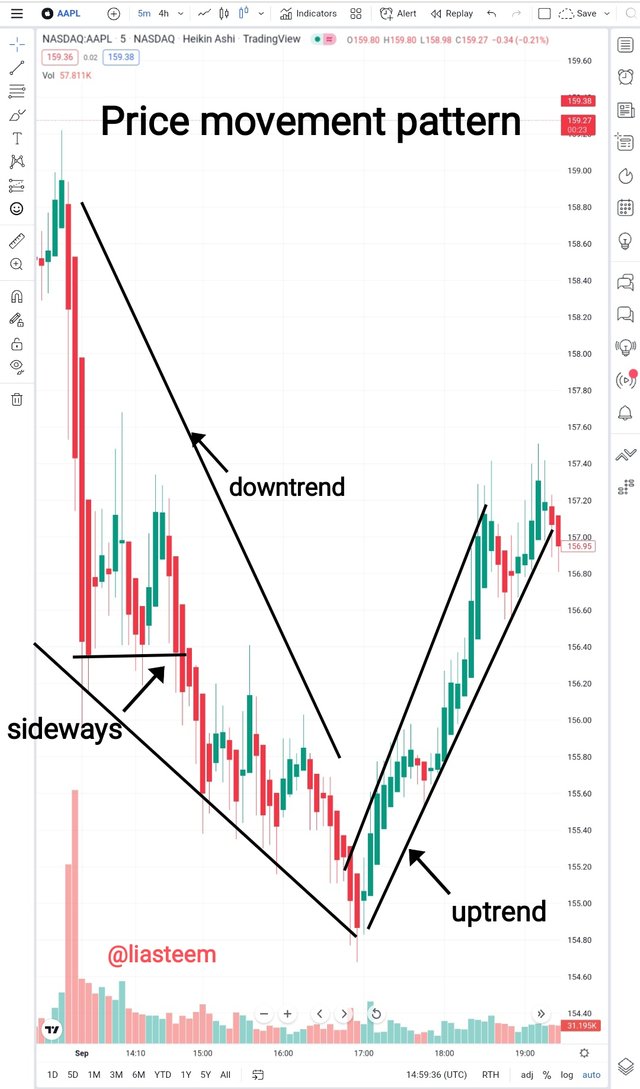
The price of a stock market can move in any direction, sideways, up or down which forms a pattern / trend from which traders can anticipate changes in the direction of the next trend.
3. History Repeats itself
The trend pattern that is formed always repeats itself, so market movements can certainly be predicted in patterns/trends or known as signals. Well, with this signal, traders anticipate and analyze market conditions by studying the signals that have been given before.
| Importance of technical analysis |
|---|
A key component of the stock market at any number of scales is technical analysis. From the three things above, we can conclude that Technical analysis is very important and useful for traders to know and analyze the direction of the previous trend because all patterns will always repeat themselves and because of this a beginner trader like me can more easily understand the movement of the next trend direction. And to learn more about how important technical analysis is I will elaborate on it through several other questions below.
Do you have practical knowledge of how to conduct technical analysis? Highlight some of the components of Technical analysis.
I was one of the students of the crypto academy for several seasons, and at that. There are many assignments with different materials given to us to increase our understanding of the topics taught by the Professors. we were taught to practice the knowledge and use a demo account to make some investments in the crypto market and most of what I did was technical analyst because it was very simple.
There are several important components in the analytical method, especially technical analysis which will encourage the sharpness of the trader's view in investing;
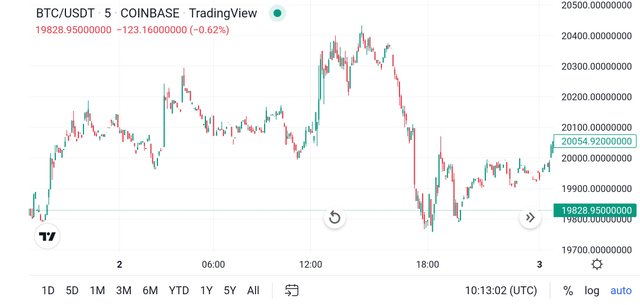
Technical analysts use the history of market movements, this can be clearly seenfrom within a certain period of time and the movement can be read in a graph. There are 3 kinds of charts that can be used to read the price of a stock;
- Line Charts
- Bar Chart and
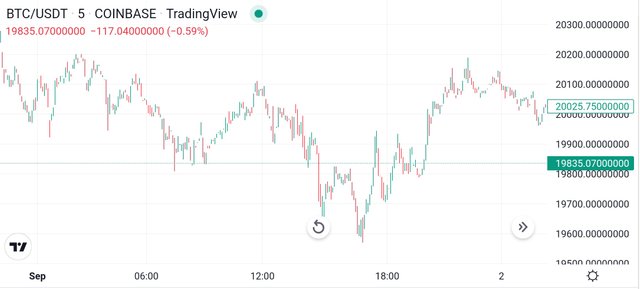
- Candlestick Charts
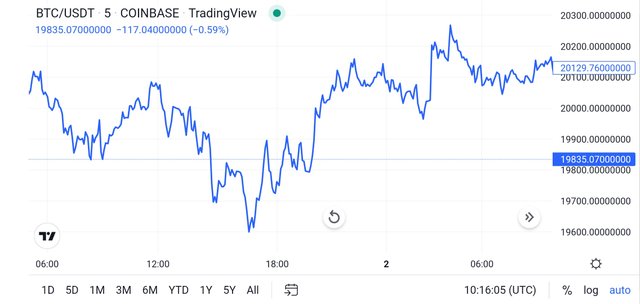
TradingView Platform
TradingView Platform
TradingView Platform
TradingView Platform
These three types of charts make it easier for us to analyze the movement of market trends, but Candlestick Charts are the most widely used because they are easier to analyze, provide faster direction change signals, and can be used with other technical indicators.
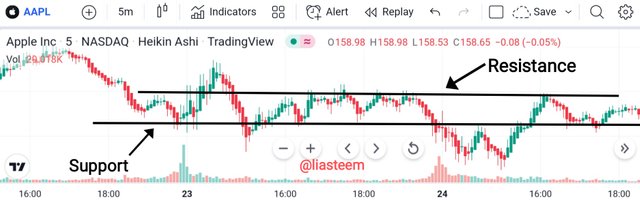
In my opinion, this is a basic component that all traders should know because by looking at these two lines we will be able to analyze which direction the next trend will move easily. Support is the basis for market movement for some time in the future while resistance will signal the peak of the stock price movement for a certain period of time.
Indicators are one of the most important components that are formed from volume, volatility, previous trends and also market prices, especially for beginners like me, where with indicators I can analyze market trends better and perfectly so that it will minimize my losses. There are lots of indicators that can be used and the use of the indicator indicator depends on how comfortable you are using it, but choose one that is simple but has good accuracy.
This is my explanation of some components that I think are important in market price analysis techniques that will provide more accurate information.
What do you understand by technical indicators? Do you consider them effective for trading cryptocurrencies? Which one is your favorite and how does it work? (Screenshots required where necessary)
technical indicators are mathematical formulas that function to find out current market movements so that this will help us to give buy or sell signals. Technical indicators are also an analytical technique to analyze price fluctuations over a certain period of time.
These technical indicators (known as technical) are focused on historical trading data designed to analyze market price movements in the short term (preferred) but can also be used to analyze market prices over the long term to identify entry points and get out.
We can study the types of basic telnis indicators;
- Overlays
This is a type of indicator where the same scale and price are used on stock charts. For example; moving averages and Bollinger Bands. - Oscillators
This is a type of indicator in which the local minimum and maximum are plotted oscillating above or below the price chart. Examples include the RSI, the stochastic oscillator, or the MACD .
Traders tend to use technical indicators a lot and this is very effectiveactive to provide information and analyze the direction of trend movement and with the function of indicators as a tool to help accurate trend direction so that it will minimize losses on a large scale or can get bigger profits, and of course the technical indicators used must have the suitability and comfort and understanding of traders against these indicators.
Which one is your favorite and how does it work? (Screenshots required where necessary)
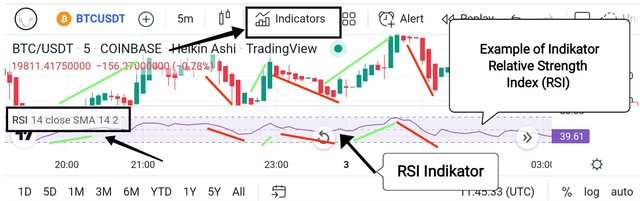
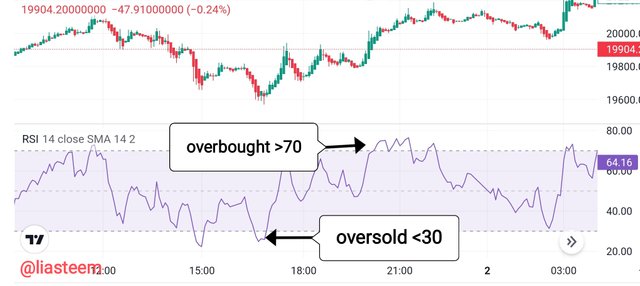
RSI This is my favorite indicator, because it can measure the speed and magnitude of changes in security prices quickly which is useful for knowing whether the market price is overvalued or undervalued. I also like the RSI technical indicator because just by looking at it I can analyze market techniques and it becomes very easy for me if at any time the market suddenly reverses, because this indicator has 3 lines attached on a scale of 30, 50 and 70 which allows giving signals when to buy and sell.
In using technical indicators, each has its own advantages of information, and this indicator is the one that can best allow me to predict and analyze market movements so as to place investments at the right time.
However, this indicator also has its drawbacks, namely when a sudden price reversal occurs, therefore I recommend using more than one technical indicator so that accuracy is also more perfect even in the event of a price reversal, using appropriate technical indicators and supporting other technical indicators , this will be very helpful.
Highlight the advantages and disadvantages of technical analysis. What's your advice to anyone about it?
After knowing the purpose of technical analysis more deeply and because this technical analysis is getting more advanced, then technology should definitely have advantages and disadvantages, and some of them are;
| Advantages of Technical Analysis; |
|---|
- gives an indication of a potential bullish or bearish
- identify a clear picture of the market Behavior pattern according to the time frame.
- helps investors to more quickly identify the direction of market price movements
- is considered to have a disciplined approach because it uses stop loss theory
- makes it easier to observe risk or market volatility
- Can be applied to all markets, without requiring an analyst to have a good understanding of each stock or market.
- The news that is displayed from the traded market with this technical analysis is clear in the history chart so there is no need to study it again.
| Lack of technical analysis; |
|---|
- It takes good and sufficient experience and practice to be able to identify chart patterns from historical market movements.
- because market patterns are sometimes repetitive, this is usually considered only a mere guess and makes people guess the market price movements so that for beginners it will have a big impact on the value of their future investments.
- Technical analysis is subjective to every trader, this is because they see one number as support while another as a resistance.
- late in providing analytical information when technical analysis is used for a long time.
My advice to anyone about it;
- Follow the trend
The current stock trend must be known so that when it happens you can buy stocks when they start to rise and immediately sell them when they start to fall. But you also have to consider this trend so that it doesn't turn against you. - set stop loss
Don't forget to set a stop loss when you start investing in stocks because you're afraid that when you think the trend will continue to rise and you leave your watch, don't get me wrong when you come back you will cry when you see a quick trend reversal and will consume all your assets. without you knowing. - use more than one indicator
We never know for sure how the next market trend will move even though we have used one indicator, sometimes when the market price suddenly reverses then the analysis displayed by one indicator can be wrong, therefore using two indicators will be more profitable andn gives us more accuracy in recognizing market price movements.
Nothing is more important but you yourself have to understand and learn about how to trade because with the knowledge you have and good analysis will minimize losses, being a trader must also be able to understand the techniques that exist in the crypto world so as not to misunderstand the market price movement.
.png)
nice sis @liasteem
Thank you very much,
I think went you get your status club you can follow the contest of steemit engagement Challenge in the community that choosing by @steemitblog
👍
You did a great job, sister
Wish you best of luck 💝🥰🥳
thank you dear,
Success always for you
👍
Back at you, ma pretty sista 😇💛
Great Crypto post. We've reshared it.
🙏🔁👍
Thank you very much @crypto.defrag
👍
I really don't understand and still have no knowledge about crypto. But I realize your post tell us much more. Good luck for the contest.
I invite you to visit my post too. Dear. Have a good night
Ia kak,
InshaAllah akan saya kunjungi sesegera mungkin
👍
A detailed post about Technical Analysis and how to do Technical Analysis. I got introduced to the third way in this post, which is history repeats itself. I have saw it, and now I understood how it works. It's not necessary that every time when History repeat the price will be same. Maybe the price can be different with the same pattern.
Correct me if I am wrong.
Prices differ on the side of the same pattern before,
Thank you for giving a good comment, wish you always success
👍
Same to you. Thank you.
Rencana loen neuk tuleh chit.
Bak loen kaloen tema, payah loen suruh bu @liasteem
Hahaha
Gadoh teuh, cuman ilon bek hana sagai, brosa lon tertarik karena postingan drneh bak cryptoacademy..
Mmbangkitkan semangat jiwaku
😁👍
Wate loen kaloen tema untuk minggu nyoe hana jadeh loen maju le, jadeh han tateume peulaku kegiatan laen menyoe takarata nyan.
Nyoe han loen tem
Yang membangkitkan jiwa droeneuh nyankeuh @sofian88
Hahahhah
😂😂😂
Luar biasa memang suami istri stemian hebat ban dua... Serba bisa
Hehehe
Kalo postingan lain mungkin bisa cepat selesai nya, tapi kalo ini butuh 2 hari penuh tgk,
😂
The RSI, is an indicator that surely almost all of us have configured in our charts, as it is a great support and quick measurement of the market trend, and gives us a vision of where the market is going to go now and when it is oversold or overbought. Excellent content, very complete, I congratulate you. Blessings
Thank you very much sista for reading and comment my post,
🤗👍
Good evening friend,
This an awesome indicator friend, you choose wisely. This indicator is similar to my favorite which is KDJ Indicator, it's also used to detect overbought and oversold in a market at a particular period of time.
Thank you very much for sharing
wishing you success
You are getting more experienced about crypto, this is good and I feel you will be much better, thank you for replying to my post
Good luck for your entry too @starrchris
👍