[Heikin-Ashi Trading Strategy]-Steemit Crypto Academy | S4W2 | Homework Post for @reddileep
Salam Prof. @reddileep ...
Hi steemian friends, all in all parts of the world.
How are you all friends?
Wish you always healthy and long life
Thank you for this amazing lecture, I am your new student, and this is a new knowledge for me, and I hope that all the assignments that you give me can be conveyed properly and correctly. If there is a mistake in this homework, I ask Prof. to correct it. For the attention of Prof., I say thank you very much.

.png)
1- Define Heikin-Ashi Technique in your own words.
The Heikin-Ashi Technique is a technique used by traders to identify a particular trend more easily and quickly, which is by looking at a green candle without a shadow to determine that the current trend is up and is a very strong uptrend, while the red candle is a very strong uptrend. filled with no shadows to determine that the current trend is down and is a very strong downtrend.
Heikin-Ashi Technique is a word that comes from Japanese which means Heikin means balanced and Ashi means foot or if translated into Average bar, which is similar to a candlestick chart but in its formation it uses certain formulas and algorithms so as to produce more accurate candlestick movements, making it easier analysis and give us a good hint of time to enter the market.
Candles in the Heikin-Ashi Technique usually have consecutive candle stick colors, and this helps traders to identify how the previous market moved easily, so that traders will only get valid signals. Heikin-Ashi candles are designed with a very subtle appearance in which this Heikin-Ashi candle is calculated from the data of the previous candle taking into account the open, close, high and low levels of the previous market trend.
2- Make your own research and differentiate between the traditional candlestick chart and the Heikin-Ashi chart. (Screenshots required from both chart patterns)
Look at the screenshot below,
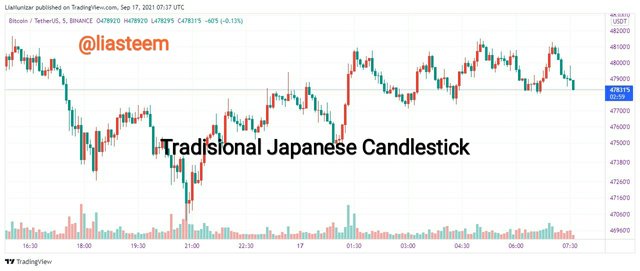
I use the same time frame, BTCUSDT (5m time frame), these two charts are very similar, but there are very important differences between these two types of candles, and I will describe them in more detail after I show the two types of candles in this chart.
- BTCUSDT (5m) using Traditional Japanese Candlestick
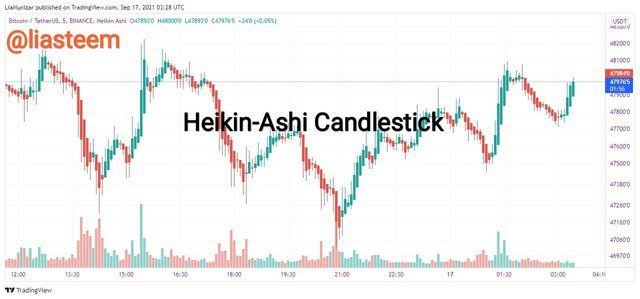
- BTCUSDT (5m) using Heikin-Ashi Candlestick
Well, as I said above, below are some of the differences between the two graphs above, and I also learned them from Prof. class. @reddileep Thank you very much Prof.
| Traditional Japanese Candlestick Chart | Heikin-Ashi Candlesticks |
|---|---|
| It is more difficult to identify the trend as the color of the candles turns out of balance. | It is easier to identify the trend because the candle colors turn out of balance. |
| The price in Traditional Candlesticks always corresponds to the market price. | The price in the Heikin-Ashi Candlestick always takes the average of the current market price. |
| Candles are usually opened from the close of the previous candle. | New candles are usually opened from the middle of the previous candle. |
| The chart on this Traditional Japanese Candlestick looks more complicated. | The chart on this Traditional Japanese Candlestick looks smoother. |
3- Explain the Heikin-Ashi Formula. (In addition to simply stating the formula, you should provide a clear explanation about the calculation)
To get more accurate results, the Heikin-Ashi technique uses a formula whose candles consist of open, close, high and low. And I will try to describe the formula one by one.
✓How to calculate the open
To calculate the opening of the next candle by adding up the previous candle with the close of the previous candle then dividing that number by 2 so that we know the average number produced. And the average result is the opening price of the next candle, and is usually at the midpoint of the previous candle.
How to calculate the close
To find out the closing of the Heikin-Ashi Candlestick, we must calculate the average generated from the above formula, namely by adding up the open, close, high and low prices of the candle then we divide by 4, and the result is the average number. And this average number is the closing of the candle.
✓How to calculate the high
To get the high of the Heikin-Ashi candle, we can look at the high of the current candle, or open, or close.
✓How to calculate the low
And to find out the low of the Heikin-Ashi candle, we can see from the maximum low value, open or close of the current candle.
4- Graphically explain trends and buying opportunities through Heikin-Ashi Candles. (Screenshots required)
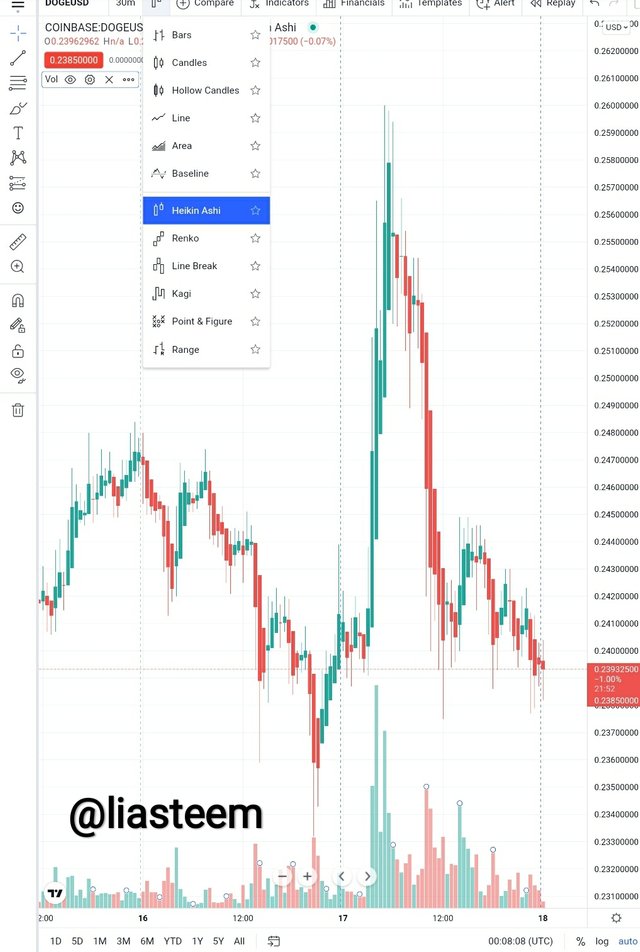
I will use the platform I usually use to explore the Heikin-Ashi technique, namely the TradingView platform. After we go to the TradingView page, and select the chart, then we click on the candles icon and select the Heikin-Ashi Candlestick, a page like the one below will appear!
- Trends
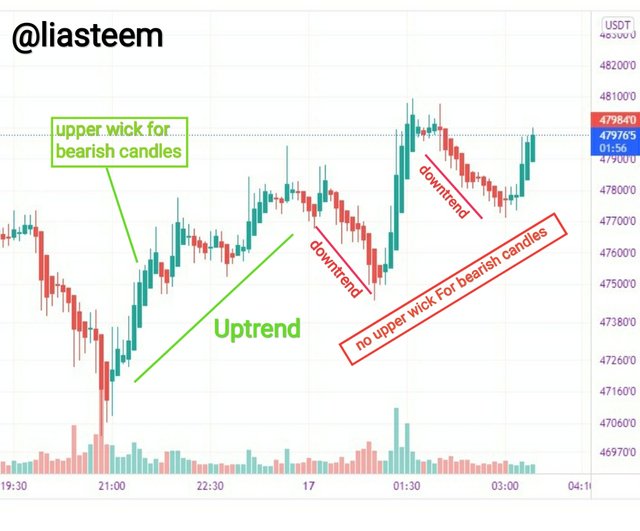
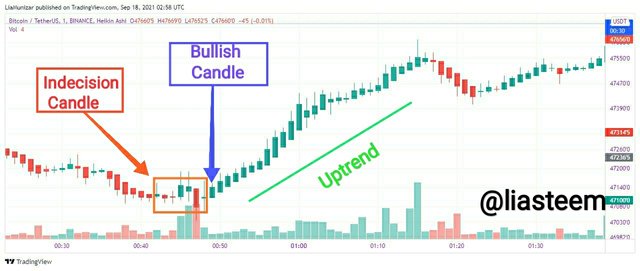
On the Heikin-Ashi candlestick chart, we can recognize the trend better than the Traditional candlestick chart where in the chart below we can clearly see the different colors of the candles and are very regular and move according to the current trend because it is calculated by the average number of each candles. We can also clearly see where the Strong Bullish candle, strong Bearish candle, and Indecision candle appear. And we can see the strength of the trend through the resulting candle shadow, if the trend is up then the candle has no down wick, and if the trend is down then the candle has no up wick. Take a look at the chart below!
- Buying opportunities
By using the Heikin-Ashi Candlestick, we will be very easy to identify the current market trend. As I explained above about the trend, if the Heikin-Ashi candle shows an upward wick, this means the market trend is bullish, and if the Heikin-Ashi candle shows a downward wick, then the market trend is bearish, and if the candle moves in doubt, and the Heikin-Ashi candlestick is in Bullish, this is our chance to use it as a buy signal, and vice versa, if the candle moves in doubt, and the bearish Heikin-Ashi candle is open, then this is an opportunity for us to use it as a sell signal. Look at the chart below to clarify my description above!
5- Is it possible to transact only with signals received using the Heikin-Ashi Technique? Explain the reasons for your answer
Yes, it is possible to transact only with signals received using the Heikin-Ashi Technique. Because the Heikin-Ashi technique produces candles with formulas and gets the average number, which then the average number forms a Heikin-Ashi candle. Actually, all the indicators that are available on the chart have their respective advantages, this all depends on our personal needs.
But we have to know what indicators we really need and have high accuracy, especially for a beginner like me, Heikin-Ashi gave me a clear and easy trend analysis. We are also recommended to use more than one indicator, so that we can filter out the false signals given. Especially when paired with indicators that match both. For example, like the Heikin-Ashi candlestick paired with the Exponential Moving Average indicator (55-EMA and 21-EMA), this will greatly help improve trading signals.
6- By using a Demo account, perform both Buy and Sell orders using Heikin-Ashi+ 55 EMA+21 EMA.
- Buy orders using Heikin-Ashi+ 55 EMA+21 EMA (BTCUSDT)
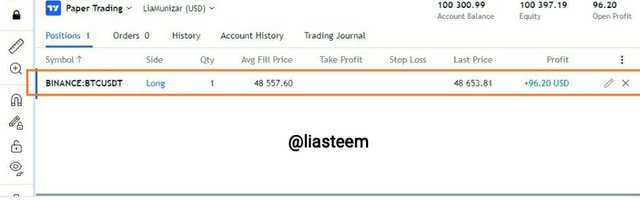
I will place an order By using a Demo account using Heikin-Ashi+ 55 EMA +22 EMA. I started to see the Indecision candle then I saw the Heikin-Ashi + 55 EMA + 22 EMA line is getting higher and I believe that this is where my buy order was placed. And after I noticed the pace of the Heikin-Ashi line, my trades started to gain profit. Take a look at the screenshot below!
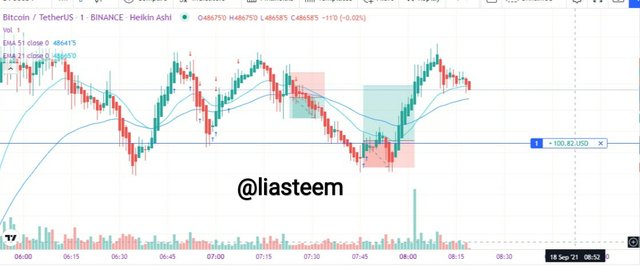
And the trades I did hit the TP target and even exceeded it.
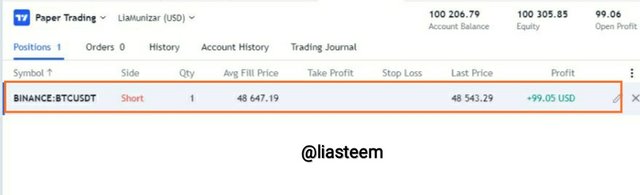
- Sell orders using Heikin-Ashi+ 55 EMA+21 EMA ( BTCUSDT)
As I do with buy orders, I also place orders By using a Demo account using Heikin-Ashi+ 55 EMA +22 EMA. I started to see the Indecision candle then I saw the Heikin-Ashi+ 55 EMA + 22 EMA line getting lower and giving a sign that this is where my sell order was placed. And after I noticed the pace of the Heikin-Ashi line, my trades started to gain profit. Take a look at the screenshot below!
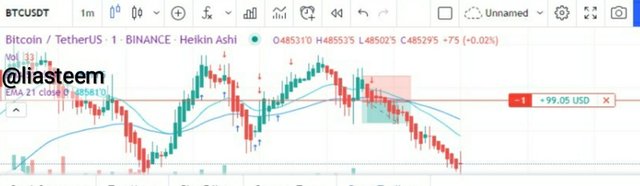
And once again I felt the benefits of Heikin-Ashi Candlestick and my trades reached the TP target and even exceeded it.
Conclusion
The Heikin-Ashi Technique is a technique used by traders to identify a particular trend more easily and quickly, which is by looking at a green candle without a shadow to determine that the current trend is up and is a very strong uptrend, while the red candle is a very strong uptrend. filled with no shadows to determine that the current trend is down and is a very strong downtrend.
On the Heikin-Ashi candlestick chart, we can recognize the trend better than the Traditional candlestick chart where in the chart below we can clearly see the different colors of the candles and are very regular and move according to the current trend because it is calculated by the average number of each candles. We can also clearly see where the Strong Bullish candle, strong Bearish candle, and Indecision candle appear. And we can see the strength of the trend through the resulting candle shadow, if the trend is up then the candle has no down wick, and if the trend is down then the candle has no up wick.

Thank you very much for such an interesting course, I apologize if I made a mistake in my homework, I feel very happy to be one of your students.
Salam...