Crypto Academy Season 3, Week 3 Homework post for @lenonmc21 ||Trends,Trendlines and Charts Patterns by @lhorgic
I want to specially thank prof. @lenonmc21 for this awesome lectured that was well delivered. I must say this subject matter is really key in determining your success in the crypto market. Here is my entry below
”Define in your own words what is a ‘Trend’ and trend lines and what is their role in charts.
TREND
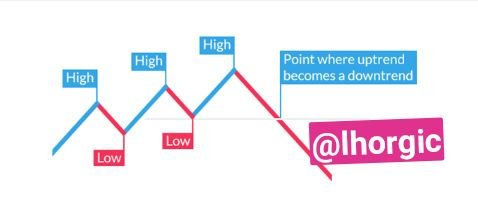
Trends can be defined as movement of price in a zigzag manner but follows a definite direction. The trend could either be an uptrend or a downtrend depending on the the flow. The trends changes directions based on the level of support and resistance that occurs during a trend movement.
TRENDLINES
Trendlines can be defined as a line that connect crucial point in a trend. It connect the low point in an upward trend and connects the highs in a downward trend. An upward trend can be identified by higher highs and higher lows while the downtrend is identified by lower highs and lower lows. Trend lines helps us spot crucial area where we can take advantage of demand and support in the market
One of the good assumption of following trend is that if it is well studied, you’re are to buy low at the bottom and sell off at the top.

Roles of trend and trendline in a chart
- it helps to past record of price movements.
- it is used to identify and confirm trends in a chart.
- it helps to predict the levels of support and resistance in a chart
- it aid market analysis
”Explain how to draw an uptrend line and a downtrend line (show a screenshot of each)
Drawing a trend line is very easy when you understand the dynamics of trends. I will be explaining how to draw a trend line for uptrend and downtrend.
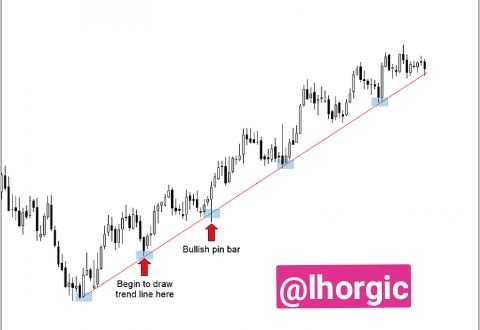
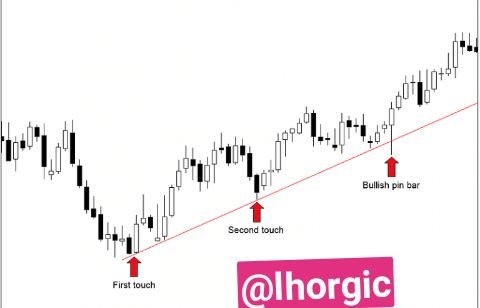
Uptrend Trend.
For you to draw an upward trend which are characterized with higher high and higher lows, you will need to first identify the first two swing lowers points and then take it up from there drawing the line which can continue in the uptrend manner or changes to the downtrend.
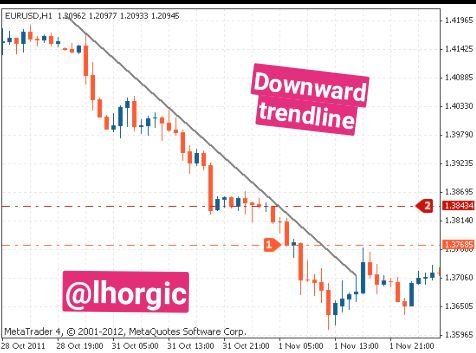
Downward Trend.
For you to draw a downward trend line, you will have to do the reverse of what we did for the uptrend, this time you will identify a high point and then followed by one or more lower highs and then draw the line. It will give you a downward sloppy view.
Other tips needed to draw a trendlines.
- always use a higher timeframe to draw a trendline, it is always accurate and reliable in a higher time frame
- try as much as possible not to force a trend line to fit as this may lead to inaccurate analysis that could make you lose your money at the end.
- take notice of overlapping in trend
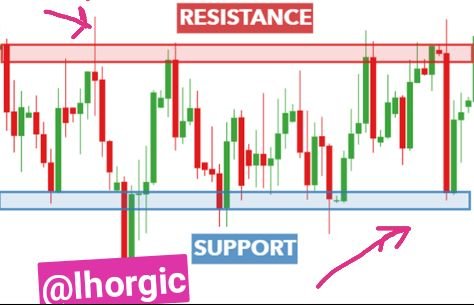
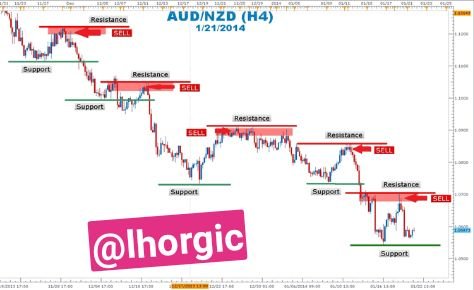
”Define in your own words what ‘supports and Resistances’ are and how we can identify both zones (show a screenshot of each one)
Support and resistance can be defined as one of the major aspect to take not of when analyzing a chat or trends. If this is successfully observed coupled with other indicators, one can record huge success in trading.
SUPPORT.
Support can be defined as the prices on a chart that plays a preventive role causing price not to fall below certain price. It prevent price from moving downward. Support happens or surfaces where downtrend is anticipated or predicted to stop and then a new turn [uptrend] takes over from that point which could last long or shortened as a result of demand and supply.
RESISTANCE.
Resistance can be defined as an area or point where price has gotten or risen to but unable to move beyond or break above. This is as a result of strong selling powers by the sellers. They do this to ensure that price does not rise further than it has gotten to. On of the assumptions about resistance is that as proce move closer to a resistance point, sellers are more likely to sell and buyers become less interested in buying and when this happens the price refuses to go above the resistance level.
”Explain in your own words at least 2 simple chart patterns with screenshots.
We have different types of chart patterns some of which I will like to mention below.
- Double Top Reversal
- Double Bottom Reversal
- Triple Top Reversal
- Triple Bottom Reversal
- Head and Shoulders
- Key Reversal Bar
- Symmetrical Triangle
- Rounding bottom
- Wedge e.t.c.
I will be using ‘Head and shoulder’ and Symmetric Triangle pattern as my example
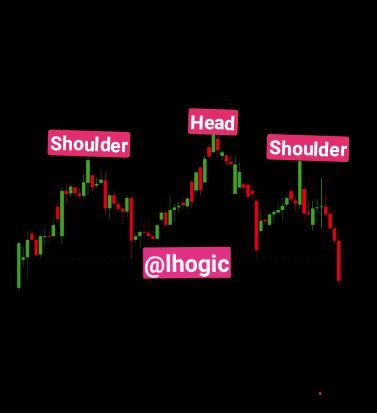
Head and Shoulder.
Head and shoulder chart pattern is a very common kind of chart pattern. It can be identified by a peak/height which have two other smaller peak on either sides of it. So in total we have about three point but the point in the middle is higher than the other two point making the shape of the chart like that of a body with a head and shoulders which are always on the same levels opposite each other. Another thing to note about this kind of chart is that it has what we call the ‘neckline’.
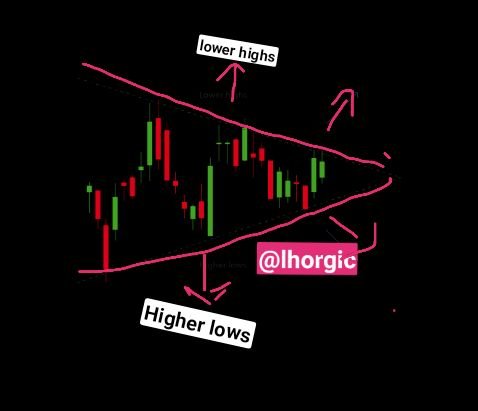
Symmetrical Triangular
This chart pattern normally continues in a particular trend and can either be bullish or bearish as the case may be. Symmetrical triangle occurs when there are many high and low points . According to the chat below, the dominant trend is the berish trend but we can also see that there have been an upward reversal movements too.
CONCLUSION.
Trend,trendline are very good way of studying the movement of price in the market. Support and resistance can help determine the trend as they play a major role telling us how demand[buyers] and supply[sellers] is affecting the market. Lastly, understanding different chat patterns can help us make a wise decision when doing your analysis and can bring in profitable return in your trading adventure.
Thank you so much for the lecture well taught and delivered, I hope you find my entry interesting.
Cc: @lenonmc21
Sort: Trending
Loading...