"[Trading Using Rectangle Pattern] - Crypto Academy / S5W4 - Homework Post for @sachin08".


Hello guys!!
I welcome you all to the season 5 week 4 of the steemit cryptoacademy. Professor @sachin08 has made a wonderful lecture concerning Trading Using Rectangle Pattern and it was well detailed and understandable. Below is my homework task for the lecture.
NO.1 EXPLAIN RECTANGLE PATTERN IN YOUR OWN WORD.
From my own experience or understanding, Rectangle pattern are also technical analysis traders normally use to predict the market price, this can be formed with a horizontal line placed at the top serving as resistance point and another horizontal line placed at the bottom serving as support point.
Note÷ we can't just draw rectangle pattern without identifying them on chart. This is mostly formed in ranging market. When the price moves up and down without making a particular trendline (uptrend or downtrend), this is where we can draw the rectangle pattern, by placing the resistance line at the top and then the support line below the trend.
In other words we should know that the rectangle pattern can be formed in the chart through two ways, which is, forming at the top of the chart which is called rectangle top and forming below the chart which is rectangle buttom. With this two things, traders can be able to predict which trend will take place, either buyer will take over the market or sellers will take over the market.
Also, we should know that during rectangle pattern, when there is breakout in the pattern, we should know that a particular trend is about to take place either up or down, after a ranging movement in the market price.
In a simple explanation, a rectangle pattern is a rectangular combination range whereby prices in the market move about or perambulate, this shows that the buying and selling intensity are equal, now the price could technically breakout among the two direction. Rectangle pattern are adaptable for traders to trade breakouts.
NO.2 HOW TO IDENTIFY RECTANGLES. EXPLAIN WITH SCREENSHOTS.
Like explained in the lecture, professor @sachin08 state that rectangle are rare is not that easy to find in price chart. Rectangles can be either found at the top of the chart or at the buttom of the chart. Now we will be looking for chart that forms a range market i.e the price must not go over or below a support or resistance point, the movemment must be equal this shows that buyers are seller are equally controlling the market, struggling on who to take over the market price. To identify rectangle, there, we must draw two trendline, one at the top and the other at buttom, this serves as support and resistance level, meanwhile, the price must hit the top horizontal line and goes down, touchinng buttom line and also pull back again, it continues trending like that till there will be a breakout of either direction. Note, the price must be atleast two or three touchess in both support line and resistance line. Below is the screenshot i provided.
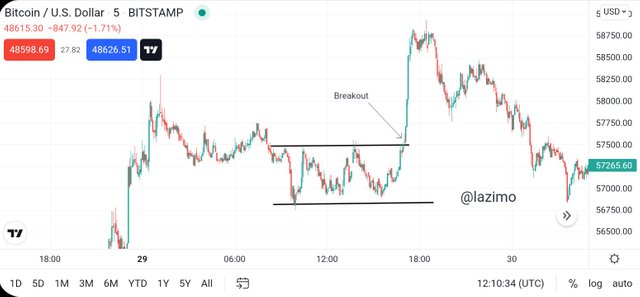
Looking at the screenshot i provided above, we can see the two trendline i drew, the upper trendline which serves as resistance level and the down trendline which serves as support level. We can see how the chart was moving between the trendline, which tells us that buying and selling forces are balance. So when you see a chart like this, that is where you can see or identify rectangle pattern.
NO.3 CAN WE USE INDICATORS WITH THIS PATTERN TO GET ACCURATE RESULTS? EXPLAIN WITH SCREENSHOTS.
Combining indicators after examining or analyzing the market using rectangle pattern, could give you accurate result, depending on the indicator you are making use of.
Now, lets say i have done my analysis using rectangle pattern, now i have also use an indicator with it so that i will get accurate result on how market will move or the next trend of the market. Lets see the screenshot i provided below.
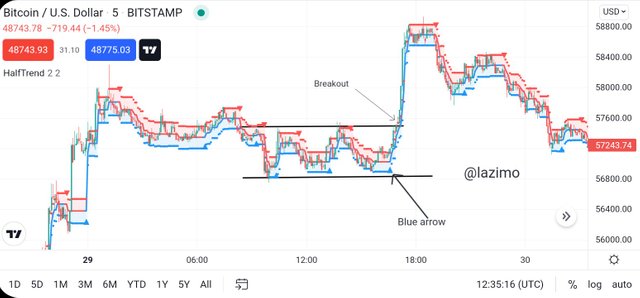
Now, after my analysis with rectangle pattern, i then added half trend indicator which is one of my best indicator i love using while trading. In half trend indicator, when there is a blue arrow or when a blue arrow appears on the chart, this means that traders are expecting the market to bullish and when the red arrow appears at the top of the chart, this means that traders ate expecting the market to bearish.
Now using the indicator along with the rectangle pattern, as you can see on the chart above, after my analysis using rectangle pattern, i added half trend indicator, now there was a blue arrow that appears under the chart, which shows me that the market will bullish. As we can see on the chart after the blue arrow, there was a massive bullish trend which lead to break of the resistance point.
NO.4 EXPLAIN RECTANGLE TOPS AND RECTANGLE BOTTOMS IN YOUR OWN WORDS WITH SCREENSHOTS OF BOTH PATTERNS.
In price chart, the rectangle pattern can be formed either at the top of the chart or at the buttom of the chart, this two indicates a specific thing, which i will explain.
The rectangle top in a simple explanation, can be found at the top of the chart, forming a ranging market, whereby buyers and seller can not be above to create a particular trend. Though when the rectangle pattern is located at the top of the chart, after forming a ranging market, this normally shows or tells traders that the market will bearish, the breakout always occurs in the support line and when there is breakout, the price tends to bearish, this is when trader usually short the market i.e selling opportunities. See screenshot below.
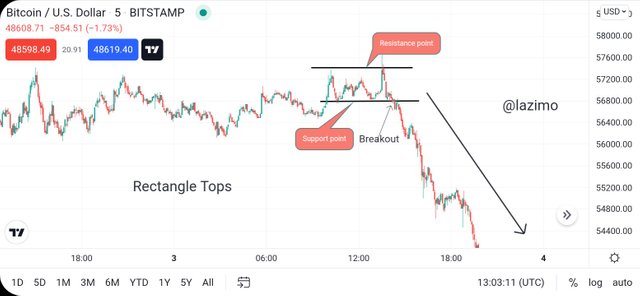
As we can see the chart above, this is a rectangle tops. You can see where the price formed a ranging market, where buyers and seller where not able to make a particular trend, untill there was a breakout which lead in massive bearish trend.
The rectangle buttom in a simple explanation, can be found at the buttom of the chart, forming a ranging market, whereby buyers and seller can not be above to create a particular trend. Though when the rectangle pattern is located at the buttom of the chart, after forming a ranging market, this normally shows or tells traders that the market will bullish, the breakout always occurs in the resistance line and when there is breakout, the price tends to trend up (bullish), this is when trader usually long the market i.e buying opportunities. See screenshot below.
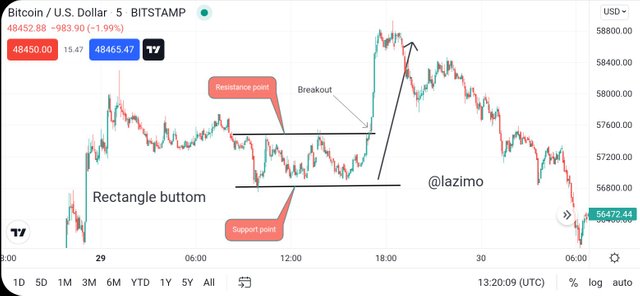
As we can see the chart above, this is a rectangle buttom. You can see where the price formed a ranging market, where buyers and seller where not able to make a particular trend, untill there was a breakout which lead in massive bullish trend.
NO.5 SHOW FULL TRADE SETUP USING THIS PATTERN FOR BOTH TRENDS. ( ENTRY POINT, TAKE PROFIT, STOP LOSS, BREAKOUT)
In this section, i will be showing full trade setup in both Rectangle top and Rectangle buttom, indicating my stoploss, take profit, breakout and also my entry point.
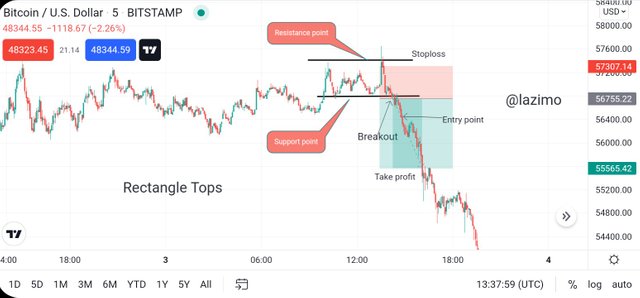
Looking at chart above is a BTCUSD chart, now as we can see when the price formed a rectangle top i.e price was moving up and down in the support and resistance line , so there was a breakout at 56755.22, then the market start trending down, i took my entry at 56400.00 and then set my stop loss above my entry price due to i was shorting the market, i set my stop loss at 57307.14 and i set my take profit below my entry point, which is at 55565.42. Now once the price trends down and hit my take profit, my order will execute, this means that am gaining profit.
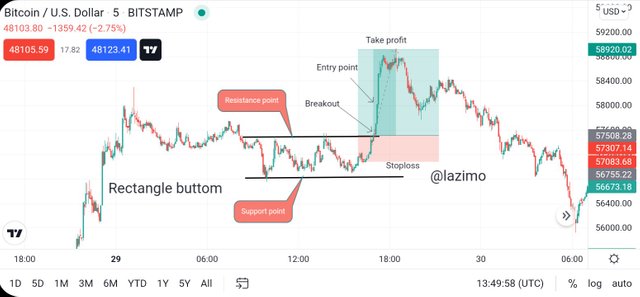
Looking at chart above is a BTCUSD chart, now as we can see when the price formed a rectangle buttom i.e price was moving up and down in the support and resistance line so there was a breakout at 57508.28, then the market started trending up. I took my entry 58000.00 and then set my stoploss below my entry price due to i was in a long position on the market, i set my stop loss at 57083.68 and i set my take profit above my entry point which is at 58920.02. Now, once the price trends up and hit my take profit, my order will execute, this also means that am gaining profit.
CONCLUSION
Rectangle pattern is one of the best analysis traders use in trading breakout i.e to know what trend will the price move, maybe either up or down. The lecture Rectangle pattern, was well detailed and i was able to learn a lot from it. I appreciate professor @sachin08 for the effort made in the lecture and for us to learn.
Thanks for reading
Cc-
Professor @sachin08