" [Confluence Trading.] - Crypto Academy / S5W6- Homework Post for @reminiscence01".


Hey friends!
It's another new week of the steemit cryptoacademy season 5. Professor @reminiscence01 has provided a wonder and well detailed lecture about confluence trading. Below is my homework task for this lecture.
1. EXPLAIN CONFLUENCE TRADING. EXPLAIN HOW A TRADE SETUP CAN BE ENHANCED USING CONFLUENCE TRADING.
In the lecture, we were taught that, when applying different tools or making different technical analysis and also adding indicators along with it is known as confluence trading. Now, to understand confluence trading in a simple way, this is a process whereby we as traders don't rely on one analysis or indicator in order to make a decision in the crypto market. Crypto are highly volatile, and we don't have to rely on a particular tool to make our trading decison. Now making use of different tool in order to make a trading decision or when to enter the market is seen as confluence trading.
These is what most traders normally do when trading, because if you depend on one strategy, the market might remove you and this means that you are loosing your money. So, i can say that is so much important for traders to apply different strategies before making a trading decision.
Also to explain more, confluence trading is a number of factors that is lining up together and after those factors line up together, it helped a trader to indicate buy or sell signal. For me, some of the factors to use, when trading with confluence, are support and resistance , Trend , moving average and indicators like RSI, stochastic.
In market trend, i can say that a trade setup can be improved by adding different strategies on a chart in order to make a good decision. The chart i provided below explains it.
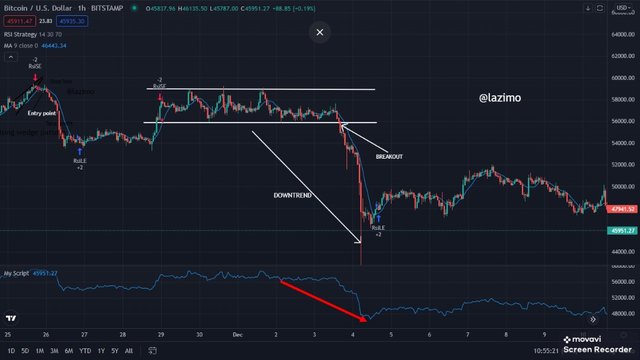
As we can see on the chart i provide above, i added multiple strategies to make sure that am at the right position to enter a short position. First, the market formed a ranging movment, whereby i drew my support and resistance line, so this is 5050 between buyers and sellers, it might breakout at the support level or resistance level. So i waited patiently for the breakout to occur. So there was a breakout at the support level, which means that the buyers have taking over the market, but i was not satisfy with that, i need to make sure am at the right position, so i added the RSI indicator, which also shows me signal that the market will bearish. Also i added the moving average. So i was can see, the market later went in a bearish movment.
2. EXPLAIN THE IMPORTANCE OF CONFLUENCE TRADING IN THE CRYPTO MARKET?
Like i explain the above chart i provided, where i added different indicators in order to make a good trading decision. Whereby the market shows me a bearish signal after the breakout occurs, but i wasn't that sure if the market will move down or not. So i have to make use of confluence trade, whereby i added different tools in the chart in order to confirm the trend of the market. Which also gives me a good signal to enter a short position.
SO LETS SEE TGE IMPORTANCE OF CONFLUENCE TRADING
Using confluence trading to trade in the market, makes a trader to make a perfect setup in the market.
Like i stated in the previous question, relying on one strategy is not advisable, now with the aid of confluence trading, a trader have assurance of the trading decision he or she made.
Sometimes, when we use an indicator or technical analysis to follow the market trend, it give false signal and this will make a trader loose his or her money. But with the aid of confluence trading, traders can be able to filter false breakouts or false signals.
With the aid of conflunce trading, it improved one's trading ability, i.e it helps traders to manage risk while trading so that there will be no much loss.
3. EXPLAIN 2-LEVEL AND 3-LEVEL CONFIRMATION CONFLUENCE TRADING USING ANY CRYPTO CHART.
Before making a trading decision, a trader should atleast use 2 level or 3 level confirmation confluence trading, so as to get a better result. I will explain below how to use both level in confirmation confluence trading.
When we are talking about 2-level confirmation confluence trading, its just when making use of two different tools or strategies to set up your trade and make a good decision in the market price. The chart below is the 2-level confirmation confluence trading i used.
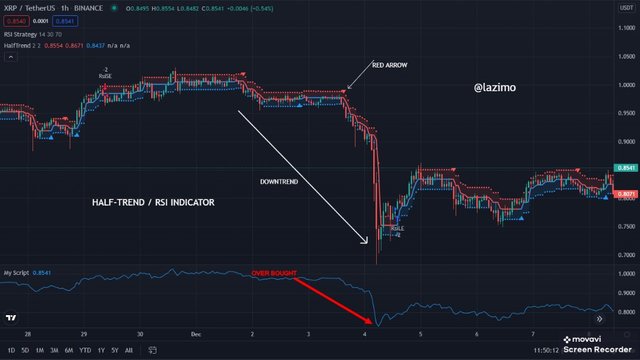
As we can see the chart i provided above, i'm making use of XRPUSDT. I used 2-level strategies i.e using two different tools to make a good decision while trading. I used half trend indicator and RSI indicator to analyze the market. Half trend indicator, signals to traders that when ever, a blue arrow appears at the buttom of the chart, this means we should take a buy position and whenever a red arrow appears at the top of the chart, we should take a sell position.
Now, the market signals a bearish trend and we can see that a red arrow appear at the top of the chart, which shows that a bearish trend is about occur. But we know this is not 100% sure, so i was not satisfied with it, so i have to add the rsi indicator. Which also signal the same bearish trend. This made me to be assured that the market will bearish. As we can see in the chart above, the market experienced a massive bearish trend.
When we are talking about 3-level confirmation confluence trading, its just when making use of three different tools or strategies to set up your trader and make a good decision in the market price. The chart below is the 3-level confirmation confluence trading i used.
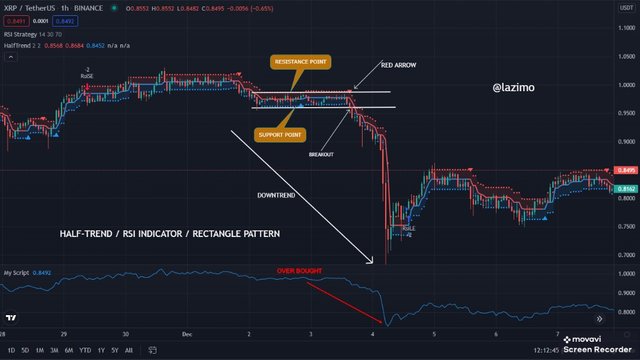
As we can see the chart i provided above, among the two strategies i used, i now added another one, making use of technical analysis, which is rectangle pattern. Rectangle pattern is one of the best tools used in trading breakouts. As we can see the signal it gave, after a range market was formed, there was a breakout, which lead to a massive bearish trend in the market.
4. ANALYZE AND OPEN A DEMO TRADE ON TWO CRYPTO ASSET PAIRS USING CONFLUENCE TRADING. THE FOLLOWING ARE EXPECTED IN THIS QUESTIOn.
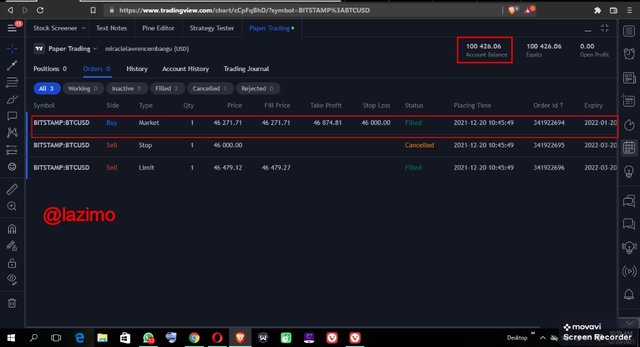
I will be performing analysis and open a demo trade using BTCUSD as my first asset. Now, am making use of paper trading in tradingview.com. lets see the chart below
I made use of 3-level confirmation confluence trade, in order to make a good trading decision.
IDENTIFYING THE TREND
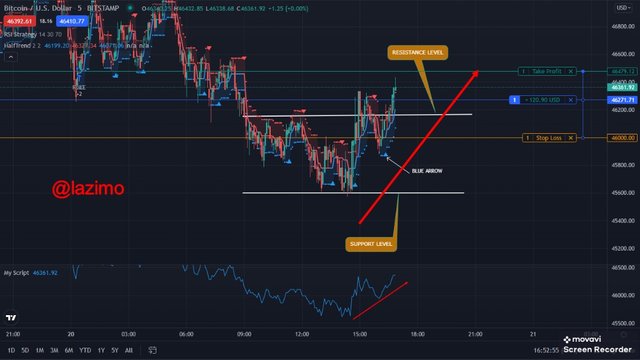
Now, as we can see the chart i provided its a 3 minutes timeframe. I watched how the price was hitting the support and resistance level. There was a first breakout at the resistance level, but it reversed back again and started bearishing, so i added half-trend indicator along with the support and resistance level i drew. Also i added the RSI indicator to get a specified signal for the trend. Finally, the half-trend indicator shows a blue arrow under the chart, which signals that a bullish trend is about to occur. I waited patiently, till there was a breakout at the resistance point and the RSI indicators also signal a bullish move.
Then i was fully assured that the market will bullish, then i took my entry [Long position] at 46361.92 then i set my stop loss at 46000.00 and then my take profit at 46479.12. Now the market keeps bullishing and my profit keeps adding, till it hits my take profit and executes by itself. See screenshot below. NOTE÷ I used 1 BTC to open this demo trade. That was why i made this huge amount of profit within minutes.
EXPLAIN THE STRATEGIES/TRADING TOOLS FOR YOUR CONFLUENCE.
Now, i like i stated earlier, i made use of 3-level confirmation confluence trade, which are , the support and resistance level, the Half trend indicator and the RSI indicator. The support and resistance are mainly use to trade breakout, which after a particular trend will take place. Then the half trend indicator is used to signal the trend that will occur next, when a blue arrow appears at the buttom of the chart, it signals a bullish trend and when a red arrow appears at the top of the chart, it signals a bearish trend. Now the RSI indicator, is normal when the price is been oversold, it signals a bullish trend and when it's been over bought, it signals a bearish trend. All this strategies are not 100% accurate, that is why is good to make use of confleunce trade in order to make a good entry or exit point. So this are the strategies i made use of, to open a trade and i made my profit.
WHAT ARE THE DIFFERENT SIGNALS OBSERVED ON THE CHART?
Support and resistance÷ this signals a bullish trend that is about to occur after there was a breakout at the resistance level, which i took my entry.
The half trend indicator÷ This indicator also signals a bullish trend after a blue arrow appeared at the buttom of the chart and the market started bullishing.
RSI indicator÷ This also signals to me that the market has been over bought, so a bullish trend will occur.
So with all this strategies, i was assured that the market will bullish, that was why i took my entry after the breakout.
I will be perform analysis and open a demo trade using ETHUSD as my second asset. Now, am making use of paper trading in tradingview.com. lets see the chart below
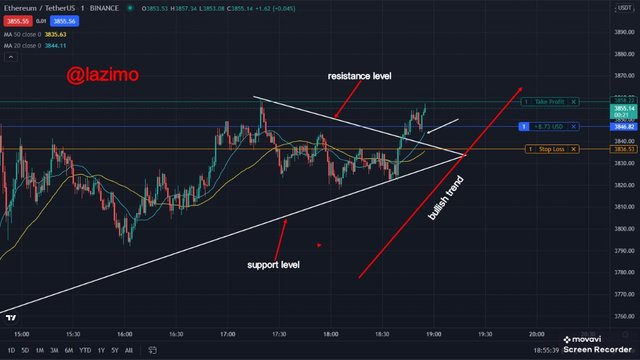
I made use of 2-level confirmation confluence trade, in order to make a good trading decision.
IDENTIFYING THE TREND
Now, as we can see the chart i provided above, its a minute timeframe. I made some technical analysis using the symetrical triangle pattern to analyze the chart. The price was hitting the support and resistance level and was bouncing back. So my target was for a breakout to occur either from the support level or the reistance level, so that i can open a trade. In this chart, using only the triangle was not enough to give me a specific signal, so i made use of 2-level confirmation confluence trade, where i added the moving average indicator, so as to get a better result about the trend.
I waited patiently for a breakout to occur and also waited for the 20 moving average in blue colour to cross above the the 50 moving average in yellow colour. When this occurs, it signals that there will be a bullish trend, but when the 20 moving Average crosses below the 50 moving average, it signals a bearish trend.
Now, there was a breakout at the resistance level as the market keeps bullishing. Then the 20 moving average crosses the 50 moving average, which i have full assurance that the market will bullish. Then i took my entry at 3846.82 and set my stop loss at 3836.53 and my take profit at 3858.22.
Now, as we can see the chart i provided, am making 8$ profit in my trade by a long position.
EXPLAIN THE STRATEGIES/TRADING TOOLS FOR YOUR CONFLUENCE.
Although, i have just explain the strategies i used but i will still explain it in a better understanding. I made use of 2-level confirmation confluence trade which are, technical analysis [symmetrical triangle] and a moving average indicator. Now using symetrical triangle means that you are expecting the a breakout to occur either from the support or resistance level.
Then, moving average, i used two moving average to analyze the market. I set the first one at 50 moving average[in yellow colour] and the other at 20 moving average[in blue colour]. Now, when the 20 moving average crosses above the 50 moving average, it signal traders that the market is about to bullish, but when it crosses below the 50 moving average, it signals traders that the market is about to bearish.
WHAT ARE THE DIFFERENT SIGNALS OBSERVED ON THE CHART?
Symmetrical triangle÷ It serves as support and resistance level which signals a bullish movement when there was a breakout at the resistance level or point.
Moving average÷ It also signals a bullish movement after the 20 moving average crosses above the 50 moving average.
The 2-level confirmation confluence trade i applied, gave me full assurance that the market will bullish.
CONCLUSION
Trading with confluence trade is one of the best way for a trader to be succesful during trade. Which also can help a trader to manage risk. Making maximum profits and minimum losses. The lecture carried out by professor @reminiscence01 was well detailed and understandable. Which also i learnt a lot from it.
Thanks for going through my post
Cc- professor @reminiscence01
Hello @lazimo , I’m glad you participated in the 6th week Season 5 of the Beginner’s class at the Steemit Crypto Academy. Your grades in this task are as follows:
Observations:
Recommendation / Feedback:
You did a great work. Thank you for participating in this homework task.