Steemit Crypto Academy | Season 3 - Week 3 || Introduction to Technical Analysis of Price Patterns: Homework Post by @imagen


Perform the staking on a platform of your choice.
I choose Pancakeswap for staking My Cake coins.
For this first, I need to connect my Trustwallet to Pancake swap.
On using BNB, first I need to buy cake, then do staking in pancakeswap.
Swapping BNB to Cake
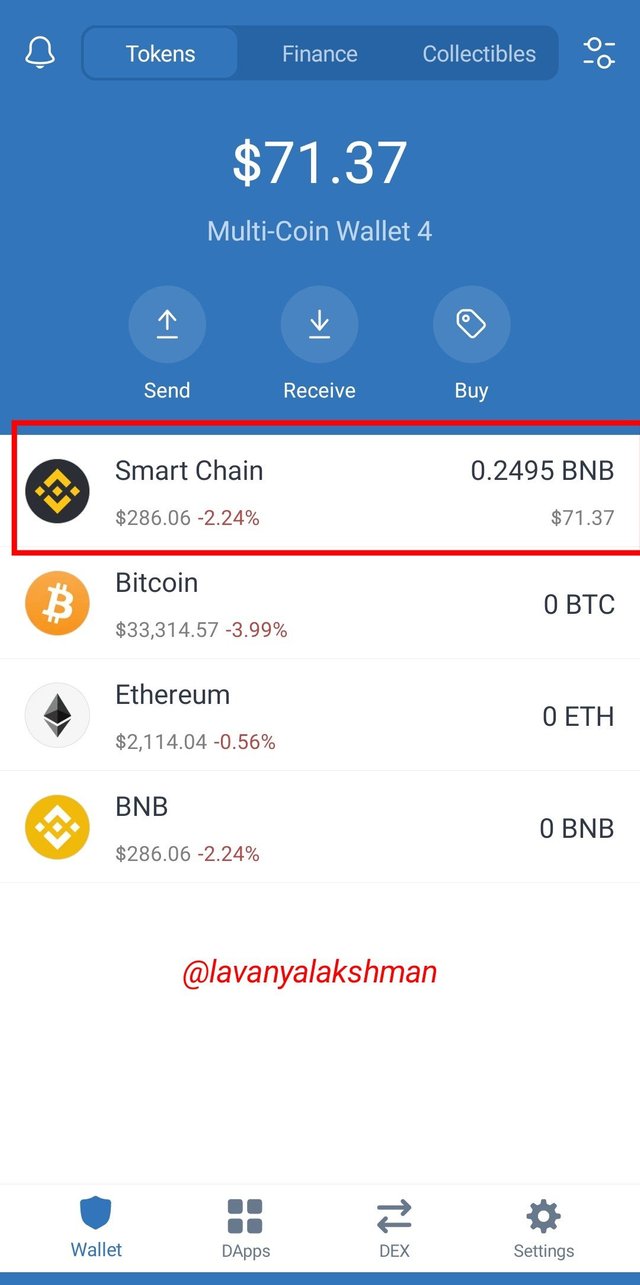
In my wallet, I have needed BNB.
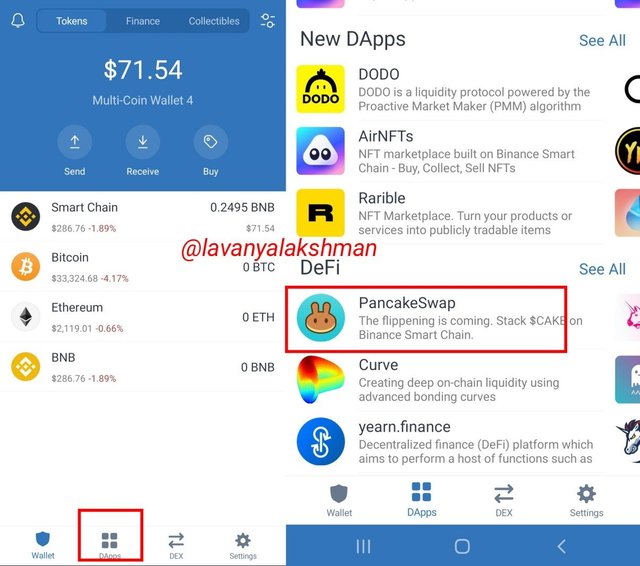
Now select Dapp, Then select Pancakeswap
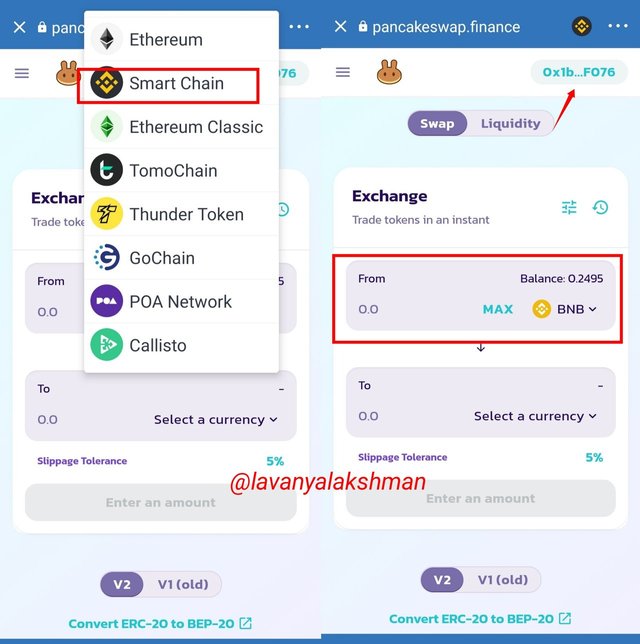
Before connecting your wallet first we need to change our network to Binance Smart Chain
Now my Trustwallet Successfully connect to Pancakeswap.
Now I go for swapping My BNB to Cake.
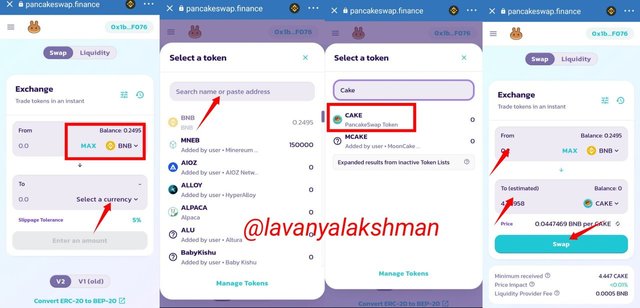
For This, I go for the Trade section, then select a cake.
After setting all necessary details I finish my trade.
Then select the Swap tab. Now I successfully Swap my BNB to Cake.
Those cakes automatically added to my wallet.
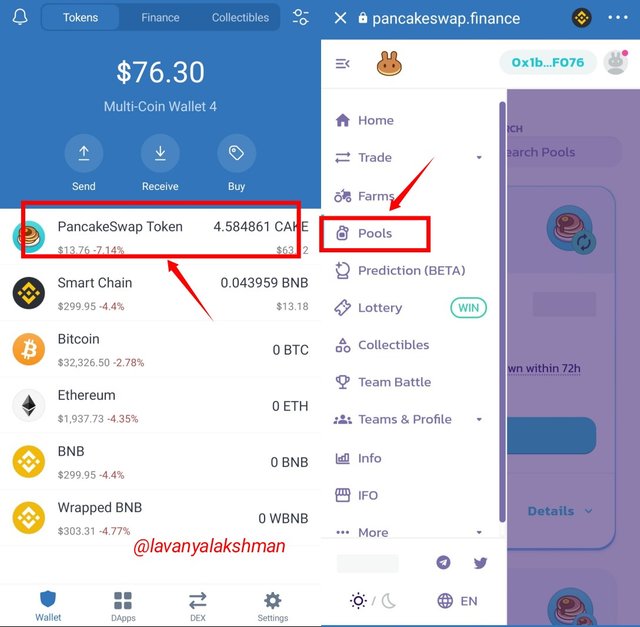
Here you can see my cake in my wallet.
Providing Cake In a Pool
In pancakeswap on providing our cake in the pool we get decent returns. So on holding in wallets, we can provide here and earn some interest on it.
In pancakeswap, there is Auto Cake Pool here we get 100% APY on our cake. So I choose this pool for providing my cake in the pool.
-For providing cake in the pool just select the Pool tab.
Then select the Auto Cake tab.
Before providing we need to Enable that pool on paying a little bit of gas fee.
Now click on the Stake tab, then provide how much cake you wish to provide in the pool.
On paying gas just finish that Transaction.
Now we Successfully provide our cake in the pool. When we need we can unstake, and swap any other coin as per our wish.
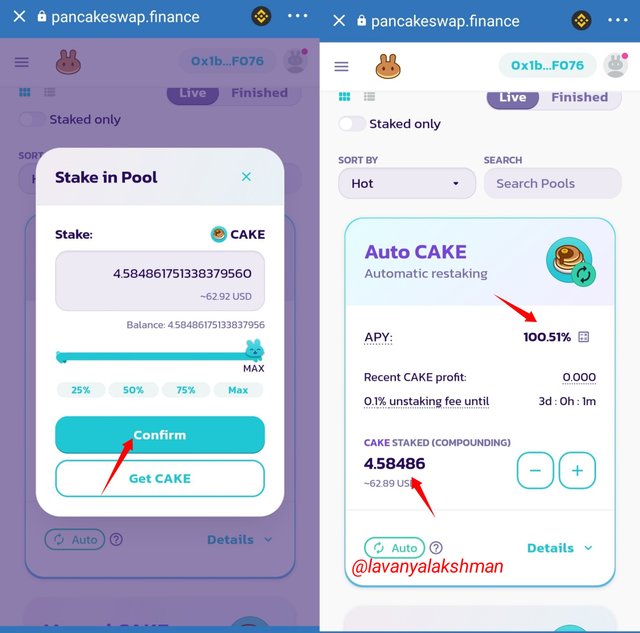
At present, I getting 100.51% APY. I provide around 4.58 cakes in the Autocake pool.
4.58 cake value in USDT around $62.89
Here I got 100% APY so per year I get $62.89 as interest. So total on unstable time I got $125.78
So per day, I got $0.17 as interest.
So at the end of the year, I got around 9.14 cake as per market price.
It's reasonable earning on our investment.
Like that we can calculate our earnings based on APY.
Pick 3 cryptocurrencies and perform a 7-day and 30-day technical analysis. Draw trend lines and describe whether the coins are in a continuation or reversal pattern.
For the Analysis price chart I using the Trading view.
For analyzing I choose BTC, ETH and BNB coins.
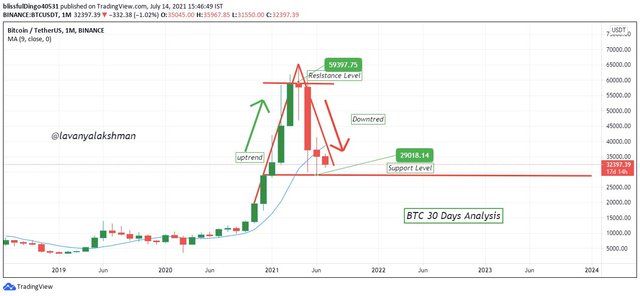
BTC Analysis at 30 days
On seeing the BTC chart at 30 days, we have a complete bullish trend in 3 months back, but now the complete bearish trend we have from the last 3 to 2 months. So here we see Trend Reversal now.
Here Trend gets a reversal from Uptrend to Downtrend.
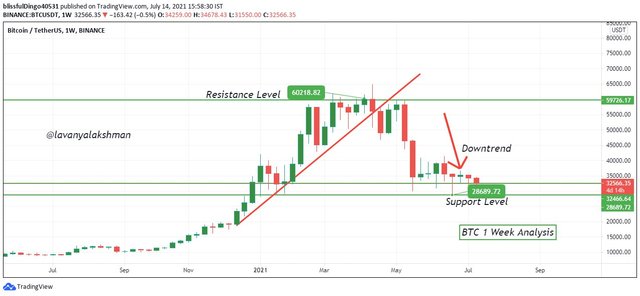
BTC Analysis at 7 days
On seeing the BTC chart at 7 days, we can see a trend reversal from bullish to bearish now. No changes we can see in 30 days to 1-week chart. Both showing bearish signs.
Around 12 weeks back we have a bullish trend, now that trend gets reversed so having a bearish sign. Hope soon we get another reversal but not sure where it gets a reversal.
Because now it is in the exact support area, need a strong pullback for seeing trend reversal. But at present Bulls are very week, Bears become very strong now. So need strong pullback for getting trend reversal again. Hope for the best.
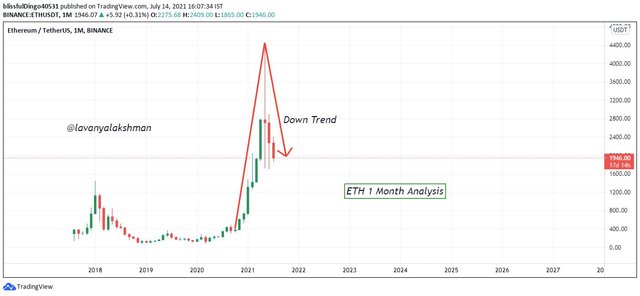
ETH Analysis at 30 days
If BTC is in a Downtrend no other Alts not in opposite direction, it also in a downtrend. If that project is very strong or having a good community also it must follow BTC.
At present BTC is in a Downtrend so ETH also in a Downtrend along with BTC. 3 months back both are in a bullish trend, now the trend gets reversed so it shows a bearish trend.
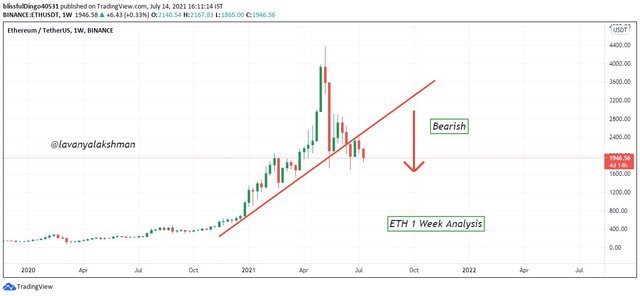
ETH Analysis at 7 days
In the weekly chart of ETH we see 1 green candle in 1 week before the chart, but due to BTC not break the previous trend line, so again it goes reversal.
But it a good sign for Alts rally, Now BTC stable in above 30k is enough for showing Alts strength. But BTC not in the stable so alts not possible to show their strength.
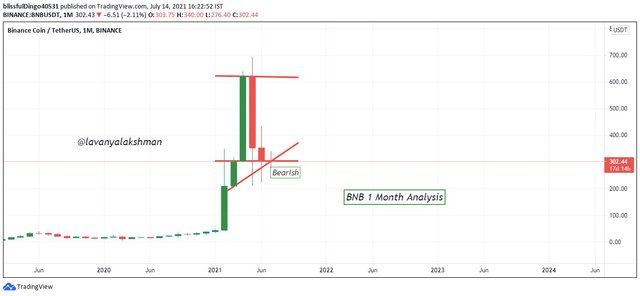
BNB Analysis at 30 days
This chart also looking the same as ETH. At present now we are in the trend reversal stage. Uptrend to Downtrend.
Last 2 to 3 months now we are in a downtrend, Hope again we get a trend reversal.
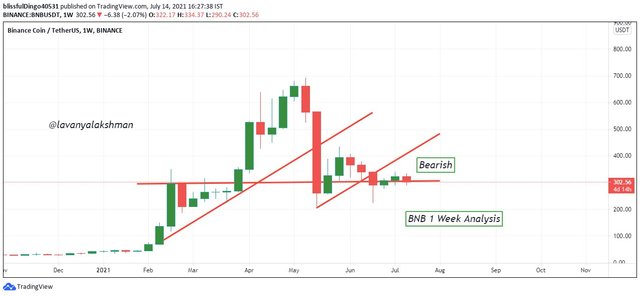
BNB Analysis at 7 days
In 7 days chart, we see 2 weekly green candles in 1 week before. Because it is Binance Native Coin, It having a lot of holders, whales as compared to others.
Last month there is one Launchpad Activity also that's why it gives 2 green candles, but it not possible to break it's the previous trend line, so now again it going in a downtrend.
2 months we are in an uptrend, now that trend gets reversal so now we are in Downtrend.
Almost all coins now in a downtrend, no coin we cont see in the opposite direction to BTC. Because BTC is the king of all other Alts, So it Must follow king movements.
How can we differentiate a bearish season from a bullish season in the market?
In Market, we always hear Bull or Bearish words. It represents the present Market Structure to us Indirectly.
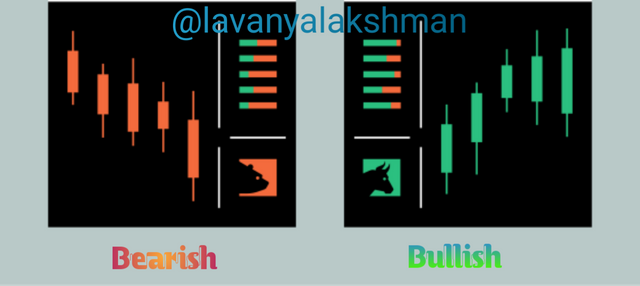
If you see a rising market then we call it a bullish market, if we see a fallen market then we say it's a bearish market for a sustained period of time.
What is Bull Season
In a bull market, we see demand get increase than supply, so a lot of traders show interest in buying as much as possible. So in this situation, we see the continuous raising of coin price in a certain time frame.
In this situation, we called Bullish Trend started in the Market.
Here all traders think from this point after this coin price must raise that's why all start investing in their money in bottom price, then they sell at a high price so they exit with profit.
Like those trends, we are known as Bullish season started in a particular time frame.
What is Bearish Season
It is quite opposite of Bull season. At this time Traders get fear of seeing the falling market, so start selling their holding, that's why we see dropping in coin price. No other traders do not show interest in investing money, so that coin prices start dropping continuously.
So like that Market condition, we called as Bearish Season.
In this Season we see No Demand at the same time Supply also increase. Because Traders start selling their holdings, so Indirectly they increasing coins supply in the market. No other traders not showing interest in investing their money, so no demand it gets, that's why that coin price start dropping to the bottom.
Here we see the Downtrend of a Market in a particular time frame. Then again we see a reversal trend too.
So in any Market, there is Bullish Season at the same time Bearish Season too. So always prepare yourself for handling both Market situations.
Conclusion
On staking our holdings we can earn decent profits in Downtrend Market also.
Don't sell your coins at loss, use staking or Savings opportunities until the Market get Stable.
Using Trendlines we can Analyze trend reversals very easily. Based on this we can take our positions.
If we see a rising market, then we say Bullish season started in a particular time frame.
If we see a fallen market then we say Bearish Season Started in a certain time frame.
Always keep in mind, if we are Bull Market, then is a Bearish Market in front of us.
In the same way, there is Bearish Market, There is Bullish Market in front of us.
- So always prepare yourself to face both situations, don't get afraid on seeing the fallen market.
Hope I finish all Tasks Correctly, If any verify Me
Thanks For Reading My Post
Thank you for participating in Season 3 of the Steemit Crypto Academy.
Congratulations, you made a great effort, however, the periods of time requested for the technical analysis are 7 and 30 days respectively and the graphs that you show in your assignment are of very long periods, corresponding to several months, which makes it difficult to use them. reading, and consequently, determine short-term patterns.
On the other hand, I suggest you use HTML tools to justify your texts in order to add greater visual appeal to your posts.
I look forward to continuing to correct your next assignments.
Sorry ,I understand your question wrongly,I think it is 7 day and 30 day chart analysis. But you ask give chart analysis in last 7 days and last 30 days analysis.
Now only i understand your question.
Are you give another chance,I will edit and repost It.
Here i miss understand the question. Sorry for that.
Thanks for Verify me.