Crypto Trading Strategy with Triple Exponential Moving Average (TEMA) indicator - Crypto Academy / S6W2 - Homework Post for @fredquantum
Hi all, In this today lecture from @fredquantum I learn another powerful I Triple Exponential Moving Average indicator.

Thank you very much for this wonderful and very useful lecture to us.

What is your understanding of Triple Exponential Moving Average (TEMA).

Triple Exponential Moving Average (TEMA) is also one type of Technical Indicator. Most traders prefer this indicator because of its accuracy and fastness.
Triple Exponential Moving Averages closely follow Current Price fluctuations in the market. That's why with help of TEMA we can easily identify present Trends without any lag.
It looks like simple Moving Averages but there is a lot of difference between those. It generates a signal based on Multiple Exponential Averages of the Original EMA along with Subtracting out some of the lag.
That's why it generates signals based on present market conditions. So an applying on our chart, we can easily identify Trend, Trend reversals, Support and Resistance levels very easily.
Triple Exponential Moving Averages we use the same way as Moving Averages. We can use identify Market direction based on TEMA angle slope.
If Slopes moving upward direction then it an indication for Uptrend, If it shows downtrend angle slope, then it an indication for Bearish Market.
Here TEMA, act as support/Resistance based on Market Conditions.
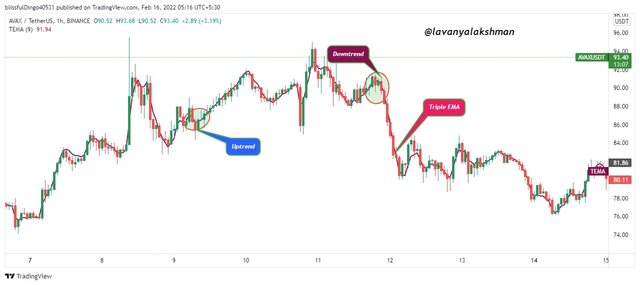
At first, this indicator was developed by Patrick Mulloy for reducing lagging associated with other Moving Averages. At first, this indicator was mostly used in Stock Market, then after adopted to Crypto Market too.
This Indicator is very useful for short-term and day trading needs.

How is TEMA calculated? Add TEMA to the crypto chart and explain its settings.

Any indicator generates signals based on Mathematical calculations only. Before applying those for our needs must know its Formula, on which base it generates a signal to us.
From this, we get more knowledge on Indicator behaviour, so possible to get profitable and easy trades always.
Triple Exponential Moving Averages Calculation
The formula for Triple Exponential Moving Averages is:
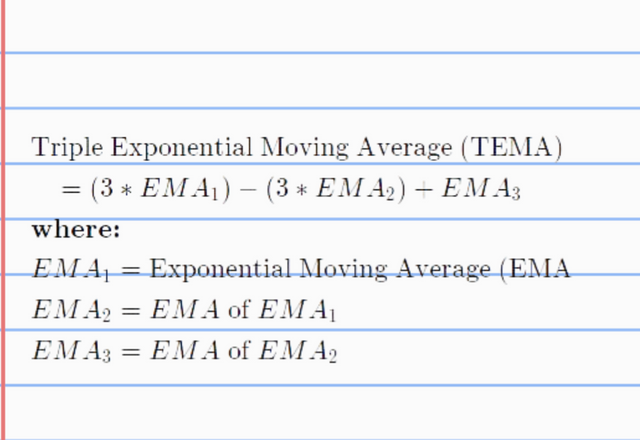
For calculating Triple Exponential Moving Averages:
First, we need to calculate EMA for our desired periods. It is EMA1
Then calculate this means of EMA1 Using the same periods. This means if you calculate 10 periods of EMA, again here also apply 10 periods only. It is EMA2
Now again calculate the EMA of EMA2 using the same periods.
Now apply all those records into the above formula we get TEMA.
Like that TEMA generate signals based on its Math Calculation.
Applying TEMA On our Chart
For this illustration, I choose TradingView platform. Because here we get all types of indicators and very easy to access.
First, choose your needed price chart for applying the Indicator.
For Example here I choose AVAXUSDT Chart.
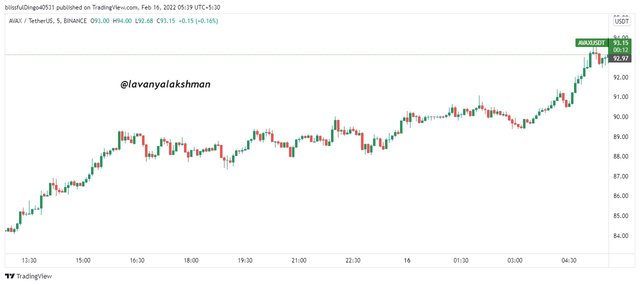
Then go Indicator Tab, in the search bar just type TEMA. From the Dropdown menu select Tripe EMA.
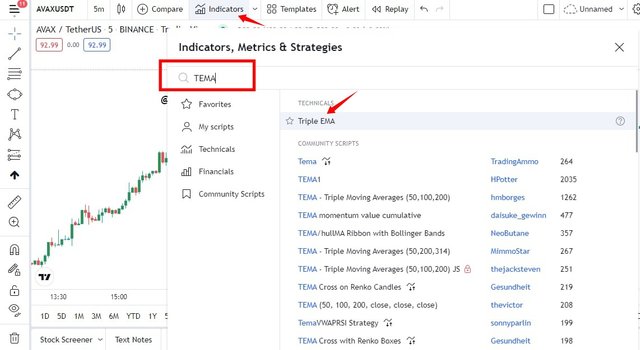
Now it's successfully added to our desired chart.
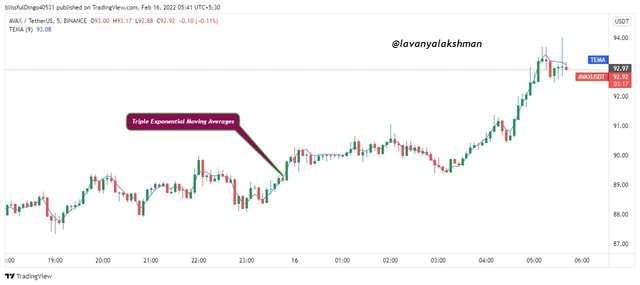
Like that we can add TEMA for any needed chart very easily.
Triple Exponential Moving Average Configuration
Based on our needs we can also edit TEMA Indicator settings as per our needs, Just selecting the Setting tab of TEMA.

TEMA Inputs
By default inputs for TEMA is 9. It is most suitable for short term trading needs.
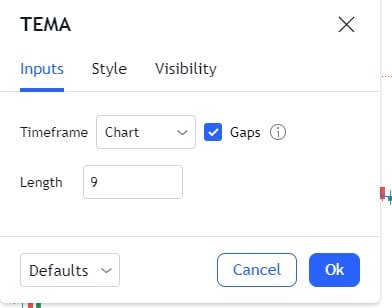
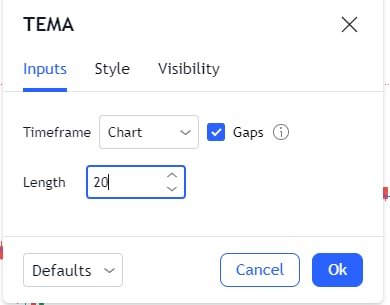
But those we can change for our needs. For the short term to Mid-term trading needs we can change those input values 20,21,25. .... , for long term needs 50,100... As per our wish.
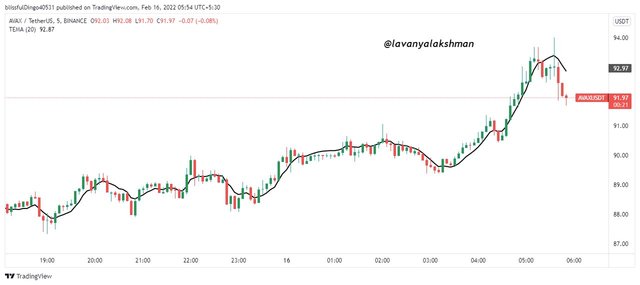
For example, here I change inputs from 9 to 20.
Now chart looks like as bellow.
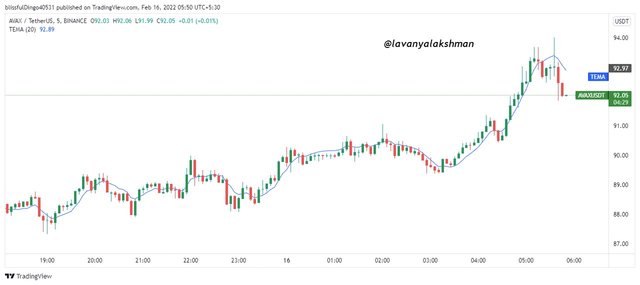
Like that we can change TEMA, Inputs as our trading strategy needs.
TEMA Style
By default style of TEMA, look like below.
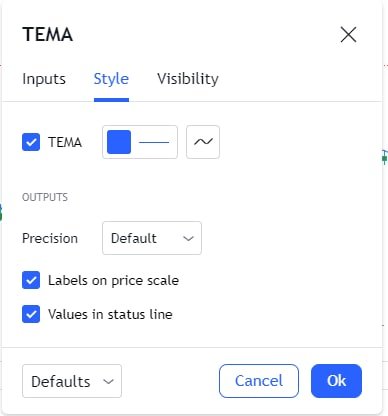
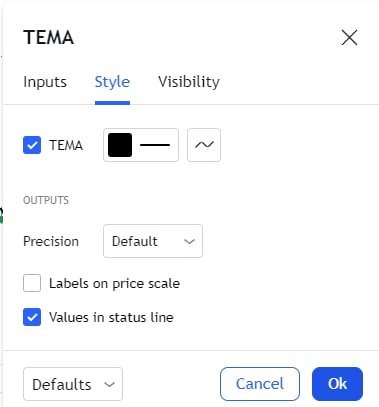
Those we can change as per our wish. For example, here I changed the TEMA colour from Blue to Black and removed its Lable on the Price Scale.
Now chart looking like as follows.
Like that we can change the TEMA Indicator style as per our wish very easily.
Visibility Of TEMA
There is nothing to change TEMA visibility, but we can change it if you need.
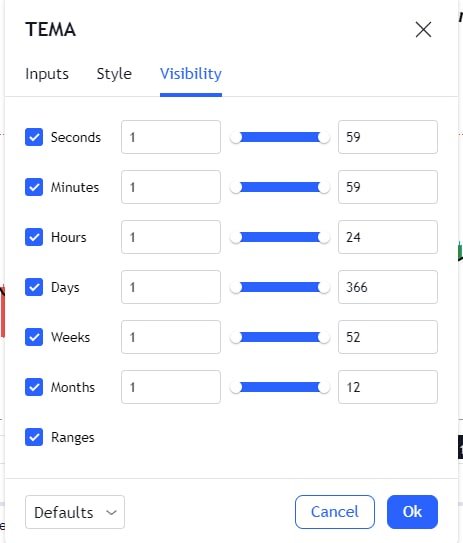
Like that we can edit Triple Exponential Moving Average Indicator settings as per our needs. But applying by default values is always recommended forgetting profitable trades.

Compare TEMA with other Moving Averages. You can use one or two Moving Averages for in-depth comparison with TEMA.

We already learned TEMA closely follow present price action compared to other Moving Averages. For understanding, those let differences between here I compare the Triple Exponential Moving average with the Exponential Moving average, and try to compare TEMA, SMA, and EMA too.
Comparing the Triple Exponential Moving Average(TEMA) With Exponential Moving Average(EMA).
The main goal for developing TEMA is, to eliminate lag compared to other Moving Averages.
That's why TEMA respond very faster along with Present Market conditions. That's why it shows the present Trend and Trend direction accurately based on present Price Action.
TEMA follow price action very closely, that's why it gives hints to us for upcoming trend, trend direction, support and resistance levels.
But coming to Exponential Moving Averages, It takes time to respond according to price action. That's why it lags behind the price. If we trade with help of EMA, There are high chances to lose some key swings and good opportunities.
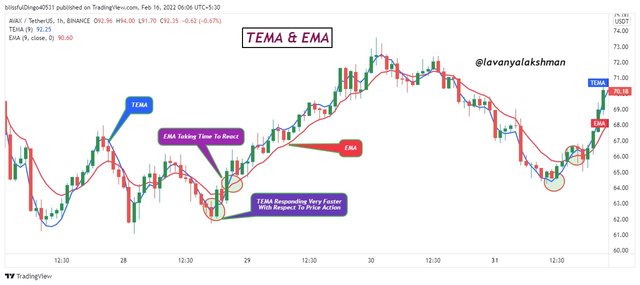
Just observe the above chart we understand clearly. Here I apply the same periods for both indicators on my chart.
When the market gets Trend Reversals first we get a signal from TEMA, then after EMA follow.
This Means TEMA gives signals to us very faster along with price action movement. But coming to EMA it lagging. So it gives the signal to us a little bit slow compared to TEMA.
For short term trading needs applying both indicators on our chart, taking a decision based on it is a good choice besides any one indicator alone.
Comparing the Triple Exponential Moving Average(TEMA) With Exponential Moving Average(EMA) along with Simple Moving Averages.
Coming to Simple Moving Averages it's a lagging indicator compared to other Moving Average Indicators.
Because it gives a signal on calculating Averages of Price Action on our giving period. So here it took time to generate a signal based on present price action.
That's why we are known as the lagging Indicator. If traders do trading with help of the SMA Indicator alone, then there is a high chance to lose a lot of good opportunities in the market.
If we compare SMA with TEMA and EMA indicators, SMA responds very slow than the other two. First TEMA responds, then after EMA start following close to price action. Finally, SMA starts following.
Just observe bellow chart for a better understanding.
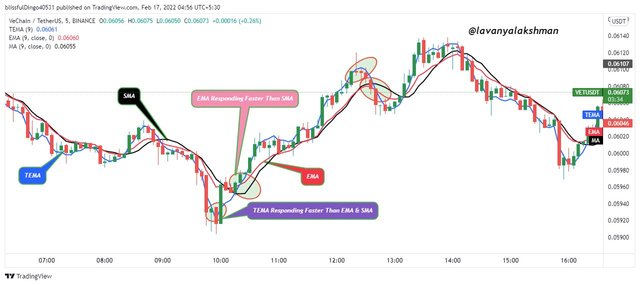
Here I apply 9 periods for all Indicators. On observing the chart I notice, whenever we get Trend Reversals, TEMA responds very faster and gives a signal regarding Trend Reversal.
Later EMA starts following closer to that Market change, then after MA also start moving regarding that present price action direction.
So for short term trading needs, TEMA is a better choice than EMA & SMA. But for eliminating false signals from TEMA, We must apply the other two Moving Average indicators along with TEMA is recommended.
Because of this we can easily eliminate some sudden spicks and dumps in the market.
Here TEMA acts as Dynamic Support in Uptrend Market. Similarly, it acts as Resistance in Downtrend Market.

Explain the Trend Identification/Confirmation in both bearish and bullish trends with TEMA (Use separate charts). Explain Support & Resistance with TEMA.

We already learned Triple Exponential Moving Averages are Trend following indicators. So by using it we can easily identify present Trends and Upcoming Trend Reversals very easily.
For identifying Trends we must observe price action along with TEMA angle direction.
If the TEMA angle moves upward direction along with price action, then it indication for Bullish Trend. Here Price action also moves just above the TEMA line.
Similarly, If the TEMA angle moves downward direction along with price action, then it is an indication for Bearish Trend. Here Price action also moves just below the TEMA line.
Identifying Bullish Trend With Help Of TEMA
For thing, the TEMA angle moves upward direction along with price action. For confirmation just wait for price action to move a little bit higher than the TEMA line.
Here TEMA acts as Dynamic Support for this specific period.
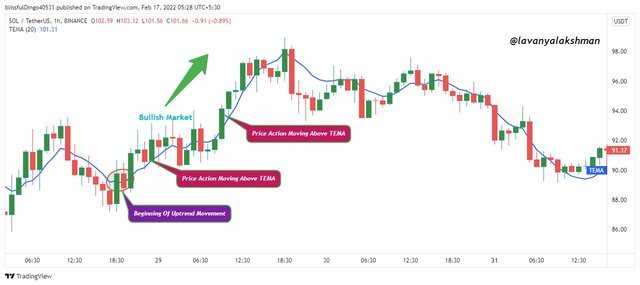
In the above chart, when TEMA shows angle change from Downtrend to Uptrend, it's a signal for the upcoming Bullish Market. Along with the TEMA angle, Price action also starts moving Upward Direction. It strongly indicates Uptrend Market we get soon.
This Uptrend Market continue until the TEMA angle changes its Direction.
Identifying Bearish Trend With Help Of TEMA
For one thing, the TEMA angle moves Downward direction along with price action. For confirmation just wait for price action to move a little bit lower than the TEMA line.
Here TEMA acts as Dynamic Resistance for this specific period.
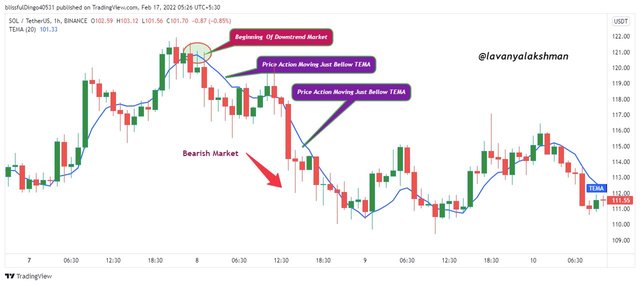
In the above chart, when TEMA shows angle change from Uptrend to Downtrend, it's a signal for the upcoming Bearish Market. Along with the TEMA angle, Price action also starts moving Downward Direction. It strongly indicates the Downtrend Market we get soon.
This Downtrend Market continues until the TEMA angle changes its Direction.
Like that we can easily identify Market Trend weather Bullish/Bearish with help of Triple Exponential Moving Average very easily.
TEMA and Support
TEMA indicator serves as Dynamic Support based on Price Action. This means it acts as Dynamic Support in Uptrend Market, along with in Downtrend Market when price action gets rejection and moves upward direction, in that situation also act as Dynamic Support.
This means when Price Action changes its direction from Bearish to Bullish, their TEMA serve as Dynamic Support.
With help of TEMA, we can easily identify Trend Reversals, Pullback points very easily.
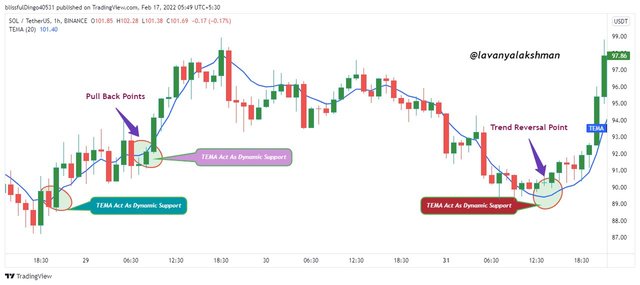
In the above chart just observe slowly we can understand how TEMA serve as Dynamic Support.
In an uptrend market, when we get pullbacks there TEMA serves as Dynamic Support. Along with when we get Trend Reversal from Bearish to Bullish, here also TEMA serve as Dynamic Support.
So with help of this, we can do Short term trading with good risk management very easily.
TEMA and Resistance:-
TEMA indicator serves as Dynamic Resistance based on Price Action. This means it acts as Dynamic Resistance in Downtrend Market, along with in Uptrend Market when price action gets rejection and moves Downward direction, in that situation also act as Dynamic Resistance.
This means when Price Action changes its direction from Bullish to Bearish, their TEMA serve as Dynamic Resistance.
With help of TEMA, we can easily identify Trend Reversals, Pullback points very easily.
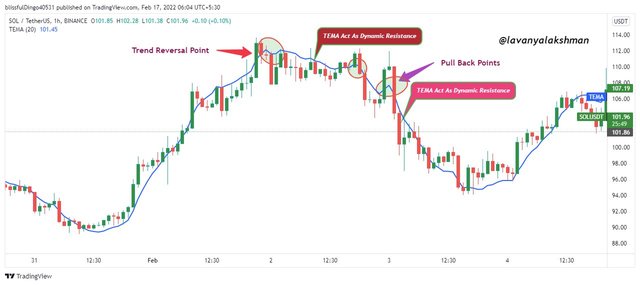
In the above chart just observe slowly we can understand how TEMA serve as Dynamic Resistance.
In a Downtrend market, when we get pullbacks there TEMA serves as Dynamic Resistance. Along with when we get Trend Reversal from Bullish to Bearish, here also TEMA serve as Dynamic Resistance.
So with help of this, we can do Short term trading with good risk management very easily.
Like that Triple Exponential Moving Averages sears as Dynamic Support/Resistance according to Price Movement in that Present Market.

Explain the combination of two TEMAs at different periods and several signals that can be extracted from them.

Before we learn how Triple Exponential Moving Averages helps us to identify Trend and Trend reversals.
Also, we learn TEMA react faster according to present price action. So sometimes it may give false signals too.
To eliminate those false signals, we can apply Two TEMA indicators on our chart with different periods. One set shorter period, another one for longer periods.
If the shorter period TEMA move above Longer Period TEMA, then it signals for the upcoming Bullish Market.
Similarly shorter period TEMA move below Longer Period TEMA, then it signals for upcoming Bearish Market.
For better understanding here I try to explain with the chart. Along with I apply 9 and 21 periods TEMA for short term trade illustration.
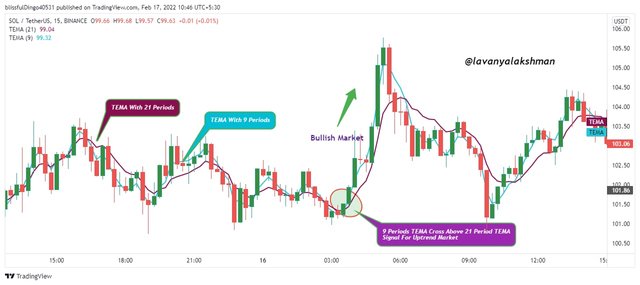
In the above example, when 9 period Triple Exponential Moving Averages cross above 21 periods TEMA, Its signal for upcoming Bullish Market.
So here we can place our But longs with tight stop losses. Because crypto is a highly volatile market, always maintain Stop losses.
Similarly, for identifying Bearish Market just study the below chart.
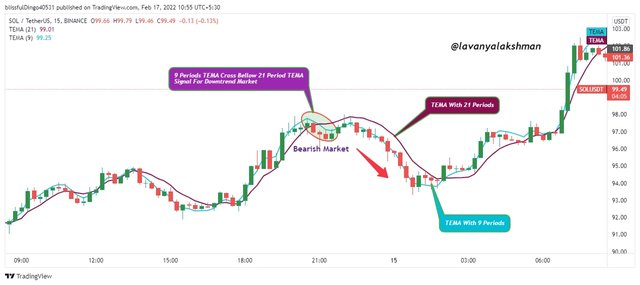
In the above example, when 9 periods Triple Exponential Moving Averages cross below 21 periods TEMA, It's signal for upcoming Bearish Market.
So here we can place our Sell Shorts with tight stop losses.
Like that on taking different Periods TEMA, we can easily identify Upcoming Market Trend Very easily. By using that information we can do profitable tradings always.

What are the Trade Entry and Exit criteria using TEMA? Explain with Charts.

For this illustration I applying TEMA Cross over strategy along with some additional criteria for giving my Buy/Sell entry.
Buy Trade Entry/Exit Criteria
Forgiving Buy Entry, price action must follow the below rules. Then only I give my Buy Entry, otherwise, I wait until get a good opportunity.
First Add Two TEMA Indicators on our needed chart with Different Periods. Here periods depend on your trading style.
If the Market is in a Downtrend, wait for Trend reversal. Those we identify by TEMAs cross over strategy.
When Shorter Period TEMA cross over above Longer Period TEMA, it's a signal for Uptrend Market. But don't give entry immediately after crossing over.
Wait here for at least 2 bullish candles form, then give Buy long entry in 3rd or 4th candle, along with maintaining tight stop loss here.
Here target would be previous resistance or until we get Uptrend Reversal from TEMA. Stop loss would just bellow longer period EMA.
Or also apply 1:1 risk and reward for your trade.
If above all criteria are full fill then only I go for Buy long entry.
For this illustration with chart, here I apply 9 and 21 period EMA's on my chart.
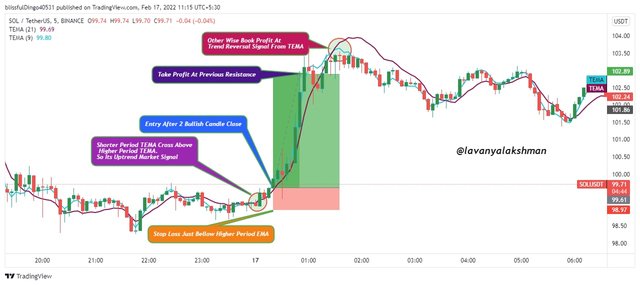
In the above example, when 9-period TEMA Cross Above 21 Period TEMA, is a signal for the upcoming Bullish Market. But here we need to wait up to at least 2 bullish candles closing, then only we give our Buy Long Entry here.
And set a Stop loss just below Higher period EMA, and book profit at previous resistance. Otherwise, wait until getting a trend reversal signal from EMA's.
But always maintain Trolling Stop losses for maximizing profits.
Sell Short Trade Entry/Exit Criteria
Forgiving Sell Short Entry, price action must follow the below rules. Then only I give my sell short Entry, otherwise, I wait until get a good opportunity.
First Add Two TEMA Indicators on our needed chart with Different Periods. Here periods depend on your trading style.
If the Market is in an Uptrend, wait for Trend reversal. Those we identify by TEMAs cross over strategy.
When Shorter Period TEMA cross over below Longer Period TEMA, it's a signal for Downtrend Market. But don't give entry immediately after crossing over.
Wait here for at least 2 bearish candles form, then give Sell Short entry in 3rd or 4th candle, along with maintaining tight stop loss here.
Here target would be previous Support or until we get Downtrend Reversal from TEMA. Stop loss would just above longer period EMA.
Or also apply 1:1 risk and reward for your trade.
If above all criteria are full fill then only I go for Sell Short entry.
For this illustration with chart, here I apply 9 and 21 period EMA's on my chart.
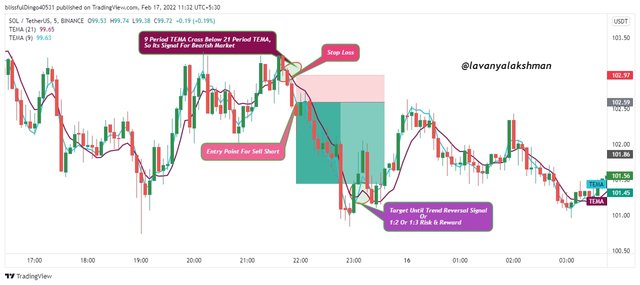
In the above example, when 9-period TEMA Cross Below 21 Period TEMA, is signal for the upcoming Bearish Market. But here we need to wait up to at least 2 bearish candles closing, then only we give our sell short Entry here.
And set a Stop loss just above Higher period EMA, and book profit at previous Support. Otherwise, wait until getting a trend reversal signal from EMA's.
But always maintain Trolling Stop losses for maximizing profits.
Like that we can do our Tradings with help of Two TEMAs Cross Over Strategy.

Use an indicator of choice in addition to crossovers between two TEMAs to place at least one demo trade and a real margin trade on an exchange (as little as $1 would do). Ideally, buy and sell positions (Apply proper trade management). Use only a 5 - 15 mins time frame.

For this illustration here I using TEMAs Cross Over Strategy along with Upgraded RSI Indicator. In both combinations, we can do easy trading.
Here I apply 9 and 21 period TEMA along with the Advanced RSI indicator for identifying My Buy/Sell points.
ETH/USDT 15 Minutes Demo Trade:-
When I observe the chart, I notice the 9-period TEMA indicator Cross above 21 Period Indicator. So it's a signal for Uptrend Market. But I don't give my entry at that point, I wait until getting confirmation from RSI.
After getting clarification from RSI, I give my entry. And set a Stop loss just below 21 periods TEMA, Target 1:2 ratio I place.
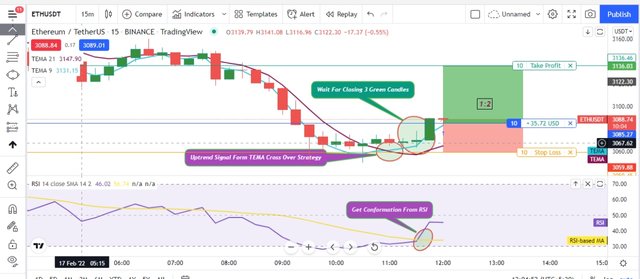
We can check the entry and Cross over indications in the above chart.
Here I apply RSI Indicatir and Two Triple Moving Average Indicator. When yellow line move bellow Blue line, it I education for Uptrend Market.
Considering all those I give my entry like as above.
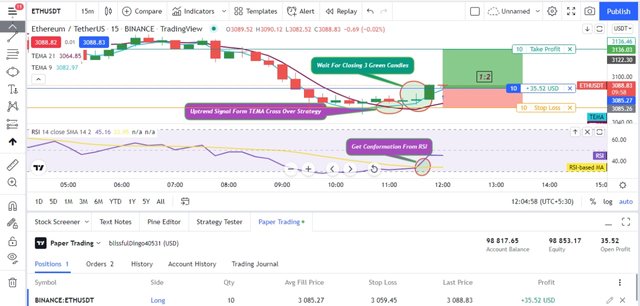
For demo trading needs , here I use paper wallet.
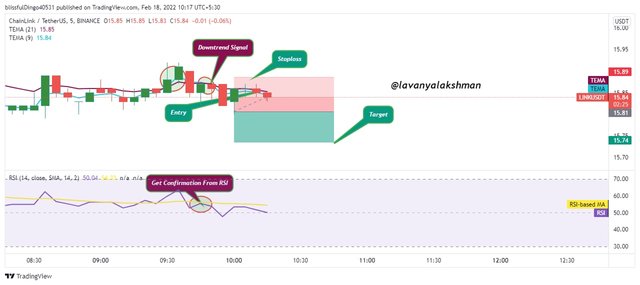
Real Trade:LINKUSDT : Sell Short Entry
Here I choose 5 minutes time frame chart. On observing chart I notice market moving in sideways. So we already learn in sideways market , we don't do any trading until we get clarification on market move.
But for finishing this task ,I took entry based on TEMA and RSI Indicator help.
Here also I wait to close 2 Bearish candles after getting Downtrend Signal from TEMA. But market moving up and downs so I place my stop loss just above Higher Period TEMA, Take profit set net Support area.
Here is my entry details.
And My Trade History
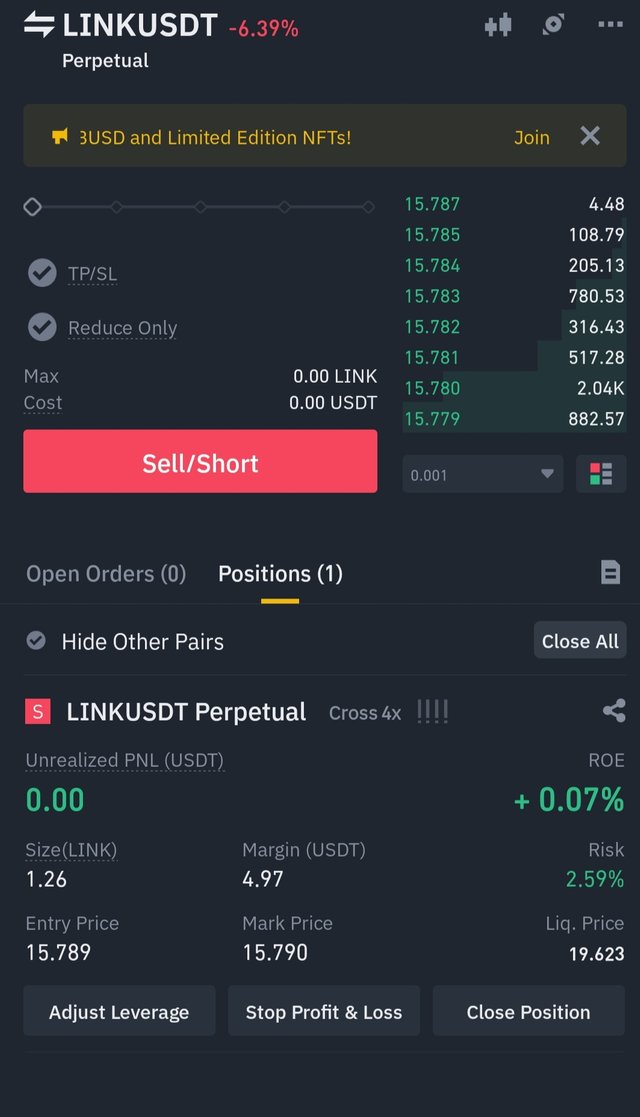
Like that with help of TEMA and RSI , We can do easy trading.

What are the advantages and disadvantages of TEMA?

TEMA is one type of indicator. It generates a signal based on past and present price action.
But those also work only based on Math Formula, so it also has some limitations.
So before trading based on the TEMA indicator, we must lead its limitation also with advantages too. Then only we can take the correct decisions at the correct time.
Advantages Of Triple Exponential Moving Averages
Triple Exponential Moving Averages respond very quickly according to price action. So we can easily identify upcoming opportunities very easily.
Its Trend based indicator, not lag compared to other Moving Averages.
With help of TEMA Angle direction we can easily identify Market trends and Trend Reversals very easily.
Sometimes TEMA Serve as Dynamic Support or Resistance based on Market Conditions.
With help of Two TEMAs Cross over strategies we can easily identify Buying/selling points. Along with we can determine to stop loss and exit points too.
With help of this we can also determine Pullback points. Those are good opportunities for getting a good profit in short term.
Disadvantages of TEMA
Triple Exponential Moving Average Indicator also has some limitations. Those are listed below.
Triple Exponential Moving Average Indicator is only helpful in the trending market, In the sideways market, it generates false signals.
TEMA reduce lag, that's why it reacted very faster based on present Price Action. Due to high volatility, it generates some unnecessary signals sometimes.
So trading alone with TEMA is not recommended.
- Due to faster response according to price action, times Dynamic Support turned to Dynamic Resistance in the next candle alone. In those situation trading using this indicator end with a loss.
Like the advantages and disadvantages, we get from the Triple Exponential Moving Average Indicator. So before trading with help of TEMA always keep those in mind. It helps a lot for making good decisions at good times.

Coclusion 
Triple Exponential Moving Average Indicator is also one type of Indicator. It reduces lag compared to other Moving Averages. Also, respond very quickly according to price action.
With help of the TEMA indicator Angle direction along with price action, we easily identify present Trends and Trend Directions very easily.
Sometimes TEMA serves as Dynamic Support/Resistance based on Price Action.
With help of Two TEMAs Crossover strategies, we easily identify Buying/Selling entries, Stop loss points along Target Points very easily.
TEMA Indicator helps a lot for doing profitable trades, but it also has some limitations. So be careful on doing trading with help of indicators.
Thank you professor @fredquantum for this informative and useful lesson to us.
Thanks For Reading My Post.
Upvoted! Thank you for supporting witness @jswit.
