Crypto Academy Season 4 [ Advanced course ] week 2: Crypto Trading With Volume Indicator : Homework Post by kouba01
Hi friends, From this Today lecture from @kouba01, I learn more details about Volume Indicator. On using this Indicator how and where we took positions and where we exit from our positions.
Thanks for making it like a wonderful lecture to us.

Explain the volume indicator in your own words.
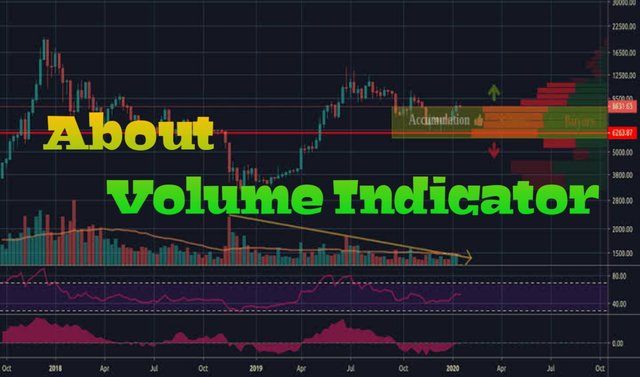
Volume Indicator is also looking like a normal indicator. But it plays a big role in understanding Market price actions, Traders thoughts, how trades act in support and resistance areas and many more very important details related details we get on checking Volume Indicator.
For Example, if you want to buy 50 DOT assets, and another person wants to sell 50 DOT coins. So we think here volume is (50+50) 100 but it is not True here volume is only 50. Because one person selling, another person buying coins. Here only 50 coins trade, not 100 coins. So Volume is 50.
Before taking our decisions based on the volume we must keep this logic in our mind, then only possible to take correct decisions at the correct time.
From the volume indicator, we are also possible to find details about how many assets are traded in that particular time frame. From this information, we get details about Buyers or Sellers pressure on that assets.
If we notice a buyers presser, then it pumps if we get a seller presser means it dump soon. So based on this we can identify further price move very easily.
From this, we identify the present trend also. If a particular coin getting huge volumes comparing to other assets means Traders showing more interest in that particular asset in that time frame.
So here we easily identify upcoming pump or Dump coins very easily.
In the above Example based on Volume, we can see price fluctuation in assets. From this also we understand at present traders in which assets they showing interest to trade.
Based on this we can do profitable trades very easily but also need basic knowledge on Market Movement.
Understanding Volume
Trading means buying or selling any assets. For this, we contribute our volume to the Total Volume.
Here Transaction occurs if buyers accept that price in that particular time frame, on the other hand, the seller also agree to sell his assets at that buyer asking price. If both agreed only that Transaction executes otherwise here Transaction not possible to execute.
In one day we see like those trades of 5 then the Total volume of that day is 5 only. This means on that day 5 times traders show interest to buy. Means 5 times it must be sold by sellers. But the total volume is 5 only not 10. So don't get confused on understanding volume, buying is only possible when a seller sells only. Without selling not possible to buy.
So buying + selling = 1 Transaction only
Based on this formula 5 times buying, and 5 times selling means 5 transactions so, the Volume is 5.
That volume indicator we get in every exchange free of cost. Here you get 1 minute, 5 minutes, 30 minutes, 4 hours, 8 hours, 1 day, 1week, 1 month and many more time frames for checking the volume of assets.
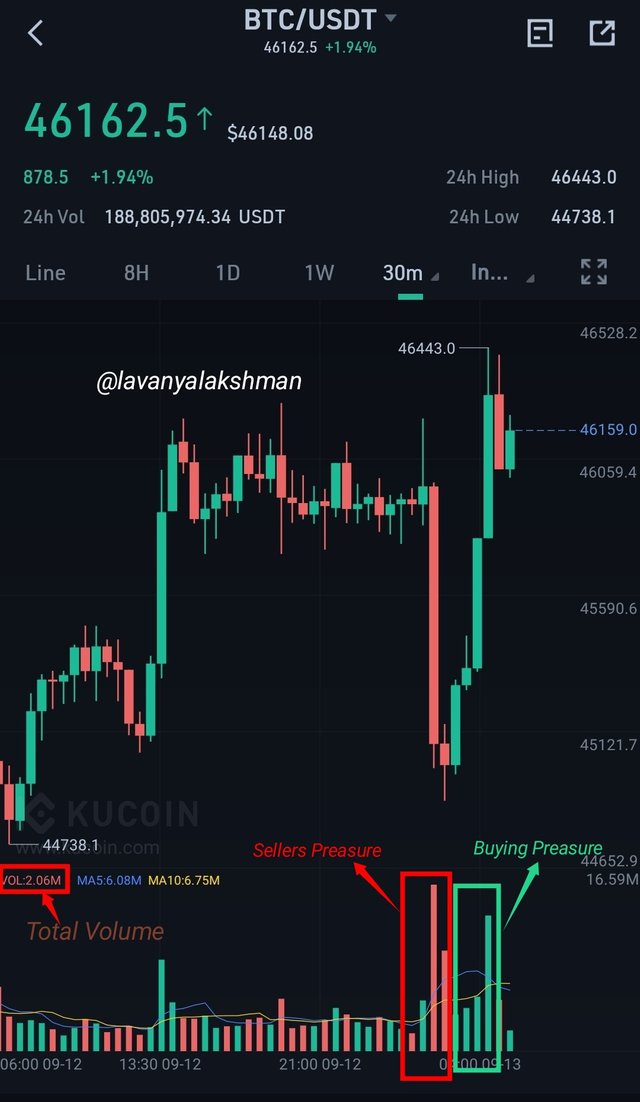
In the above image, I took BTC/USDT 30 Minutes Volume in Kucoin Exchange.
On checking Volume Indicator, it getting good volume from the last couple of hours at the same time selling pressure also there. In 30 minutes Time frame it having around a 2.06Million Volumes on Kucoin Exchange.
Like that important information, we get from Volume Indicator. It is very useful in doing profitable trades.

Use a platform other than Tradingview to present the volume indicator on a chart and show how to configure its parameters by justifying your choices.
Any Trader for analyzing chart for taking their positions we use Trading View. Because here we get a lot of indicators and a lot of other Tools to draw trend lines and many more needs.
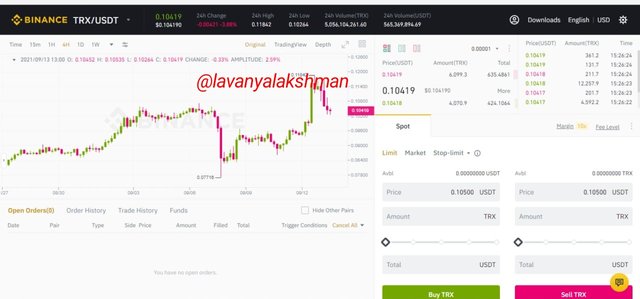
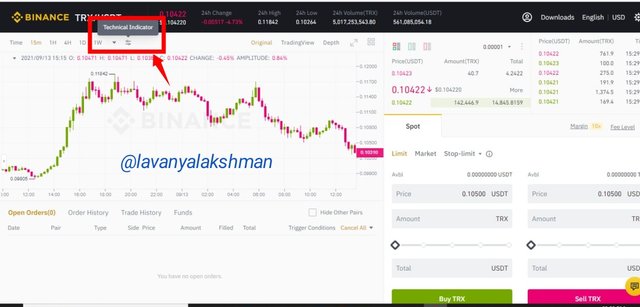
But here professor asks to use rather than Tradingview use any other platform. So here I use Binance Exchange for analyzing charts with Binance provide Volume Indicator.
So I just open my Binance account, For illustration, I choose TRX/USDT 15 minutes chart.
Now we need to add Volume Indicator on our chart.
So I select Technical Indicator Tab
From this select VOL.Here VOL means Volume Indicator.
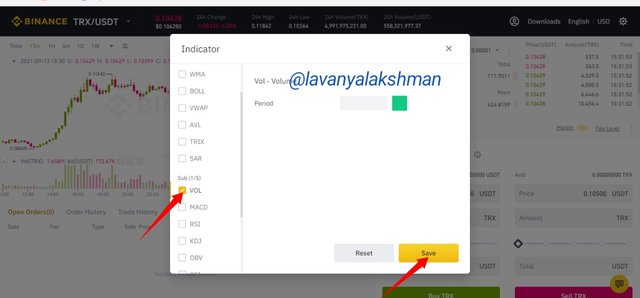
Now it automatically applies the Volume Indicator on our chart.
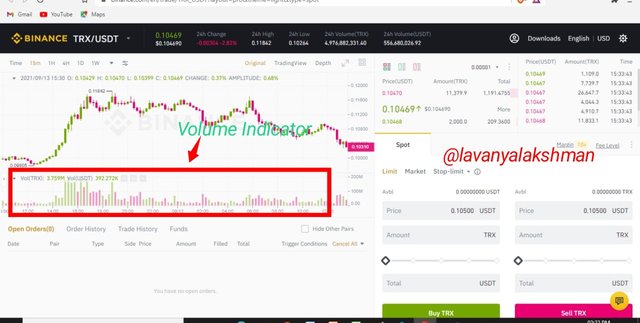
Here we get Details about Total Volume in USDT and TRX in that particular Time Frame.
This means how much money flows to the market for buying how much quantity of coins.
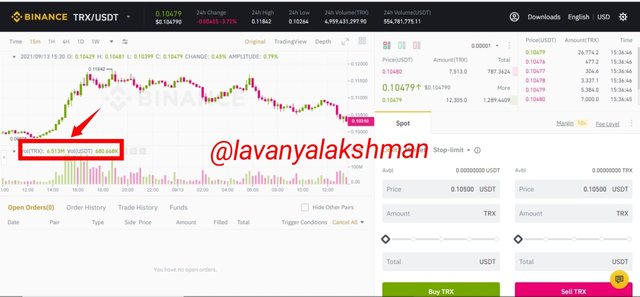
As per the above chart, nearly 6.51M TRX coins Traded with around $680.66K USDT in that particular time frame.
From this, we getting Traders present interest in that coin. If its volume increase like that, then we see a good price jump in a short time frame.
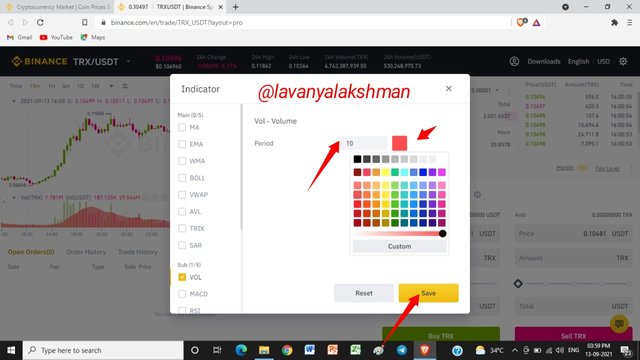
Here we also Edit Periods of Volume Indicator. Based on our needs we can edit input along with its colour.
For Example, here I wish to change its Period to 10, and Its colour to Red.
For these changes needs, I just select the setting tab in the volume indicator. Then I give 10 in periods, then select Red Colour. Then click the Save tab.
After applying these changes in Volume Indicator now chart looking like this.
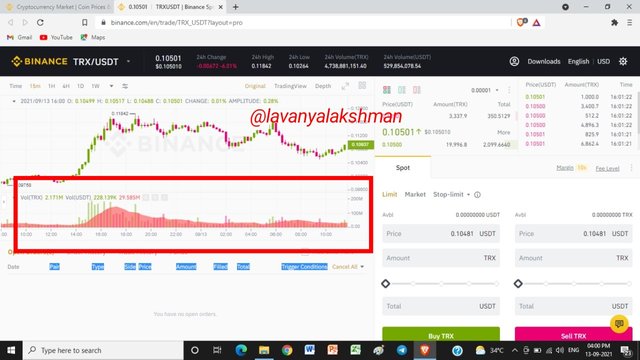
Like that we can Edit and Set the chart as per our wish.
What is the link between Volume and Trend and How to use volume to predict a trend reversal?
From volume, we can identify Supply and Demand in that coin in the market in that specific Time frame.
In Volume Indicator Supply and Demand represents Buyers and Sellers those Represents as Green And Red Colour Bars in General.
If we get More Green Colour Spikes Means the Market Going upward Direction.
Here I chose TRX/USDT 15 Minutes Chart. When Volume Increase, we see Price action also getting changes. Along with Volume It starts pumping.
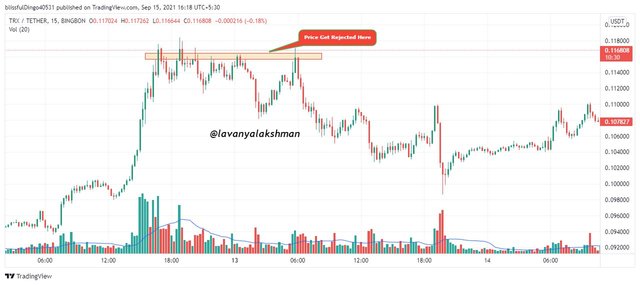
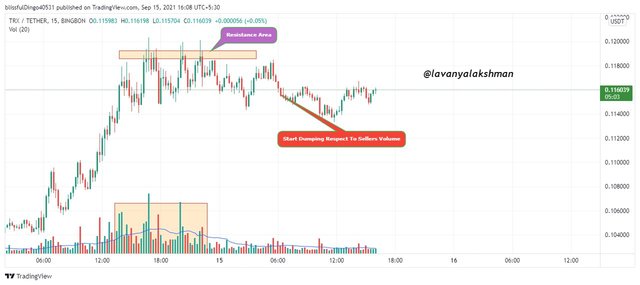
Due to Volume Spike, we see Uptrend in TRX coin. But this Trend goes on reach its Resistance. Then after Sellers get active, so Sellers start selling their Assets, so again It reaches its Previous Position.
In 15 minutes Frame we see those Rejections up to 3 to 4 times, then after it again go consolidate mode. Here TRX is not possible to break its Resistance so it again reaches its previous position.
But if it breaks this Resistance with high volume then we say this resistance act as support then go another leg up.
That rejection we can predict before seeing Volume Chart.
It is telling without Huge volume it is not possible to break its resistance level. In each attempt, we see there is no volume in that area, so it must get Trend Reversal. So on placing our Exit Point near to resistance level is a good choice in this situation.
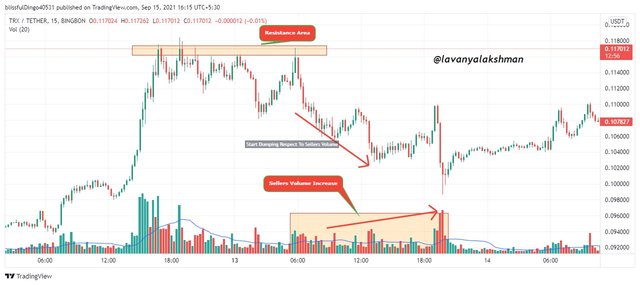
Based on volume we can predict Trend Reversals very easily in Support and Resistance Areas.
How to use the volume to have a signal confirmation?
All we know is Volume Tells us the Number of assets Traded in that particular Time Frame.
In this Trade Buyers and Sellers, both are Included. If buyers are high then we see Price Moving of assets in Upper Direction. It represents in Green Lines on Volume Chart.
If Sellers are high then we see Prive Moving in Downward Direction. It represents Red Cour Lines on Volume Chart.
Now how to understand this Uptrend or Downtrend is Genuine Trend or Fake Trend.
This also we identify very easily on checking Volume Chart.
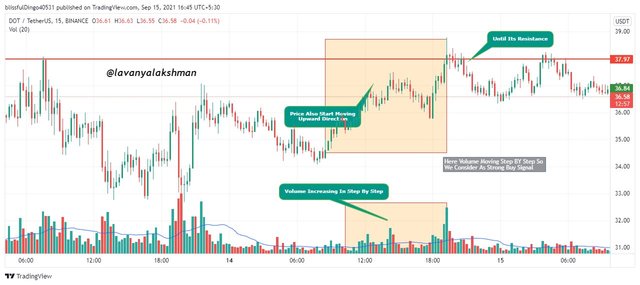
In Volume Chart if we see Step by Step Green bars then we considered as it's a Strong Trend, so we can open our positions. Those we can check in any Time frame.
If we see a sudden spike in Volume Chart, then surely soon or later it dumps hard. Those we called as Fake Pump.
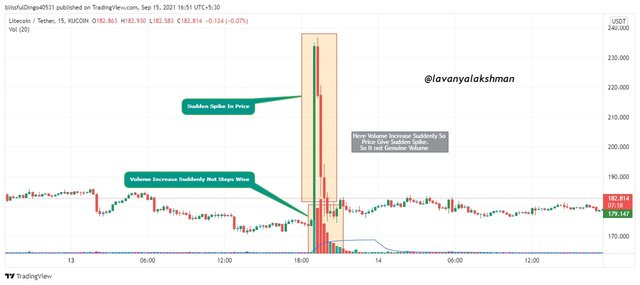
Here we possible to identify fake pumps by checking the Volume chart. Here Volume increase Suddenly so we consider some group of people doing Manipulation in that assets. So it's better to avoid trading in that assets in that particular time frame.
Because This trend does not continue longer time. Sooner or later it again reaches its original position or dump more than that.
Like those Fake Pumps and Dumps, we see in the crypto market regularly. Some group of people together can do like those activities so don't fall in their trap. Always check those pumps or dumps are genuine or fake on checking Volume Chart.
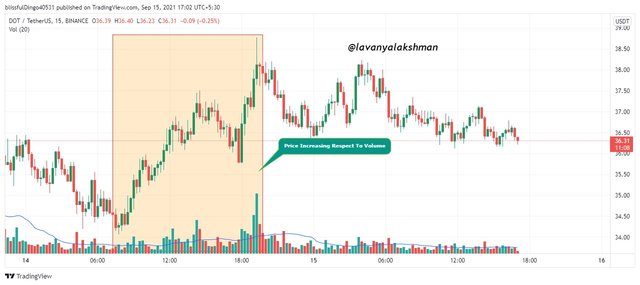
In the chart, if you see price move along with volume move then we tell as it's a strong trend. If the price moving in an upward direction but the Volume moving Downward direction then we say it's a weak trend. Here Buyers not showing that's much interest in buying at that particular time, so we can see a Downtrend on that coin at any time. So in that situation, we need to trade with Tight Stop losses.
How does the volume reflect the evolution of prices in the charts and why does the volume sometimes anticipate the price?
Volume And Price Action
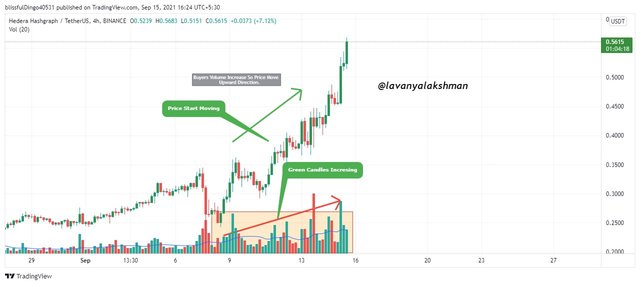
If buyers show interest in buying that asset then we see Green Candle Volume also increase slowly, so we see Upward Direction in Price Movement. Because of Demand Price and Volume, both go in an Upward Direction.
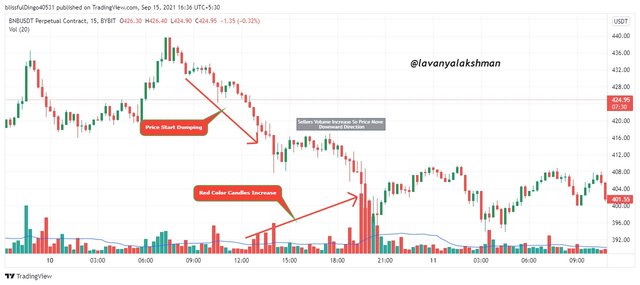
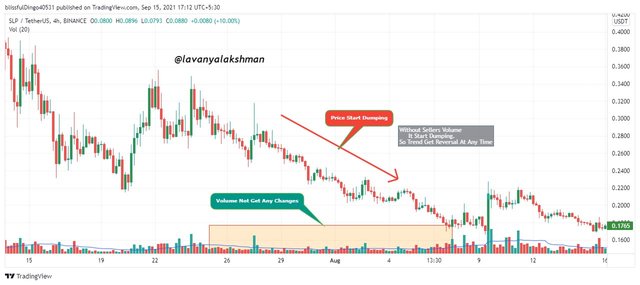
If sellers showing interest to sell their coins, then we see Red bar candle volume start increasing. So we see Price Start Dropping.
Like those Price Action, we get when Green Candles Volume increase or Red Candles Volume Increase.
But in some Situation price action go the opposite to Volume Chart. Those Situations we known as Volume anticipate Price Action.
Volume anticipate Price Action
In Some Situations we see Price Moving Upward direction but the Volume Of Green Candles Volume Decreasing. Here Buyers showing interest but not in Strong, so this Trend Get reversed at any time. This means soon we see Bearish Trend.
In the same way, if we see Price Moving Downtrend but Red Candle Volume Decreasing. So here Sellers are active but not Strong. So we treat this trend as Werk Trend. So we understand soon we see Bullish Trend In that assets.
In general, if the Price Move upward Green candle volume also need to increase based on price action, but sometimes due to the weakness of trend that Volume corresponding move we don't see in the chart. So here Volume act anticipates price action.
Based on Volume anticipate on price action we can understand Present Trend is Week or Strong very easily.
Is it better to use the volume indicator alone or use it in parallel with another indicator when trading? Justify your answer.
In my opinion Volume Indicator is not enough to identify the present market trend. Along we also need to use some other Indicators like RSC, Moving Averages, BB and many more for getting 100% clarification about Trend.
But Some Time how many indicators we use do not give correct results because those are only useful for predicting not give accurate results.
So don't trade blindly on using Indicators.
For me, I use Volume Indicator Along with EMA 20 and 50 for short term trade needs.
On using both together I get clarification about support and resistance levels, then on checking Volume I took my position.
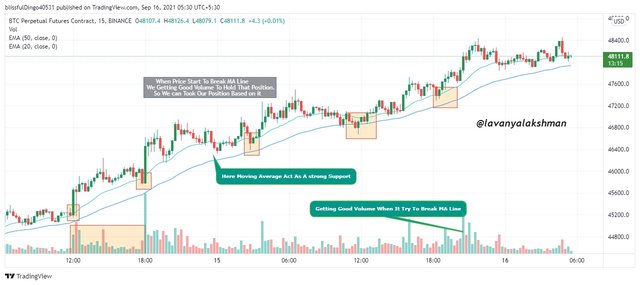
But it doesn't get 100% accuracy, so if I get any doubt again I apply different Indicators like RSI, BB and many more. After getting clarification I took my position.
The volume indicators are multiple, choose one of them to briefly explain its usefulness in crypto trading.
In Tradingview we get different Volume Indicators for analyzing price charts. From this Illustration, I choose Money Flow index. For additional clarification, I apply Moving Averages on my chart.
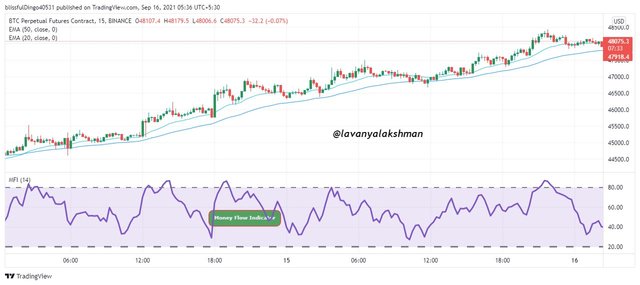
Money Flow Index work based on Price and Volume, so there is a high chance of getting more accurate results. So possible to do profitable trade.
Applying this Indicator on our chart is very simple, this Indicator looking very simple to understand.
Money Flow Index is an Momentum Oscillator so it identifies the momentum of outflow and inflow of money in assets in the particular time frame.
Calculation:-
By following the below steps we can calculate Money Flow Indicator.
Typical Price = (High + Low + Close)/3
Raw Money Flow = Typical Price x Volume
Money Flow Ratio = (14-period Positive Money Flow) / (14-period Negative Money Flow)
Money Flow Index = 100 – {100 / (1 + Money Flow Ratio)}
Here Positive Money Flow means Buyers volume, Negative Money Flow means Sellers Volume.
On applying the above Steps we get the MONEY FLOW INDICATOR calculation.
How to add MFI on Chart
Adding this Indicator to our chart is very simple and easy.
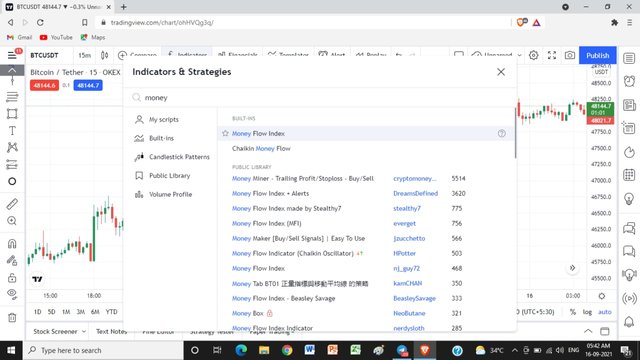
For this just open the Tradingview Platform, Then select your need chart.
For Example here, I selecting BTC/USDT Chart.
- Now go to Indicator Tab, In the search bar just Type Money Flow Index, then select that indicator.
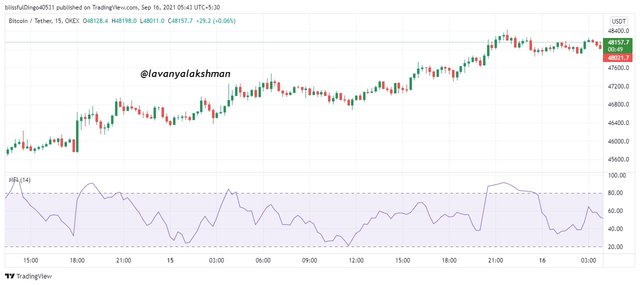
- Now it successfully added to our chart.
Trading Strategies using MFI
MFI is also known as a volume-weighted version of RSI. It is similar to the RSI indicator but it works based on Volume.
Now we know how MFI indicators calculate and how to add to our chart.
MFI is a line plotted chart it values bounded from 0 to 100.
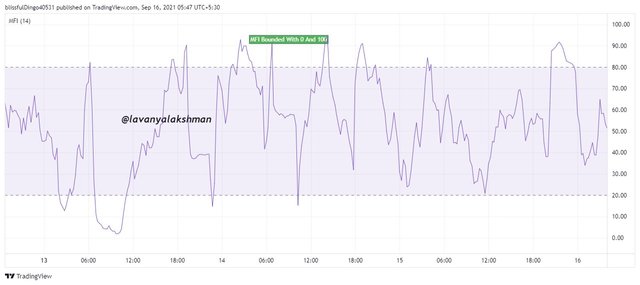
Based on Buyers and Sellers pressure it to move up and down in the 0 to 100 range.
If MFI cut above 40 lines means Buy signal if it cut bellow 60 means Sell signal.
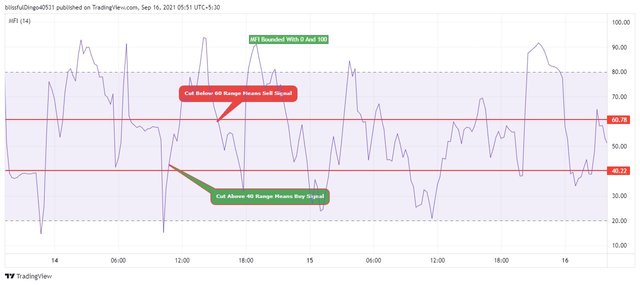
Very simple strategy but sometimes it gives the wrong signal, so avoiding this we apply MFI along with MA 20, then we get more accurate results.
MFI + MOVING AVERAGE STRATEGY:-
For applying this Strategy we add MA 20 and MFI indicator on our chart. Then select your assets and Time frame as per your wish.
When Price Cuts above 20 MA from Below and simultaneously MFI also cuts above 40 lines, It's a strong buy signal.
When Price Cuts below 20 MA from above and simultaneously MFI also cuts below 60 lines, It's a strong Sell signal.
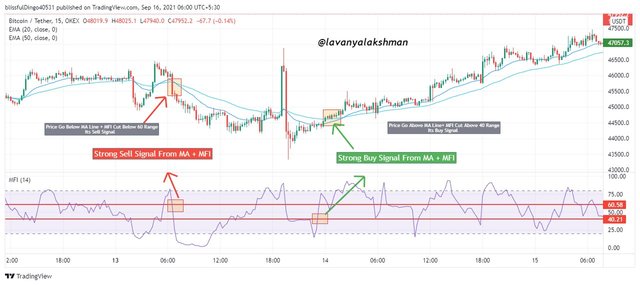
By following this Strategy we can do trading very easily. Short term traders need to set a lower time frame, for long term needs using a longer time frame.
In any Time frame, this Strategy working accurately.
By using the MFI indicator we can identify Volume and Trend breakout signals very easily.
Conclusion:-
For profitable trade, we must need Knowledge of the Volume Chart.
Volume shows Traders Interest in assets in a particular time frame. Based on this possible to do profitable trade.
If buyers showing interest means soon it pumps, of sellers showing interest, means Price drop soon. If we get these details we can open our positions and exit with profits also.
All those details we get from analyzing the Volume of an asset.
Along with we are also possible to identify Werk Trend, Strong Trend and Trend Reversal by analyzing Volume itself.
Based on Volume we can also identify after reaching Support or Resistance levels how Traders React in that area.
If you see huge buying volumes in support areas means Traders push up its price to reach the next resistance level.
Similarly, if you see huge sellers volume at resistance then we see the price drop from that resistance level. Based on Volume we can get details about our positions, we can decide our position need to hold or close.
Based on Volume we can also identify further moves of price action.
Money Flow Index is a simple indicator for identifying price momentum. Very simple to use.
With MA and MFI we get accurate signals for Buy or Sell.
But all are indicators only, not give accurate results so don't trade blindly on using Indicators themselves.
Hope I finish all Tasks Correctly.
Thanks For Reading My Post
Hi @lavanyalakshman
Thanks for participating in the Steemit Crypto Academy
Feedback
This is excellently done. It's such a detailed and clearly expressed understanding of Trading using the Volume indicator.
Total| 10/10
Thank you very much.
Your explanation is good nd all the best Dear 😊
You have been upvoted by @sapwood, a Country Representative from INDIA. We are voting with the Steemit Community Curator @steemcurator07 account to support the newcomers coming into Steemit.
Engagement is essential to foster a sense of community. Therefore we would request our members to visit each other's posts and make insightful comments.
Thank you