Crypto Academy Season 3 | Intermediate Course: Vortex Indicator Strategy Homework post by @asaj
Hi all, From this lecture from @asaj, I learn about the new indicator Vortex Indicator Strategy.
.jpeg)
Thanks for making it like a wonderful lecture to us.

In your own words explain the vortex indicator and how it is calculated.
In the Trading view, we having plenty of Indicators like RSI, VOLUME, EMA, MA, MACD and many more. From this Vortex, Indicator is also one type of indicator. Developed by Etienne Botes and Douglas Siepman. They Introduction this indicator in 2010. So it's a new indicator compared to others and also working perfectly.
By using this Indicator, Traders can give their entry at the perfect time, so possible to grab good profits also.
What is the Vortex Indicator (VI)?
Vortex Indicator(VI) is an indicator composed of two lines. These two lines are known as Uptrend line(Positive VI (VI+)) and Downtrend line(Negative VI(VI-)). These lines are Typically coloured as Green and Red respectively.
Using this Indicator we can identify Trend Reversals, along with also get confirmation about the preset trend.
On applying this indicator on our chart, we can see in some places green line is above the red lines, in some places it is a spot below the red lines. It shows Tred Reversals.
If we see the green line(VI+) above the Red line(VI-) means Bullish sign, so we can take Buy Long Positions in that area, Before Trend gets reversal we need to book our profit and exit from it.
If we see the green line(VI+) below the Red line(VI-) means Bearish sign, so we can take Sell Shot positions in that area, Before Trend gets reversal we need to book our profit and exit from it.

Understanding the Vortex Indicator
Vortex Indicator is one type of Technical Indicator. It uses historical prices to forecast present trends in a particular Time frame.
For Example, If we took the BTC price chart, on seeing the Price chart we can easily identify High and low prices of a particular coin in a particular Time frame.

In every time frame, we see the highest and lowest prices in a price chart. Here Vortex Indicator connects the highs of a market’s price bars with the lows of the next price bar.
At the same time, the lows of a market’s price bars are connected to the highs of the subsequent price bar.
That's why we get valuable information from those two lines. If we see those two lines moving in contrast to each other means STRONG TREND. Whether it is bullish or Bearish.
If we see both lines moving near to each other means, that Trend is Week so any time it can go opposite Direction.
Like that information, we get from Vortex Indicator. On following it Trader can do profitable Trades very easily.

Like that we can identify present trends using Vortex Indicator Very easily.
Vortex Indicator Calculations
For calculating the Vortex Indicator, we need to follow Five Steps. A little bit difficult to understand its calculation.
- For this First we need to calculate Upward and Downward Movements.
Here Upward Movement (VM+) we calculate on subtracting Present High with Previous Low price.
Here Downward Movement (VM-), we calculate on subtracting Present Low with Previous High.
So now we know how to calculate Upward or Downward Movements.
2.Need to calculate the number of Periods
- If we choose 50 periods in the vortex indicator, then it calculates as follows:
VM50+ = 50 period sum of VM+
VM50- = 50 period sum of VM-
If we choose another period like 100, 14 and many more here formula also change according to it.
3.Now we need to Calculate its True Range(TR)
Here we get TRUE RANGE IN THREE DIFFERENT WAYS.
Current High Price minus Current Low price
Current Low Price minus Previous Closing Price.
Current High Price Minus Previous Closing Price.
Like that we calculate True Ranges.
4.Now we need to Calculate the specified period:
For 50 periods: TR50 = 50-period Sum of TR
On using the above formula we calculate a Specific Period for 50 periods.
5.Now final step VI+ Or VI- Calculation
VI50+ = VM50+ / TR50
VI50- = VM50- / TR50
This formula is for 50 periods. If we need other periods it will change according to it.
For Example, if we need VI for 14 periods. Then use the below formula.
VI14+= VM14+ / TR14
VI14-= VM14- / TR14
On using above formula Vortex Indicator Works.
Is the vortex indicator reliable? Explain
I am not sure about this indicator always give accurate results. But compared to other indicators on using this indicator we can take our positions based on its Buy or Sell signals.
Very easy to use, No clumsy on the chart, on seeing it we can understand present Trend, and when it gets reversal also.
It gives a buy or sells signal before Tred get a reversal. So we can maximise our profits very easily.
But it is a newly introduced one, so need more improvement for accurate results. Need more research and more updates on this Indicator.
How is the vortex indicator added to a chart and what are the recommended parameters.
Adding Vortex Indicator on our chart is very easy. For This Just go Trading view, Take any chart as per your wish.
For Example, Here Taking ETH/USDT 4hours chart.

Now go to the Indicator Tab,
In the search bar just type VI you get Vortex Indicator just select it.

That's it now Vortex Indicator successfully applied on my chart.

For our needs, we can configure its settings as required to us. Now we see how to configure its settings.
- For this Tap on VI Icon.

- Now select Settings tab

- After clicking the setting Tab now we get one popup like this.
Here it's Style look like this as default.
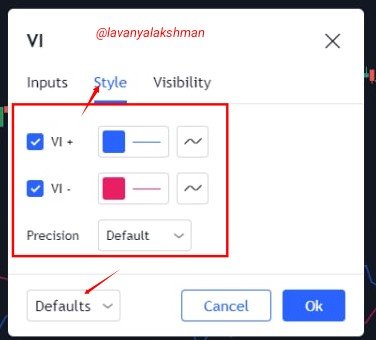
Here Positive VI in Blue colour, Negative VI in Red Colour. Here you can change as per your wish.
So here I changing Positive VI into green and selecting a Thick line also.
But for Negative VI, I changing to thick.

For changing just click on the OK tab. Now it applied to my chart.

Like that, I change its appearance as per my need.
- Now we can change its Inputs by selecting the Inputs tab. By default Vortex Indicator use 14 periods, but you can change as per your wish.

Here I changing its periods into 7, so I just enter 7 in the Length Tab.

Then select OK, Now it is automatically updated on my chart.

- Now it's Visibility.
Here I don't need any changes, so set as its default values.

These are the main settings we need to know on using the Vortex Indicator.
Explain in your own words the concept of vortex indicator divergence with examples.
From Vortex Indicator we get Strong buy or Strong Sell signals. On using those we can Take our positions, on booking profits we can exit from it.
All we know If Positive VI is above the Negative VI means a Bullish sign. So we can place BUY LONG POSITIONS rather than short positions. In this Signals always go for Buy Long Only. Don't place any Short Positions in any situation, because Vortex Indicator giving BUY signal now, So don't place any Sell Shorts in this Situation.

In the above chart, I get Two Strong Buy signals from Vortex. I also get confirmation from MACD, a little bit late.
If Positive VI is below the Negative VI means a Bearish sign. So we can place SELL SHORT POSITIONS rather than Buy long positions. In this situation always go for Sell Short Only. Don't place any Buy Long Positions in any situation, because Vortex Indicator giving Sell signal here, so don't go Buy long.

In the above chart I get 2 more signals I get from Vortex for placing Sell Short Positions. I get confirmation from MACD also.
Now we understand how we get Buy signal or Sell Signal from Vortex Indicator. Now we discuss its divergence.
Divergence of Vortex Indicator and price chart
At any cost, we get only Two Types of Divergences. One is Bullish Divergence, Second One is Bearish Divergence. It indicates strong Trend reversals.
Here Bullish means Buy Long, Bearish Means Sell Short.
In a Vortex Index, if you see any Divergences then it indicates then we see big move then after from this point. So we can place Buy long or Sell Short Positions for a long time. Because this trend continues until it reaches further its new high or new low positions. So prepare yourself based on the divergences farm in Vortex Indicator. It's a big opportunity to trade, we must grab this for book great profits. Because this trend continues a long time, not in a short period.
Bullish Divergence occurs when the Positive VI Trend line ( Green Line) experiences Higher High, but Price Movement Experience Lower High. In this situation, we get Bullish Divergence. It's a Strong Buy Signal.
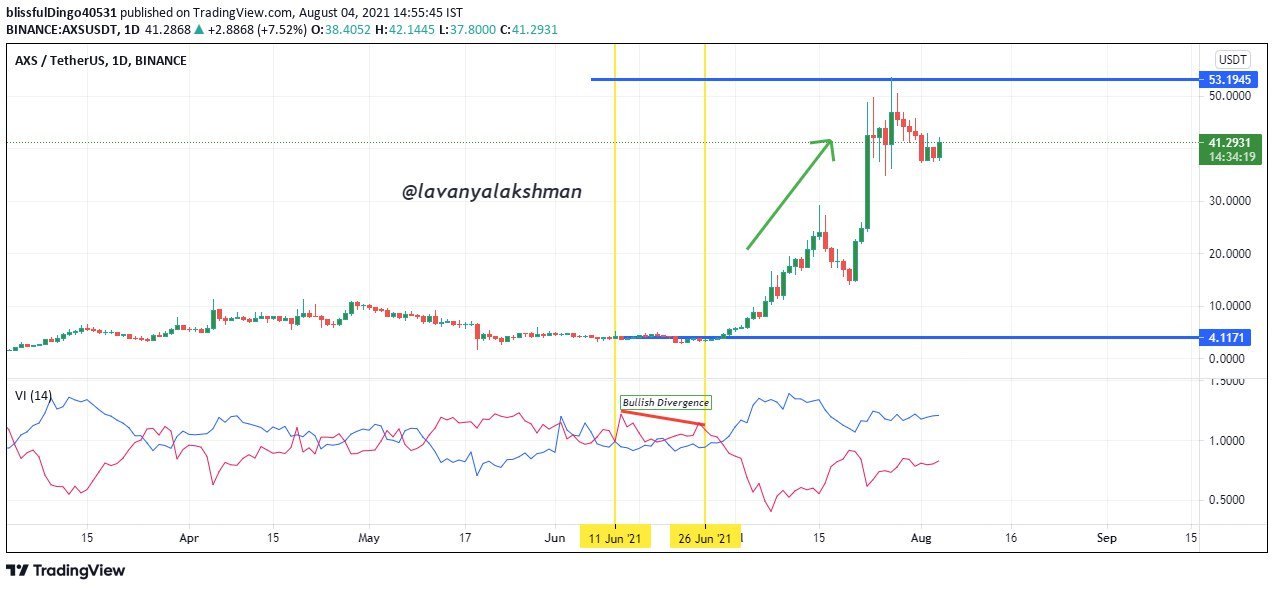
In above after making Bullish Divergence, then after Market start continue raising.
Now Coming to Bearish Divergence, When the Positive VI trend line Experience a lower high and Price Movement breaks the previous high, we get Bearish Divergence. It's a Strong Sell Signal. So we can place Sell Short positions there.

Above after farming Bearish Divergence, Market starts Dumping hardly.
Use the signals of VI to buy and sell any two cryptocurrencies.
For Demonstration I using the Paperwallet Demo account in Trading View.
1.DEGO/USDT
First I take Dego/USDT 5minutes chart, Then apply Vortex Indicator, and MACD on my chart.

Then after I observe Vortex Indicator alone, On checking it gives a sell signal to me. So I think to place Sell short on that price. Because Negative Vortex starts moving above the Positive Vortex, both lines going wider to each other. So it giving a Strong Sell signal to us.

After checking all those I place Sell Shot Position here. Here Stop loss would be the Previous Swing high. My Target I set at 1:1 Ratio. But on using Trolling Stoploss We can wait Until Vortex Indicator gets reversed.

Here I wish to close my Trade at a 1:1 Ratio. It's a good choice in the begging stage.

Here is My Trade History.

2.LUNA/USDT
First I take LUNA/USDT 5minutes chart, Then apply Vortex Indicator, and MACD on my chart.

Then after I observe Vortex Indicator alone, On checking it gives a sell signal to me. So I think to place Sell short on that price. Because Negative Vortex starts moving above the Positive Vortex, both lines going wider to each other. So it giving a Strong Sell signal to us. In this Trade, I use 7 periods of VI, For taking the fastest decision in ranging Market.

After checking all those I place Sell Shot Position here. Here Stop loss would be the Previous Swing high. My Target I set at 1:1 Ratio. But on using Trolling Stoploss We can wait Until Vortex Indicator gets reversed.

But here I close my trade before reach my Target. Because Vortex Indicator starts closing together, then after Trend may get reversal or go further dump. But booking profit is most important. That's Why I close my Trade at this Point. Then after we wait for a good opportunity.

Here is My Trade History.

Like that on using the Vortex Indicator signal, we can do profitable Trades very easily.
In my experience Vortex Indicator works well in 14 periods rather than 7. But in ranging market 7 periods is very useful for taking quick decision.
Conclusion
Vortex Indicator is a Newly Introduced one, so working perfectly.
Through Vortex Indicator we getting Buy or Sell Signals before Trend gets a reversal.
Using this we can identify present Trend and Tred Reversals also very quickly.
It providing early signals than MACD or compared to other Indicators. Vortex giving early signals to us.
Applying on the chart is very easy. Because it's Built-in Indicator in the Trading view.
Vortex is also one type of Indicator only, not give 100% accurate results always. Don't trade blindly on using this Indicator alone. Always verify its signals with other indicators also.
Thanks For Reading My Post
Superb performance @lavanyalakshman!
Thanks for performing the above task in the sixth week of Steemit Crypto Academy Season 3. The time and effort put into this work is appreciated. Hence, you have scored 9 out of 10. Here are the details:
Remarks
I always enjoy your unique perspective and approach. This is another exceptional work from you. You could have gotten a ten without doubts if your charts on VI divergence to price action was accurate. I understand it's a new indicator and you're still getting used to it.
One would think you invented the indicator given how well you used it to make good profits in your demo trades. Thanks for sharing your work with us lavanyalakshman.
Yes agree,Need so much practice on understanding new Indicator.
I try my best.
Thanks for review my post.