Crypto Academy /S4W8-Homework Post for kouba01
Hi all this Today lecture from @kouba01, I learn about another most important Indicator Rate Of Change (ROC).
Thanks for making it like a wonderful lecture to us.

In your own words, explain the ROC indicator with an example of how to calculate its value? And comment on the result obtained?
ROC Indicator:-
ROC Indicator is also one of the Technical Indicators like MACD, RSI, EMA and many more. But using ROC Indicator we can calculate percentage change in price between the current price and the price a certain number of periods ago, So we get the exact present price change in the market.
So it reduces our difficulty in Identifying Overbought, Oversold Positions. By using this indicator we can identify those levels very easily. Based on this we can trade profitable trades very easily.
The Price Rate Of Change (ROC) is a momentum-based Technical Indicator. By using this we can measure the price change between the current price to the previous certain number of periods change the price.
ROC Indicator is unbounded, plotted against Zero. If the ROC indicator moves Positive Territory, then we say the coin price moving in an upward direction.
If ROC Indicator moving negative territory means, coin price also moving downside.
These are simple indications we get from ROC Indicator.
This Indicator spot Divergences, Overbought and Oversold areas based on the centerline crossover.
ROC Indicator is a Momentum unbounded Indicator used in Technical Analysis set to against a Zero level midpoint.
So If this Indicator moving above Zero lines means it is an uptrend, It moving Below Zero lines Means Downtrend.
If it moves near to Zero line means we consider it as a consolidation phase.
Like that on using Rate of Change (ROC) indicator, we can identify Overbought, oversold, consolidate areas very easily. Along with we also get Buy/Sell Signals From ROC.
Calculation of ROC Indicator:-
Each Indicator is based on some Mathematical calculation so the Indicator works based on Math Formulas.
Before understanding Technical Indicator, we must learn basic details like on which based that indicator work, what values they use for giving signals like those, we must learn before using any Technical Indicator.
Blindly applying Indicator on our chart, and Taking our positions based on those signals not give profitable trades, always learn on which formula based that Indicator giving signals, then we can take the correct decision at the perfect time.
We learned already, ROC is Momentum based Indicator. Now we learn its Calculation Formula.
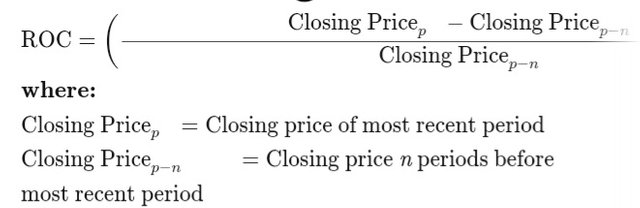
Based on this Formula ROC indicator give signals to us.
The here main step to calculate the ROC indicator is picking "n" values. Professional Traders use 9 or 12 periods for short term needs, 25 periods for midterm needs, 200 periods for long term needs.
As per our needs, we need to change this period in the ROC indicator using the setting tab, then after applying the indicator on our chart, we can trade based on it.
Here "n" values means how many past periods we compare with a present period, If we use short term periods then the ROC indicator reacts quickly so possible to give the false signal, If we use large periods then ROC react slowly so we get profitable signals always. So be careful on setting periods in the ROC indicator.
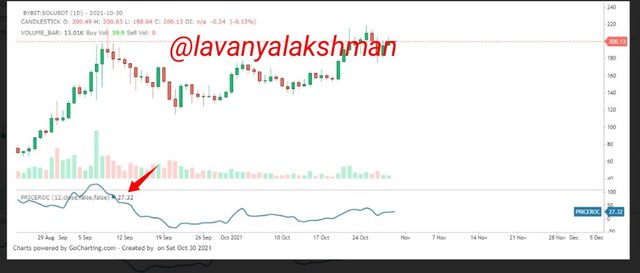
For knowing how it works I took BITCOIN closing price in coinmarketcap then applied ROC Indicator calculation manually.
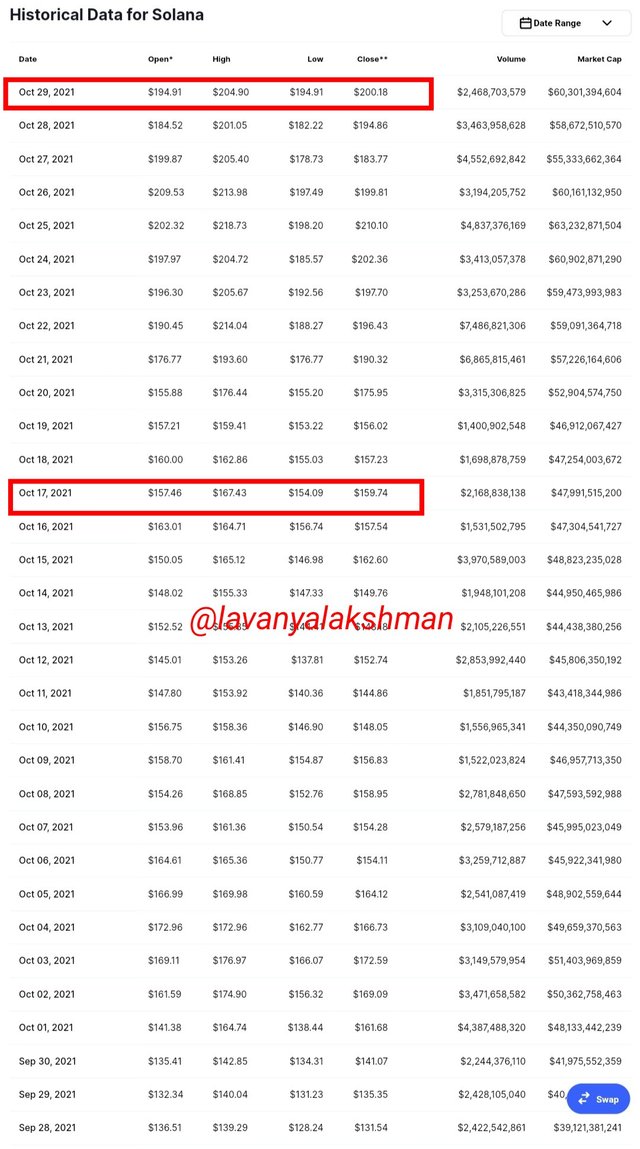
As per Coinmarketcap 29-10-2021, SOL closing Price is $200.18
Here I calculated short term needs, so I took 12 periods. So I need to go 12 days previous closing price of SOL.
So 17-10-2021, SOL closing Price is Around $159.74
Now I applying for ROC Calculation Math Formula.
ROC =
[(200.18-159.75)/159.74]×100
= 27.13
So it shows Uptrend in the Short term.
Based on Math Formula ROC Indicator giving signals to us.
Demonstrate how to add the indicator to the chart on a platform other than the tradingview, highlighting how to modify the settings of the period(best setting).
For this Illustration, I used the https://gocharting.com platform for showing ROC Indicator.
On opening this platform we get like this home page.
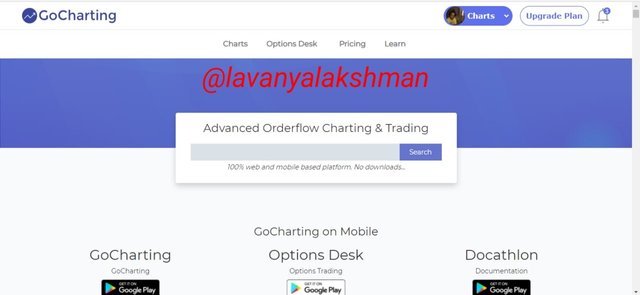
It is also very simple to use just like Tradingview.
Here also we get some free services like Tradingview , so just signup using email is enough.
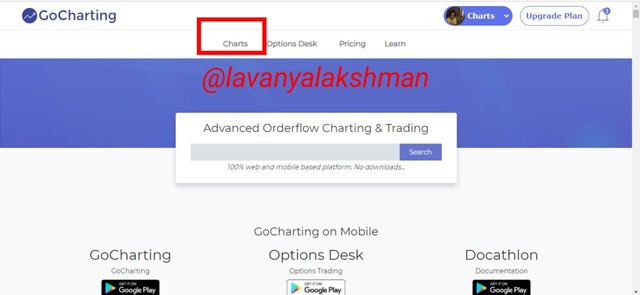
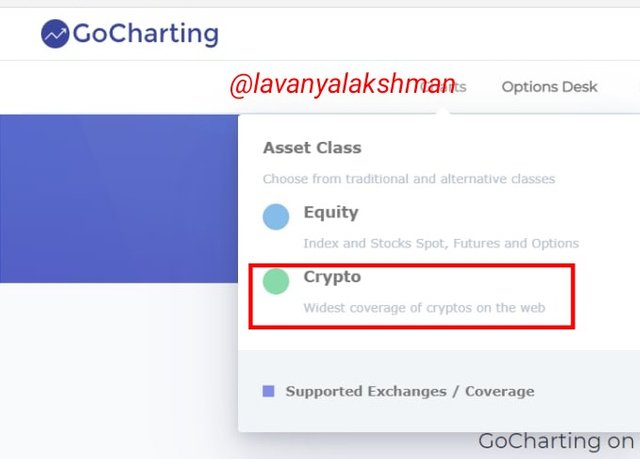
Now click on the Chart tab then select Crypto.
Then select crypto from it.
Now we get this screen with chart.
Now here we can choose our wished coin chart from our wished Exchange.
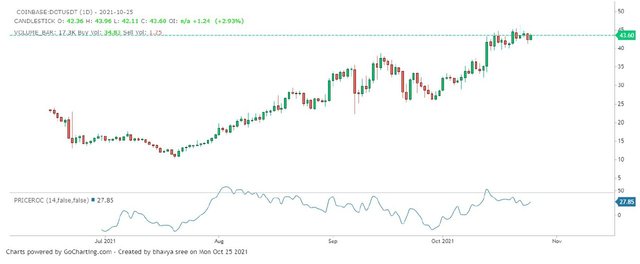
For Example, here I taking DOT/USDT Chart from Coinbase Exchange.
For this Needs I just go Coin search tab, Then just type DOT, Then we get pop up, from this I choose DOT/USDT chart from Coinbase Exchange.
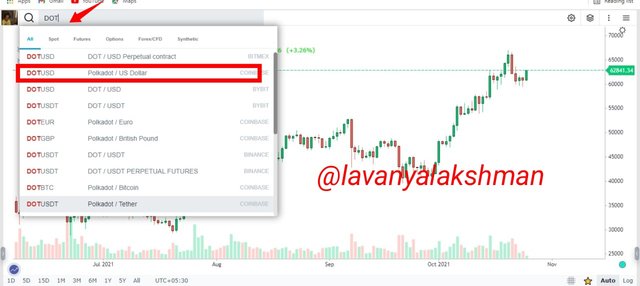
Now I successfully get Dot/Usdt chart on my web browser.
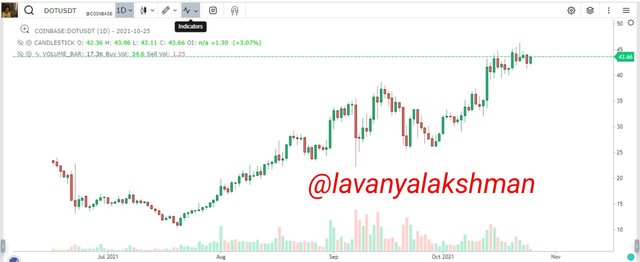
Now for applying ROC Indicator on my chart, Just go Indicator tab.
Then in the search bar just type ROC, In the popup menu select Price ROC Indicator.
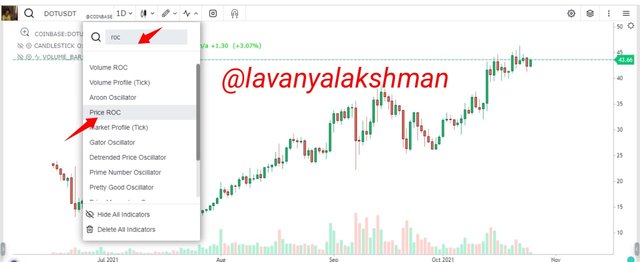
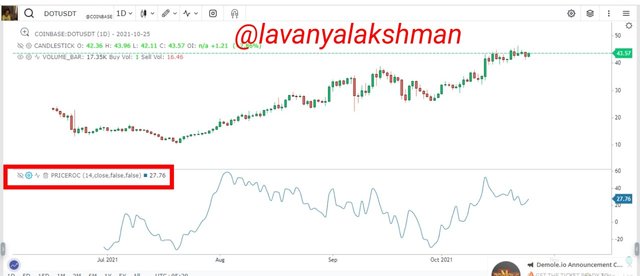
Now it successfully applied to my chart.
Like that we can add ROC Indicator on our needed chart very easily.
By default, it's Periods set to 14, those we can change as per our needs on selecting its setting tab.
Those periods and appearance we can change as per our needs.
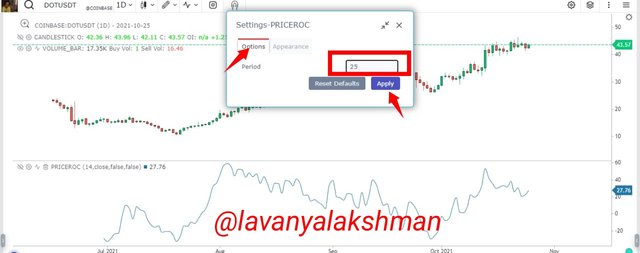
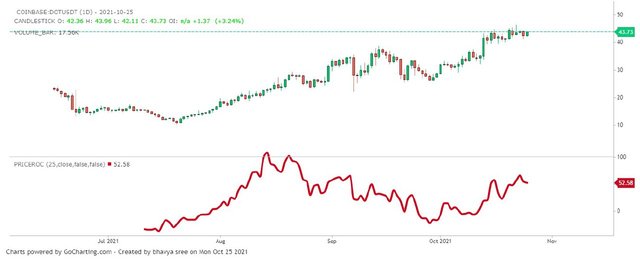
For Example, here I changing ROC closing periods from 14 to 25. For this, I just go to its settings tab, then select options, then enter 25 in the period's tab.
Then click on the Apply tab.
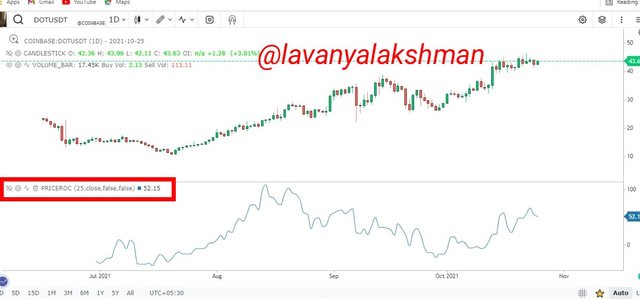
Now my changes we see in the ROC indicator.
Here we can also change its appearance on selling its setting then appearance tab.
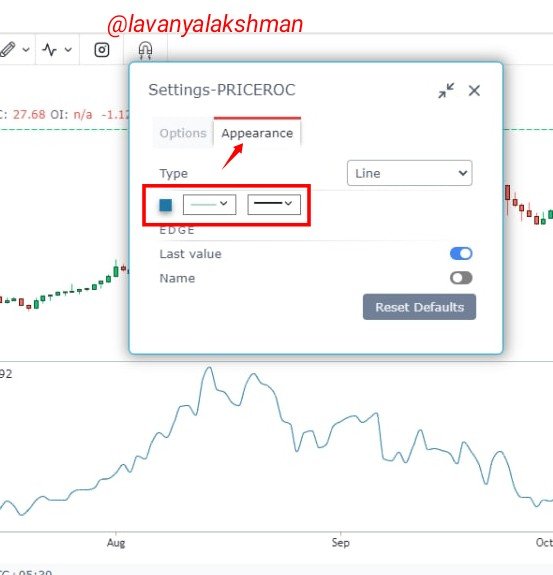
Those we can change as per our needs. For Example, here I changing, its colour from blue to red, then make it a thicker line.
After making all my needed changes then I close-setting tab.
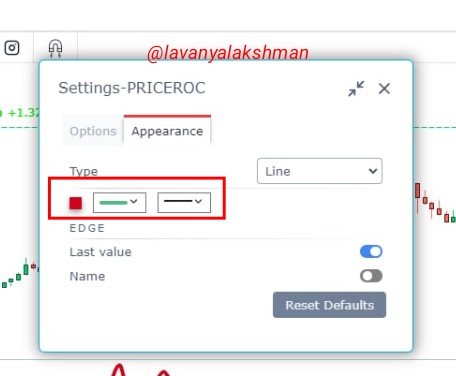
Now those changes have successfully been added to my chart.
Like that we can change it's closing periods and appearance as per our needs.
Coming me I prefer to set ROC closing periods to 25 always because it gives more accurate signals than 12,14 periods.
In my opinion, if we set 9,12 or 14 periods ROC indicator react very quickly, so there is a high chance to give wrong signals.
Because the ROC indicator gives signals based on the present closing price concerning our set period closing period only, It not an average, only work on closing prices data. So there is a high chance to give the wrong signal if we set shorter closing periods in the ROC indicator.
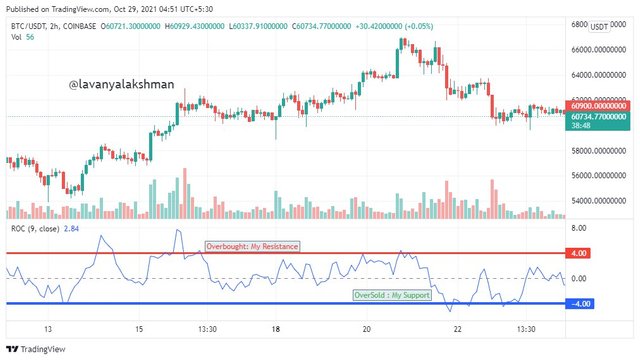
For example, if I set 9 closing periods in ROC Indicator, Then it gives a lot by Buy and Sells signals very quickly in 4 hours Time frame. But all are not valid.
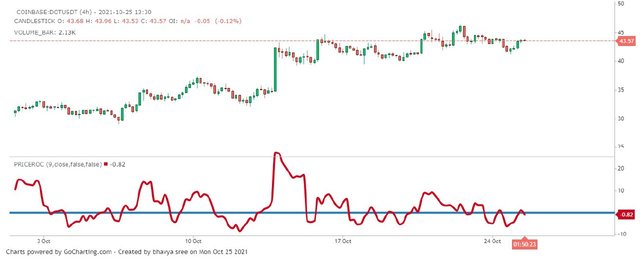
Here we get a lot of Buy or Sell signals, but all are not valid, there is a lot of fake signals from the ROC indicator. For avoiding this false signal from the ROC indicator it is better to use 25 closing periods is a good choice in my opinion. Because the ROC indicator responds slowly so we get maximum profitable signal compared to short periods.
On compared to 9 closing period ROC, 25 Closing Period ROC gives maximum profitable signals.
That's why I prefer 25 closing period ROC for my Trading needs.
Like that we can Trade on using ROC Indicator on the Gocharting platform.
Best ROC Indicator Settings:-
Here we can use different settings for the ROC indicator. There is no limitation at all. As per our wish, we can set our needed settings as per our requirements.
But most common for short term needs Traders to use 9 and 12 periods.
For Midterm needs 24 or 25, For long term needs 100 or 200.
But here Traders always keep in mind there is no absolute number that can give the right settings. So always must verify your decision with other Indicators too.
From this, we get more clarification.
Coming to me I prefer 12 periods for the short term instead of 9 periods. From this, we can avoid some huge volatility in the market, and possibly get profitable signals From ROC Indicator.
For Midterm needs, I prefer 25 periods, for long term 200 periods. Those are my requirements only not sure about those periods give always give accurate results.
So keep research and test based on your requirements. Don't follow others settings.
What is the ROC trend confirmation strategy? And what are the signals that detect a trend reversal?
ROC trend confirmation strategy
We already learned about how the ROC indicator gives signals.
ROC indicator shows % of change price from now to previous particular periods only.
This Indicator does not have any boundaries, so here Zero Line act as a Midpoint.
If we see the ROC moving above the zero line we consider it as a Bullish Scenario. So coin price is also in Uptrend.
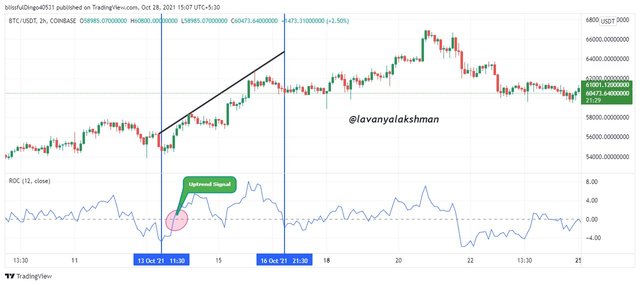
In the above example, I took BTCUSDT 2 hours chart. And set ROC at 12 periods.
In one place ROC start Moving from below Zero line to above, Price action also starts moving upside, so here we get Uptrend Confirmation. So we can consider as Bearish Trend ended soon we see Bullish Trend in Market.
If we see the ROC moving below the zero line then we consider it as a Bearish Scenario. So coin price is also in Downtrend.
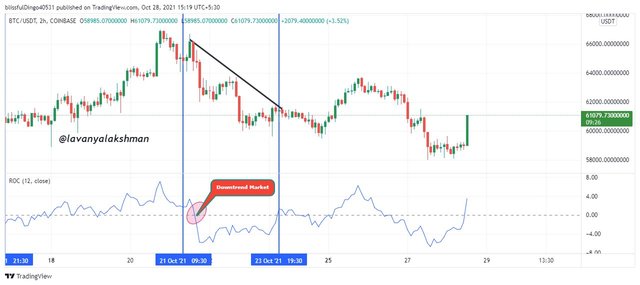
In the above example, I took BTCUSDT 2 hours chart. And set ROC at 12 periods.
In one place ROC start Moving from above Zero line to below, Price action also starts moving downside, so here we get Downtrend Confirmation. So we can consider as Bullish Trend ended soon we see Bearish Trend in Market.
Like that we can Identify trend confirmations on applying ROC Indicator on our chart.
Signals That Detects Trend Reversal with ROC Indicator
In General, we get Trend Reversal when Price action goes whether overbought or Oversold areas.
With ROC we detect those very easily. If ROC starts moving from the overbought area to a lower then we consider it as Bearish Trend, whether it moves from an oversold area to a higher then we consider it as Bullish Trend based on a specific Period.
What is the indicator’s role in determining buy and sell decisions and identifying signals of overbought and oversold؟
Any professional Trader before taking their position must check the chart once, and try to identify Price moments like OverBought and oversold areas on the chart.
Sometimes we get confused on identifying that area so we try to take confirmation from different Momentum Indicators on applying on the chart.
Based on this he can easily decide whether he enter or exit from that particular trade at a specific time.
The most popular indicators used to identify overbought and oversold conditions are the relative strength index (RSI) and the stochastic oscillator and Rate Of Change(ROC) Indicators.
On applying those on our needed chart we can easily identify Overbought, oversold areas very easily.
If the price action is in OverBought territory then taking Sell Short Position is a good choice besides Buy long. Because it is already in an Overbought position, there is a high chance to drop to its original price. So here we get a good opportunity to book profits on taking Sellshot from that price.
If the price action is in OverSold territory then taking Buy long Position is a good choice besides Sell Short. Because it is already in an Oversold position, there is a high chance to go back to its original price. So here we get a good opportunity to book profits on taking Buy long from that price.
relative strength index (RSI) and the stochastic oscillator both bonded with 0 to 100. So in general if that range shows above 70 range then that area is known as overbought, if it shows below 30 range, then it is known as oversold area. Like then we can identify Oversold and Overbought areas based on those Indicators.
But coming to ROC Indicator, it is not bounded so it has positive and negative ranges. So this Indicator little bit different compared to the relative strength index (RSI) and the stochastic oscillator Indicator.
If ROC Moving From zero to Passive Territory we can consider it as an uptrend Started, so soon we can take the Buy long position when we get the opportunity. Whether it falling from Zero to Negative Territory then we considered as Downtrend started. So we can take a sell short position when we get a good opportunity.
Buy and Sell Using ROC Indicator
We already know ROC does not have Boundaries and Zero lines act as Midpoint.
So our Buy/sell depend on the Zero line.
If ROC moves sharp from below Zero line to above we are considered an Uptrend. So we can place buy orders just above zero line and keep stop loss a previous lower point.

In the above example, I took BTCUSDT, 2 hours chart and apply the 12 periods ROC Indicator on my chart.
In one place ROC starts moving below the Zero line to above, so here we get Uptrend confirmation. So here we can Place Our Buy Positions. And keep a stop loss at a previous lower point.
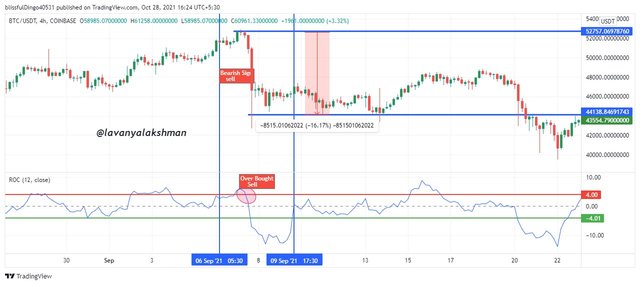
If ROC moves sharp from above Zero line to below we are considered a Downtrend. So we can place sell short orders just below zero line and keep stop loss a previous higher point or we close positions in that price.
In the above example, I took BTCUSDT, 2 hours chart and apply the 12 periods ROC Indicator on my chart.
In one place ROC starts moving above the Zero line to below, so here we get Downtrend confirmation. So here we can Place Our Sell short Positions. And keep a stop loss at a previous higher point or here we need to sell our holdings.
Like that Buy and Sell positions we take Using ROC Indicator.
Using the ROC Indicator in Detecting Oversold and Overbought Cases
ROC indicator does not have boundaries so not possible to exact overbought or oversold ranges based on the ROC indicator.
But here we get two types of situations for making good decisions at good times.
If ROC reaches its overbought position and cross over from the upper limit to the bottom, then we consider it as Bearish Trend started. So we can place sell orders.
If ROC reaches its oversold position and cross over from the lower limit to the higher, then we consider it as Bullish Trend started. So we can place buy orders.
But on checking the ROC chart we can set ourselves over bough and oversold areas as per our needs.
So here I taking +/- 4 range as overbought/oversold areas as per my trading needs. Here my over bough range act as resistance, and Oversold acts as Support.
So I set my chart like this.
Now we Discuss, based on this how we trade and how to Identify Those.
Overbought:-
When ROC reach the +4 range, then start moving the upper limit to lower, then we consider it as Downtrend Started. In this situation we need to close our orders and Place Sell short orders is a good choice. Because Market gets Trend Reversal so then after it goes Downtrend, soon there is high chance to reach its previous lower position. So placing Sell orders is a good choice here.
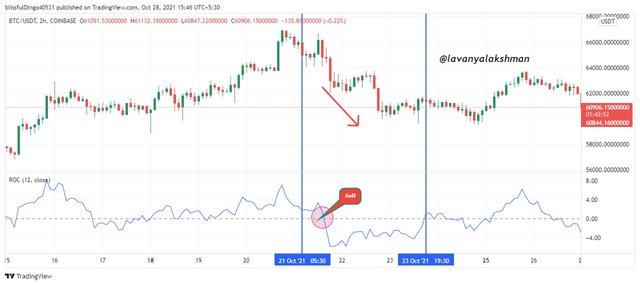
Here I took BTCUSDT 4 hour chart, and apply 12 periods of ROC.
In one place after reaching ROC in its Overbought area, then after starting moving Downwards, so here it gave the signal for Downtrend. So here we need to place sell orders rather than buy orders.
Oversold:-
When ROC reach the -4 range, then start moving the lower limit to the upper, then we consider it as Uptrend Started. In this situation, we need to place our buy orders and Place Buy long orders is a good choice. Because Market gets Trend Reversal so then after it goes uptrend, soon there is high chance to reach its previous higher position. So placing Buy orders is a good choice here.
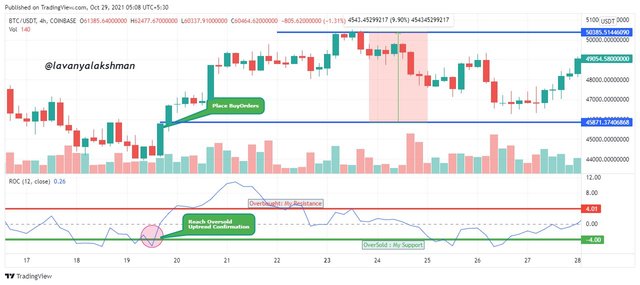
Here I took BTCUSDT 4 hour chart, and apply 12 periods of ROC.
In one place after reaching ROC in its Oversold area, then after starting moving Upward Direction, so here it gave the signal for Uptrend. So here we need to place Buy orders rather than sell orders.
How to trade with a divergence between the ROC and the price line? Does this trading strategy produce false signals?
Divergence signals we get very rarely in ROC. Because ROC is on Momentum Indicator, It always follows Price Action. But sometimes we get Divergence Signal from ROC also.
When ROC go against the Price action, in those situations we get Bullish Divergence Or Bearish Divergence.
Now we discuss it.
Bearish Divergence
When Price Action Going Uptrend, but ROC Moving towards the Downside. In this situation, we get Bearish Divergence.
It shows Sellers Domination rather than Buyers. Because the Market is an Uptrend, so a lot of Traders start booking their Profits, so soon we see some sort of Downward momentum in the market. So we get Downtrend Market soon after this Bearish Divergence occurs.
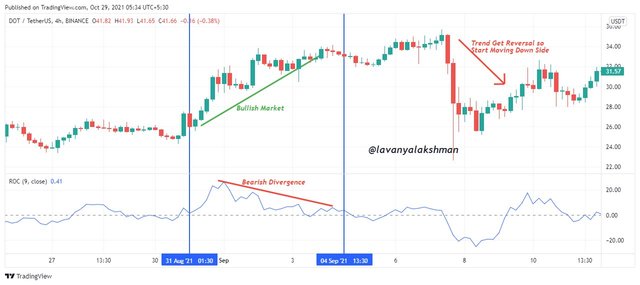
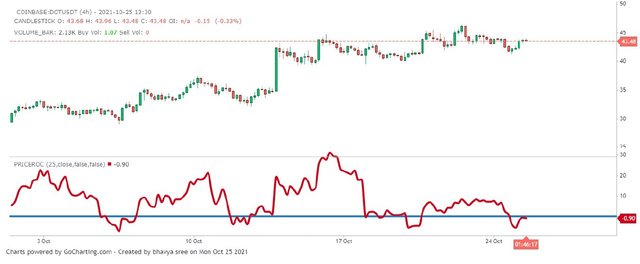
Here take the DOTUSDT 4Hours chart and apply 9 periods ROC.
On checking the chart, in one place I notice, price action moving upward direction but ROC showed a Downward moment. Here it makes Bearish Divergence. So soon Market starts moving Downside after occurring this Bearish Divergence.
It gives a strong sell signal to us, so in this situation placing sell orders is a good choice.
Bullish Divergence:-
When Price Action Going Downtrend, but ROC Moving towards the Upside. In this situation, we get Bullish Divergence.
It shows Buyers Domination rather than sellers. Because the Market is a Downtrend, so a lot of Traders start buying, so soon we see some sort of uptrend momentum in the market. So we get Uptrend Market soon after this Bullish Divergence occurs.
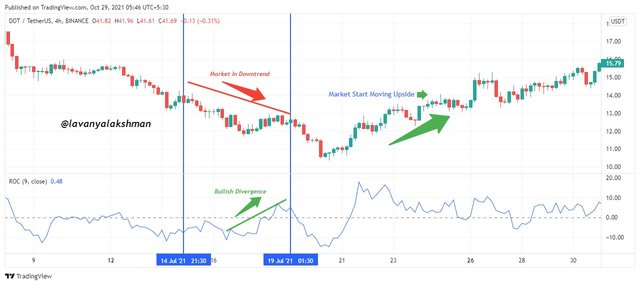
Here take the DOTUSDT 4Hours chart and apply 9 periods ROC.
On checking the chart, in one place I notice, price action moving downward direction but ROC showed an Uptrend moment. Here it makes Bullish Divergence. So soon Market starts moving upward direction after occurring this Bullish Divergence.
It gives a strong Buy signal to us, so in this situation placing Buy orders is a good choice.
Like that based Bullish/Bearish Signals from ROC we can place our Buy/Sell orders very easily, and exit from it with good profit.
False Signals of Trend Divergence
Before we learn after making Bullish/Bearish Divergence from ROC, the market gets Reversal. But this is not true always.
But sometimes it also gives a false signal. So don't trade blindly based on Indicator Signals.
Because Indicator gives signal based on previous data that's why it gives only assumptions only not conformations.
So don't depend on indicators for your Trading needs, always check price Action also, then take your decision.
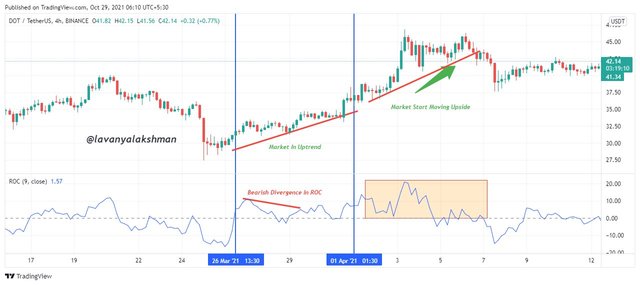
In the above example, ROC gives a Bearish Divergence Signal, but the market starts moving upward direction rather than a Downtrend after making Bearish Divergence.
But Actually after occurring Bearish Divergence market must go Downtrend, but it goes the opposite way.
It shows, here we get a false signal from ROC Divergence. So don't trade blindly based on Divergence Signals also. Always check market and price auction conditions then take your decision.
How to Identify and Confirm Breakouts using ROC indicator.
The breakout means when the price of assets moving an upward direction to break its previous resistance or price go below to break its previous supports, in that situation we called a Breakouts occurred in that asset price in that specific Time frame.
If we get Resistance Breakout then we get Uptrend movement in that asset, If we get Support Breakout then we get Downtrend Movement in that asset in the specific Time frame.
So on using Breakout Strategy we can do profitable trades very easily.
Breakout also we Identify using ROC Indicator very easily.
If you see sudden sharp changes in ROC Indicator, in Support or Resistance areas then there is a chance of Breakouts happening in that asset. Based on this we can place our orders for getting profitable trades.
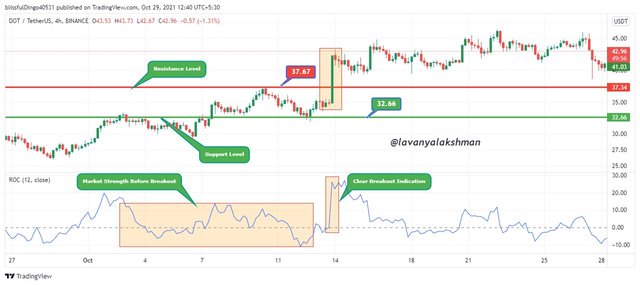
In the above Example, Here I choose DOTUSDT, a 4hour chart with 12 periods of ROC.
Before Breakout occurred Dot move between $32 to $37. So here around $32.66, we get support, around $37.34 range we having Resistance before Breakout occurred.
ROC also start moving up to Downwards, Showing Buyers and Sellers Dominations. After some hours, we see the ROC line sharp moving in an upward direction, and price action also moves towards its previous resistance with good volume. Finally, it breaks its previous resistance, and start moving upward direction on making new highs.
Here we get confirmation from ROC also.
Like that on applying ROC on our chart, we can identify Breakouts very easily.
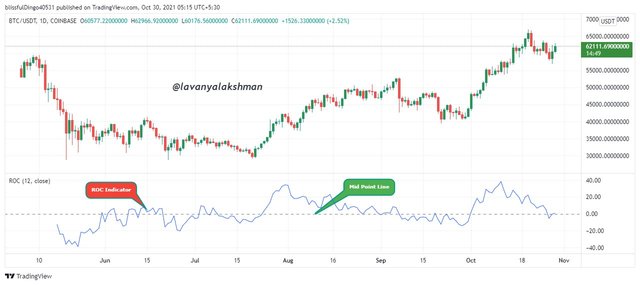
Chart Reading and define various signals given by Rate Of Change (ROC) Indicator.
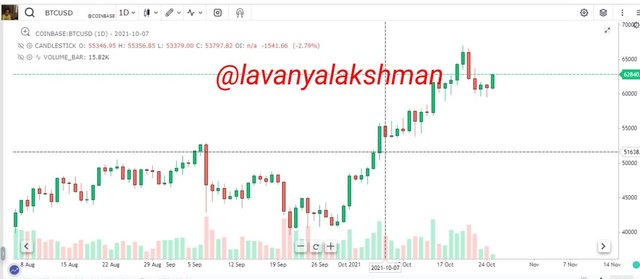
For this illustration, I take BTCUSDT, 1 Day chart and apply 12 periods ROC.
On checking the chart I get a lot of signals from ROC, Some are valid, some are invalid. But those signals fastly changed based on price actions.
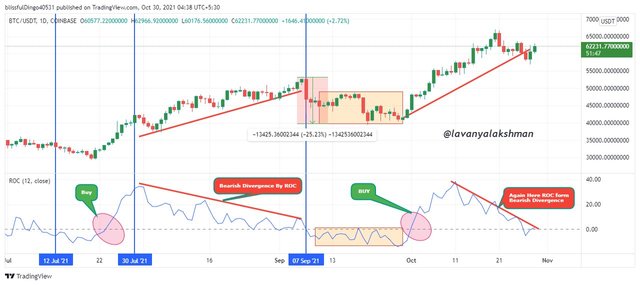
Firstly I get the Buy signal in the middle of June, then after BTC price starts moving up to $55k from $35k.
But in middle, it doesn't get any price drop towards its previous higher point. But ROC does not move along with price action.
But Price going upward direction up to the First week of September, but ROC forming Bearish Divergence against Price action.
So here we get signal from ROC, soon uptrend gets the end, again Bearish Market will start soon.
As per the Bearish Divergence Signal from ROC, the market starts moving Towards the Downtrend.
Here it loses nearly 25% from its previous higher price.
This Downtrend Market is continuous up to October.
In October first week again we get Buy Signal from ROC, so again Market Start moving upward direction.
Again from the middle of October ROC started farming Bearish Divergence to still now. Again it gives a strong Downtrend Signal to us.
Maybe then again we see Downmarket soon. But here no guaranty to occur, because it also gives false signals sometimes.
So Don't make your decision based on Indicators. Observe market conditions and updates then take your decision.
Like the different signals, we get from ROC Indicator.
Conclusion:-
As with other Indicators, ROC is also an Indicator. But it works based on Price Difference from current to Previous.
ROC move along with Price Action. Sometimes it moves against and gives Bullish/Bearish Divergence Signals to us.
ROC give price Momentum like the Uptrend /Downtrend Market is going at present. So based on this Traders can take their positions very easily.
ROC does not have any boundaries so zero-line act as the midpoint. So ROC above Zero line considered as Uptrend Market, Below Zero line Considered as Downtrend Market.
In my opinion, using ROC alone for our trading needs is not a good choice, always confirming those signals with other Indicators is a good choice.
Indicators with based on past data, so it hives only assumptions, not possible to give 100% valid signals. So Don't Trade Blindly using Indicators.
Thanks For Reading My Post
Thank you for sharing this very useful tool for all of us who are starting in this field of trading, for me it was very satisfactory, best regards
Thank you very much.
Hi @lavanyalakshman
Thanks for participating in the Steemit Crypto Academy
Feedback
Total| 9.5/10
This is good work. Thanks for demonstrating such a clear and well detailed understanding of trading using Rate of Change indicator.
Thank you very much.
#club5050 😀
Thank you very much for your great support.