Trading Using Wedge Pattern - Crypto Academy / S5W5 - Homework Post for @lenonmc21
Source
This task is based on the lecture of Professor @lenonmc21 the VWAP indicator trading strategy is quite educational and can be easily understood to then trade in the Crypto financial market with it along with the other indicators we already know.

1. Explain and define in your own words what the "VWAP" indicator is and how it is calculated (Nothing taken from the Internet).
Like any other indicator the VWAP indicator (volume weighted average price) shows the prices of an asset on average is used to confirm trend and the value of an asset in a time frame relative to a specific day.
It is composed of a moving line that moves along with the price and is used as follows: when the price is above VWAP the trend is bullish therefore at that point is giving us entry to buy assets, but when the price crosses below the moving line VWAP we can confirm that we change the trend to bearish therefore at that moment confirms us to sell the assets.
The VWAP indicator in relation to the temporality is different from other indicators such as the moving averages of 50 and 200 periods so these change depending on the temporality instead VWAP does not change temporality if we see it in 15M and we change to 4H it continues to have the same trend as in 15M therefore it is a very stable indicator where you can even confirm trends for future operations.
How it is calculated?
In this instruction we will discuss how the VWAP indicator is calculated.
The indicator consists of 3 most important parameters which are :
Price, Volume and Number of candles per day.
In order to calculate VWAP we are going to use this equation :
VWAP = P + V $ T / NDC.
Data:
Price = Where P
Volume= V $ T / NDC
Number of daily candles= NDC
we need to memorize this equation and take note of it for when we are trading in the market, as it is extremely important the data provided if we determine that gives an average price this means that we have an advantage since the data of each operation is reset every day. since the candles are only 1 day.

2. Explain in your own words how to correctly apply the "Strategy with VWAP indicator (Show at least 2 examples of possible inputs with the indicator, own charts only)?
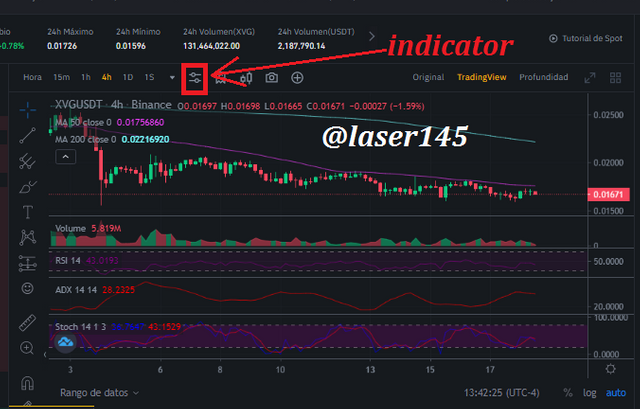
.I will explain with two different charts the process that should be applied to use the VWAP strategy correctly and as a reference I will use Exchange Binance,
I will add the chart indicator from the chart
we will look for indicators
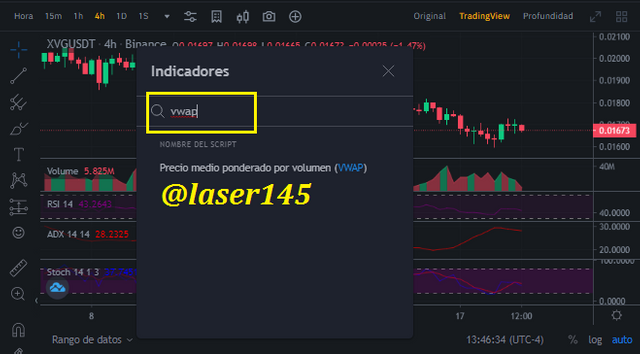
and then I will search for VWAP to add it.
Source
Then a window will appear in which we will type the word "VWAP" as shown in the illustration.
Source
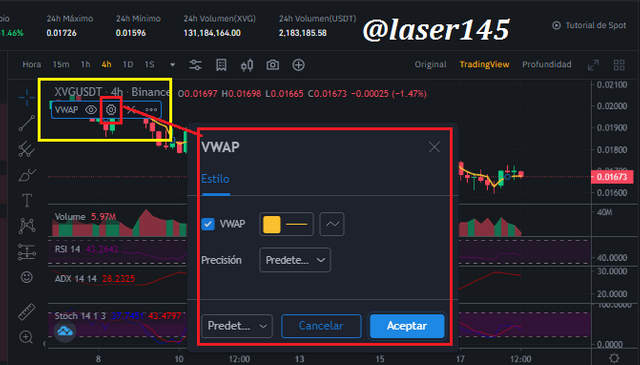
1-Then when it is added to the graph we go to configuration
2-Add the color that we like the most
3-Apply the line thickness that we want
Accept and ready
Source
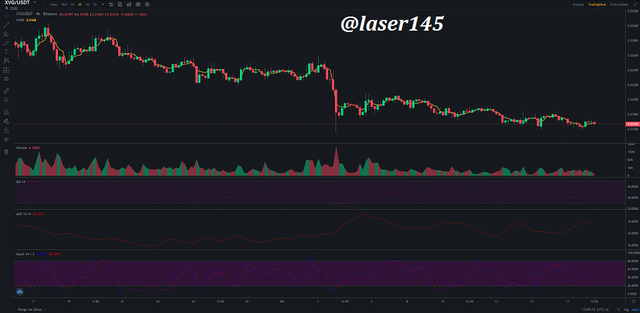
When we see the VWAP indicator on the graph, it is sorted and ready for analysis.
Source
To understand even more the structure of the VWAP indicator we must understand that this is a tool that is used to indicate the supports and resistances within the cryptographic market, if we see that the price crosses above the VWAP line means that the market is on the verge of a reversal, when the price is very close to the indicator is the time to enter into operation, therefore we have to take into account something very important the break of the VWAP line, then we can use another indicator to confirm the entry.
We must follow a rigorous protocol to be able to apply the strategy correctly.
Each strategy that you adapt to your needs is very important because it will depend on the success of your operation and this in turn the accumulation of capital according to your profits in the market. therefore we must try to apply all the knowledge we have about patterns and indicators adding in turn this VWAP indicator to confirm, so we will work with greater understanding and confidence.
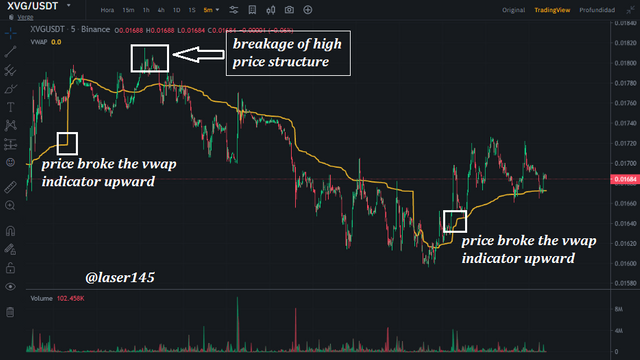
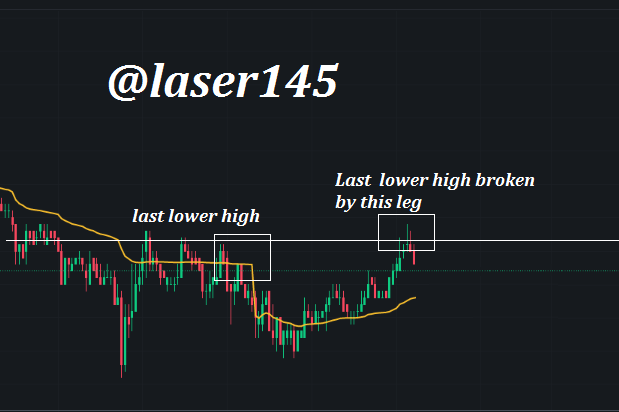
1-Breaking from bullish to bearish market structure:
.We are going to identify the last high or low depending on the trend we are in and then we must trade to have it break the high or low for the opposite direction wherever it is at the time we want to enter trade but once you must break the VWAP indicator but you have to see the breakout clearly.
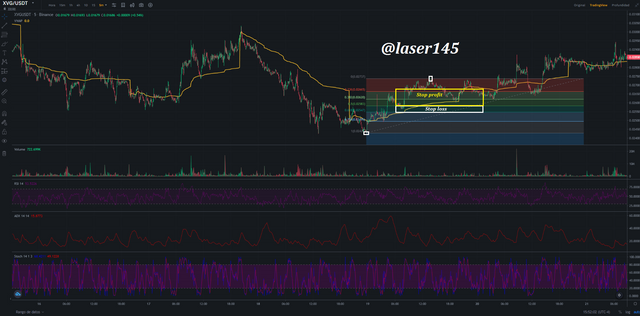
We see in this chart of XVG /USDT h4
Source
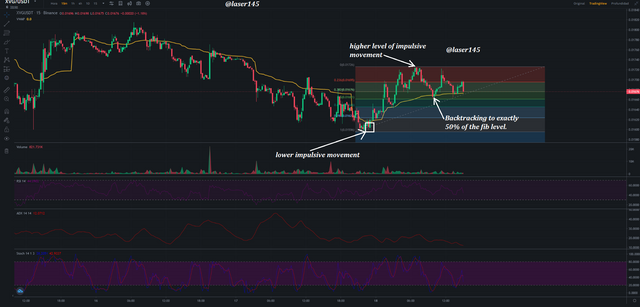
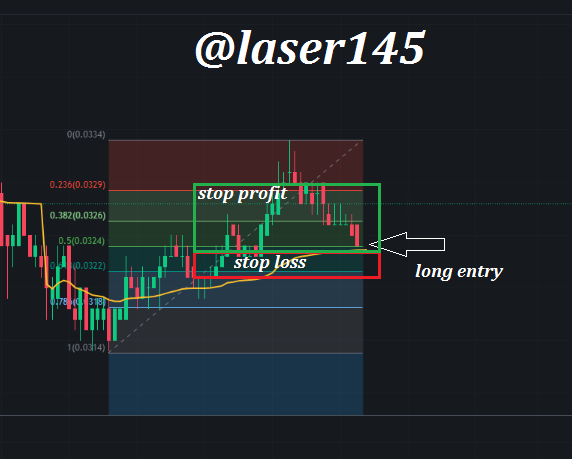
Retrogression to the VWAP we will use Fibonacci:
.Once the breakout of the previous high or low occurs we must wait for the retracement we have to be attentive and wait for this valla retreating to the VWAP indicator monitoring it respectively, we must measure as the case may be from the bottom to the top maximum or on the contrary if it is the case monitor the levels of 50% and 61.8% these two levels are important to be able to trade with VWAP.
As we can see in the previous graph we can visualize here.
Source
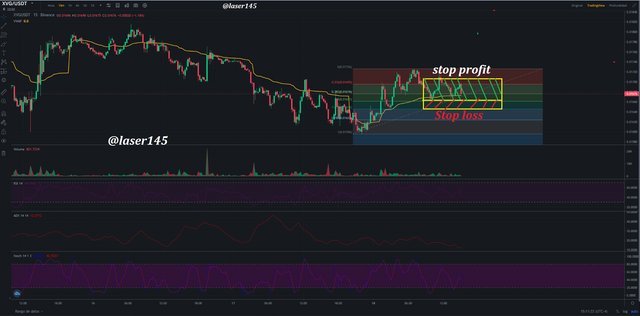
To manage risk it is important to follow some essential rules Place stop loss below the zone that is below 61.8% in FIB, i.e. take profit 1.5 times from the stop loss order this means that the profit ratio should be between 1 to 1.5 this strategy should be applied to maximize profits and benefits.
Source
3. Do you explain in detail the trade entry and exit criteria to be taken into account to properly implement the strategy with VWAP indicator?
.The entry and exit criteria for the strategy with VWAP indicator but the above steps should be strictly followed before entering trade.
Criteria:
1)- Take into account the market structure if it breaks up or down we can identify the previous high or low to break, therefore we must make this strategy work we must clearly see the breakout if we do not see it then the strategy has high probability of failure.
2)- The retracement is controlled after the confirmation of the breakout to either direction high or low, this will depend on the current market trend, therefore we must wait for the retracement of the impulsive movement using the Fibonacci identifying the low and high level of the impulsive movement we can determine the structure and we will observe at the 50% and 61.8% levels in conjunction with the VWAP indicator.
3)-using a good risk ratio of 1.5 times the stop loss order we recommend a ratio of 1. to 1.5 1.2 maximum.
Example: buy order chart:
Source
PRACTICE
4. Make 2 entries (one bullish and one bearish), using the strategy with the "VWAP" indicator. These entries must be made on a demo account, note that it is not enough to place the images of the entry, you must place additional images to observe their development so that they are evaluated correctly.
I am going to make the purchase in 5min at trasingvew.com.
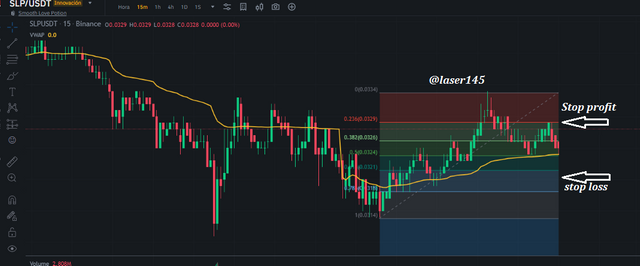
Buy order
I see the SLP/USDT chart in 15min there is a break of the previous high and at that time I will wait for a FB retracement to the 50% and 61.8% in to next chart I will apply the Fib, and set limits to enter trade to buy.
 Source
In this position I touched the 50% confluence at that point I bought and went long, that was the long awaited retracement to be able to trade the market and confirmation of the same, with a 1:1.5 stop loss ratio.
Source
After 1 hour I check and indeed we got out of the operation with the stop profit with profit, therefore the VWAP method was effective in this operation as we will see in the following image:
Source
This is my proof of purchase for the above transaction.
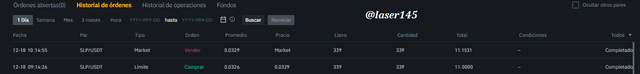
Source
Sales order
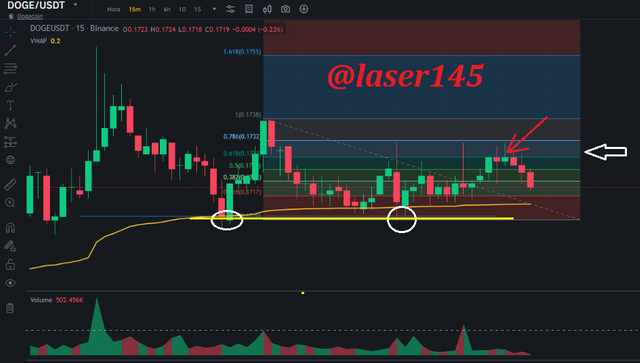
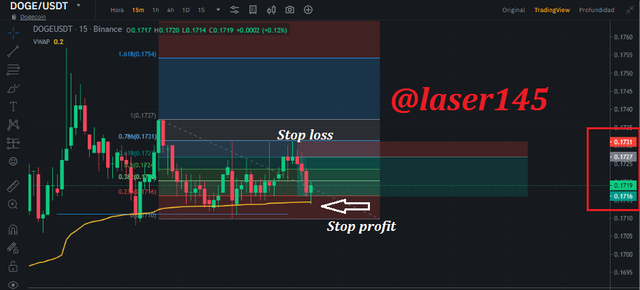
For this sell order we are going to analyze Doge/Usdt to demonstrate my understanding in a 15min time frame we see here in the next chart a double bottom then we deploy the fibonacci from top to bottom, and we wait for the retracement between 50% or 61. 8% in this case we see that it breaks but the candle closes just below the 61.8% so the next trade is valid this is the exact point where we will enter to trade placing a stop profit above 23% of the fib and a stop loss below 61.8% we see what happens next our relationship is 1: 1.5
Source
Then let's see how we won the operation below, we went out in profit with a gain of 1: 1:5 with respect to the previous stop loss so we can see that this method of VWAP is extremely effective and match all the pieces remember that the market does not always give us 100% accurate signals always take some movement to play with our psychology so we have to be firm in our strategy and place that stop loss in a strategic position that way the market can not liquidate you.
Source
Conclusion:
.The following research work of the VWAP indicator is a tool that is used in technical analysis therefore we have to take into account everything we already know and put it together with this indicator the strategy is easy but at the same time very complex, as it requires discipline and perseverance to learn exactly the proper functioning of this, the Fibonacci retracement to combine it and put it together with an RSI and ADX give us a very good way to perform technical analysis in the market and confirm the entries.
I loved this class because I had the opportunity to learn and know how to use a new VWAP indicator and it is also an excellent mechanism to identify support and resistance breakouts, depending on the price movement in the current market.
Cc: @lenonmc21
By: @laser145