Crypto Academy - Season 3 - Week 1 - [Assignment posting for @ kouba01] by @laser145
Source

1- What is the Ichimoku Kinko Hyo indicator and what are the different lines that compose it? (screenshots are required)
What is the Ichimoku Kinko Hyo indicator?
In 1930 during 20 years of testing was developed the ichimoku indicator by a Japanese called Goichi Hosoda, this is contributed to the market for selling rice in the place was observed in the graph changes that look every time repeated in a certain time then the Japanese conducted a deeper analysis to the market received at times outside help to sell and buy rice in short periods, Goichi Hosada used the method for 20 years and then captured it in a book. Which was adopted by many traders to perform their operations in Asia, in order to analyze the market trend buy low and sell high, the table should be read very carefully so as not to overlook any issue.
What are the different lines that compose it?
1= Tenkan-Sen conversion line.
If we look at the Blue line this is linked to the midpoint of 9 candlesticks is calculated by adding the high price with the lowest price and divide it by 2.
Source
2= Kijun-Sen reference line
The midpoint 26 candles is calculated by adding the highest price and the lowest price and then dividing by 2. It is identified by its white color.
Source
3= Senkou Span A phase interval:
We are going to look at it as a yellow line on the graph we can see that it is the midpoint of the price of the 26 candles, it is calculated with reference to the close of the previous trend and the beginning of the 26 candles e the new trend in this way we perform the correct method.
Source
4= Senkou Span B landing leg:
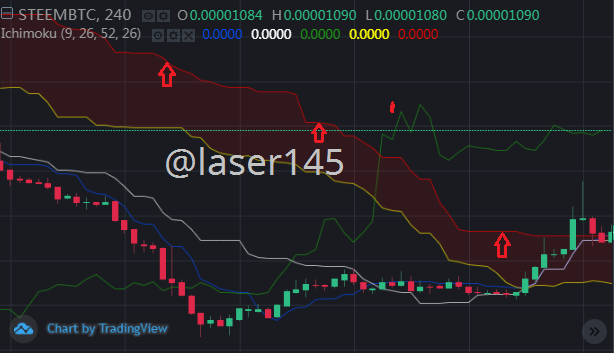
Represented by the red line is the midpoint of the tenkan line and the kijun line and is located inside the lines of the 26 sails. here an illustration:
Source
5=The lagging section of Chikou Span:
We are going to represent it with a green line, they are the average lines of 52 candles and this gives us as a result an average price of 26 candles when the last two lines form a cloud in the graph indicates us where the trend is.
Source
2- How to add the Ichimoku indicator to the chart, what are its default settings, and should it be changed or not? (Screenshots are required)
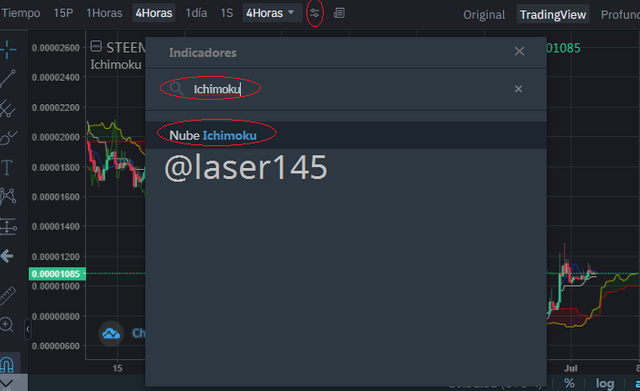
How to add the Ichimoku indicator to the chart?
Go to Binance Exchange or any other Exchange and click on these 2 dots
then type Ichimoku
click on it and that's it.
Source
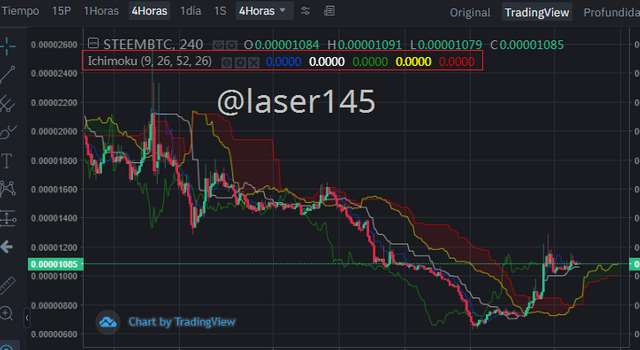
Well here we have already the Ichimoku indicator
Source
What are your default settings?
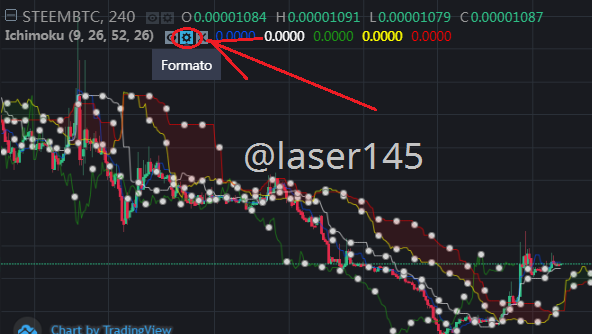
go to the gear that you see in the middle where the little arrow points and click on it.
Source
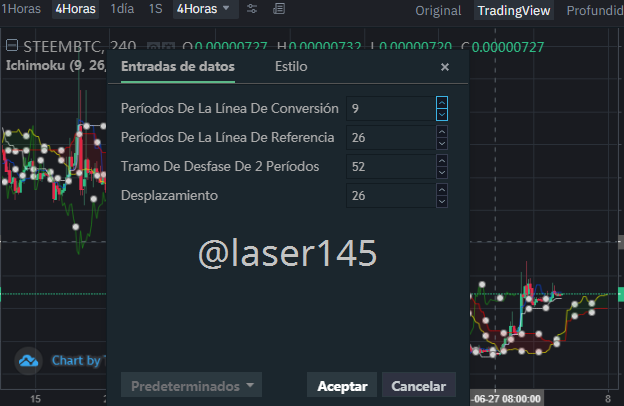
Here we can see the different data numbers and lines but we can also see that it has styles.
We can change the data between lines depending on the objective of our analysis.
Source
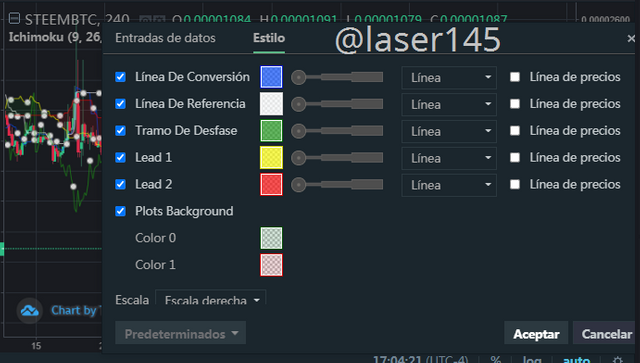
The style is very important, we can thicken the lines, change the color which creates a better way to appreciate and identify the lines.
Source
And should it be changed or not?
Of course if it is your convenience you can do it but you will choose it according to the market and the time of jobs in the professor's lecture he says that the most popular are in "10,30,60" but also in "20,60,120" my opinion is as long as you feel more comfortable and you get the results you require you can make the changes that fit our need and the market.
3- How to use the Tenkan Sen line? How to use the Kijun Sen line? And how to use them simultaneously? (Screenshots are required)
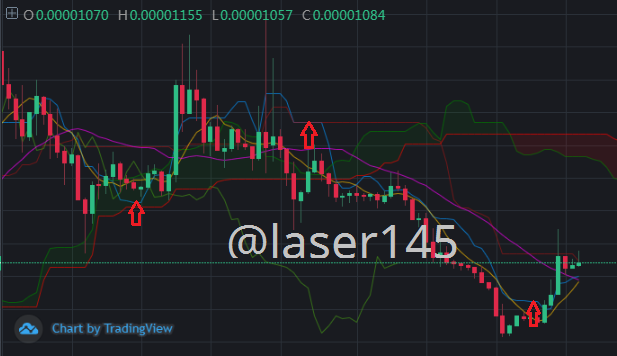
How to use the Tenkan Sen line?
is used to show the movement with respect to the cryptoasset the configuration I have is 9 periods, to use this line we must see the tenkan sen line above the kijun sen line, if we see this we are interested in buying because the price will go up, but if we see the tenkan sen line, below the kijun sen line, we have to sell because the price will go down.
How to use the Kijun Sen line?
if we see the kijun sen line, it is the price range for 26 periods if we see that the price is above the kijun sen line, it means that the price is about to increase, but if it is below the kijun sen line, the price will certainly go up, we have to be very aware of the tenkan sen line to determine the strength of the movement.
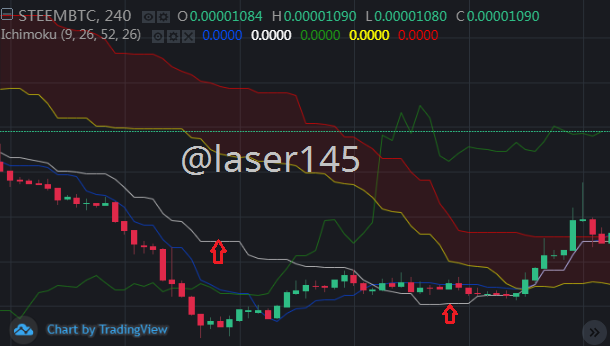
And how to use them simultaneously?
The two lines kijun sen and tenkan sen are used together, this does not generate trading signals, this indicates the best signal to make a decision on a market operation, these two lines mentioned depend on each other to signal a good result, if we see that the tenkan sen line is below the kijun sen line, this means that the price will fall, but on the contrary if the kijun sen line crosses the tenkan sen line above is that it will rise without doubt as it indicates a strong signal for the rise.
4- What is the chikou span line, and how to use it, and why is it often neglected? (screenshots required)
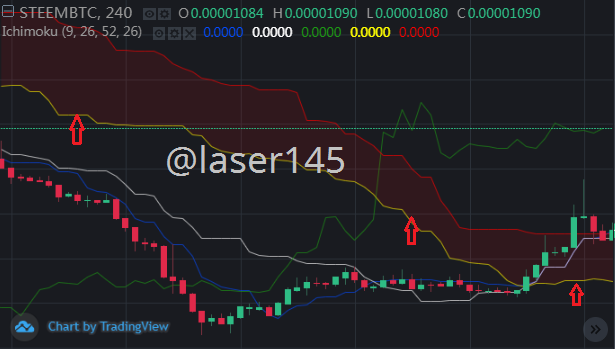
What is the chikou span line and how to use it?
is known as the moving average, and is related to the conversion line this projected for the 26 periods following the price close this happens after reading past and current market trends.
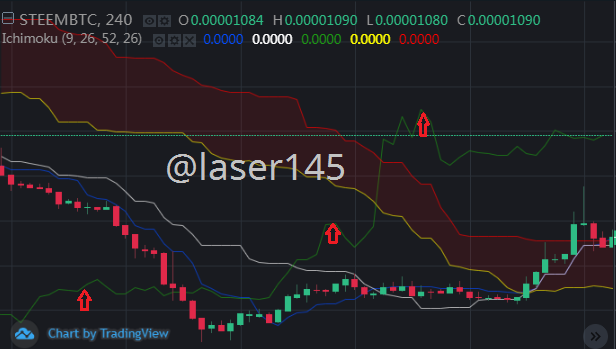
They are used as follows:
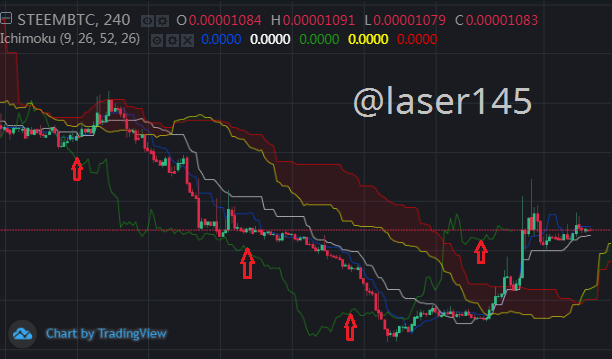
In the green line that we see below we can observe the current price in relation to the prices of the past periods if the price is above the chikou line means that it has little strength. in relation to the current price. but if the line is below the chikou span line. then it means that the price has a lot of strength to increase if the chikou span line crosses the candles then the trend will change according to its current market direction. as we see below in the given illustration.
Source
And why is it often neglected?
Because of the false signals many of us neglect this signals remember that as we indicated in the previous part the margin of the price by which this signal starts from the reading is from the last close of 26 periods. we must know how to identify the false signals in the market.
5- What is the best time period to use Ichimoku and what is the best indicator to use with it? (screenshots are required)
What is the best time period to use Ichimoku?
There is no best time period as it can be used at any time it will depend on the relationship of the time we want to enter trades the type of trades if it is short or long for example you want a short reading of 4 hours to trade up to 24 hours and our analysis is fulfilled or in shorter periods such as 1 hour to 30min for trades that take 6 to 12 hours to complete so I work.
And what is the best indicator to use with it?
You can use very well the RSI indicator in this way would be a good complement to analyze the charts and thus be able to better perform our technical analysis last season I remember studying it so I liked it so much that I do not stop using it now I will adopt these methods the ichimoku together with the RSI is a tremendous tool very powerful to trade the market.
Conclusion:
With respect to the indicators given in class as is the Ichimoku indicator can be used in the readings and thus be able to speculate the market according to its trend to operate much better thanks to that charismatic Japanese character who gave us that book after 20 years of work, that all his expertise was embodied in a book of a lifetime of incredible studies Goichi Hosoda thank you very much for sharing this book wherever you are. and to the teacher @kouba01 for opening us more and more the understanding and technical analysis of this incredible subject I am always surprised more and more of new things is that there are thousands of methods but this method is one of the best for analysis a big hug to my colleagues teachers and developed always updating for good this great academy.
Hello @laser145,
Thank you for participating in the 1st Week Crypto Course in its third season and for your efforts to complete the suggested tasks, you deserve a 3/10 rating, according to the following scale:
My review :
It's a work below what was required, as your answers lacked analysis and interpretation, with a complete absence of illustrations that contain various signs and that show the importance of using lines for Ichimoku indicator.
Thanks again for your effort, and we look forward to reading your next work.
Sincerely,@kouba01
Does it seem to you that it lacks illustrations? the work has 11 illustrations, and I answered correctly each slogan clear and precise to the point, that means each line where they are obtained for that serve each one of them. does it seem to you that it lacks illustration?
I am here since the beginning of the academy and I have always tried to do the research papers correctly. check if that msj that you put there was really for me and if so can you explain to me why it lacks content exactly I am a little puzzled with this analysis. with all due respect that you deserve as person.
@kouba01 @steemitblog @steemcurator02
The use of illustrations is intended to support a given idea or explanation. Most of your graphs contain arrows to highlight the position of the lines only.
In questions 3 and 5, there is a complete absence of illustrations that are required of you to explain your answers.
Most of your answers lack accuracy and depth in the analysis, as I kindly invite you to read the summary tomorrow, where I will fix most of the questions.
Excuse me professor, why do you put me 0 in originality? what does this mean? and also 0 in analytical comprehension? my work is totally original. i believe that what you wanted me to write did not have to affect the originality of the work, neither in the analytical capacity. practically what you say and what i deduce is that i do not have analytical capacity? Then how am I an engineer in my country? no offense intended, with all due respect to you, I ask you this question, excuse me if at any moment I have disrespected you, but I think you are being too zealous in your grading.
I respect your opinion regarding my evaluation of your work. Maybe you have a sense of injustice or something. I will put an explanation of my evaluation criteria in the summary.
feeling of injustice. I am already cured with so much injustice that my country Venezuela has, what I wanted to understand was in originality according to your evaluation I place myself 0 and in analytical quality I also place 0 but if you do not want to answer me clearly calm. I absolutely cannot do anything about it since my power is not that powerful. That was basically what I wanted to understand.
Away from the political aspects and the injustice experienced by your country does not concern us in our academy. Try to calm down a bit and read the summary to understand everything you want. It's just a contest, nothing more, nothing less.
I will not speak anything political nor will I speak of it. I know this is because I have been from the beginning since the academy began. But I asked why I place 0 "in originality and 0 in analytical quality and he did not answer me, it was just that I am well calm my feelings do not affect the contests, nor my business.