Homework-Task 1 by @stream4u Why Technical knowledge is Important in Trading and How To Read, Understand The Technical Chart? @laser145
Why Technical knowledge is Important in Trading and How To Read, Understand The Technical Chart?
What is the role of a technical chart?
One of its great advantages is that its principles and tools are applicable to the study of graphics in any market and in any period of time.
We can do technical analysis on forex, stocks, cryptocurrencies, indices, etc. and this analysis can be from the last hour or from the last 10 years, for example.
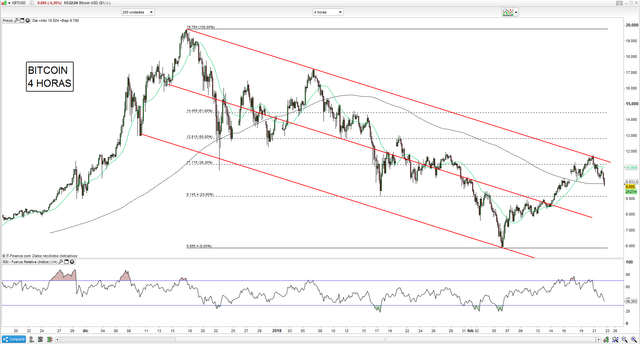
The main objective of technical analysis is to analyze the price action in the past to predict what may happen in the future.
In this way we will look for situations in which we can estimate where the price is most likely to move, we will take advantage of this situation and generate profits.

You can also view support lines, maximum movements in 24 hours and many important data that help you make a more correct decision when making a currency exchange.
Why do you think technical knowledge is important?
The technical analysis is important to analyze the movements of the price of a financial asset through the use of graphs and indicators, one of those great advantages is that its principles and tools are applicable to the study of graphs of any market and in any period of time.
Bullish or bearish trend, which one is good to buy a coin, explain why?
It seems to me that a trend would buy a currency on the downside and on the upside it would sell since then it would have good profits at the time of the bullish trend, being able to earn some money if we bet on the downside so the 2 trends are very good to invest everything is relative to the time of an investment
.jpg)
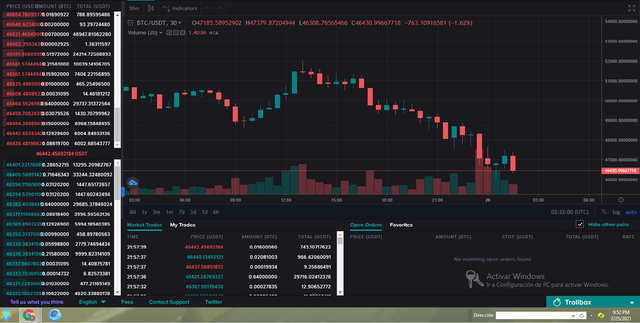
In the previous screenshot the most relevant thing I saw was a focus on the decrease in the price of the currency in this case btc decided to see this graph we can also observe in the last 24 hours the movements of the trend lines and the resistance levels and support, the volume niver is another very relevant data that many of us who analyze this type of graph look at, so we can say that it is in a downward trend at this time.

Thanks..
@stream4u
Crypto Teachers: : Steemit Crypto Academy
Cc: @steemcurator01
Cc: @steemcurator02
Cc: @steemitblog
Cc: @steem4u
Cc: @booming
I want to point out that it is never too late to achieve a goal that is why I have made this I hope you accept it as part of my great research and technical effort, greetings and thanks to all.