Crypto Academy Season 3 Week 4:[Beginners' Course] || Candlestick Pattern|| Homework post for prof. @reminiscence01 by @ladyofpolicy
Hello everyone,I feel super glad to join other students and participate in this week's lectures. It feels so good to learn about candle stick pattern because it really helps me to understand more on how to read charts and with the little knowledge I grabbed from the lectures,I strongly believe that my crypto journey is becoming a bit easier.
Without wasting much time,I will like to proceed with answering the homework question based on my understanding from the lecture class.

QUESTION 1.
In your own words explain the psychology behind the formation of the following candlestick patterns.
• Bullish engulfing candlestick pattern.
• Doji candlestick pattern.
• The hammer candlestick pattern.
• The morning and evening candlestick pattern.
Before I proceed,I will.like to explain what a candle stick pattern is.
Candlestick pattern simply means the ways in which price movements of a particular an asset are being displayed or it can be said to the the different forms in which a candlestick can appear with regards to the modification of its body,wicks and color which are the three features of a candlestick.
The wick.
The wick which can also be referred to the "shadow" is a feature which helps to understand the trading seasons.
The body.
The body is a feature which helps us to understand the control or strength of buyers and sellers over the price in a market.
The color.
The color is a feature which helps us to dictate the direction of price movement in the market.

A.
Psychology Behind The Bullish Engulfing Candlestick Pattern.

In bullish engulfing candlestick pattern,there are two bodies. The first one has a small body while the second one is the engulfing candle. The one with a small body represent the selling while the one with big body represents the buying power. So the bullish engulfing candlestick pattern is formed when the buying power covers(engulfs) the selling power which indicates that the market power has moved from the sellers to the buyers who now has the full control of the market.
B.
Psychology Behind The Doji Candlestick Pattern.
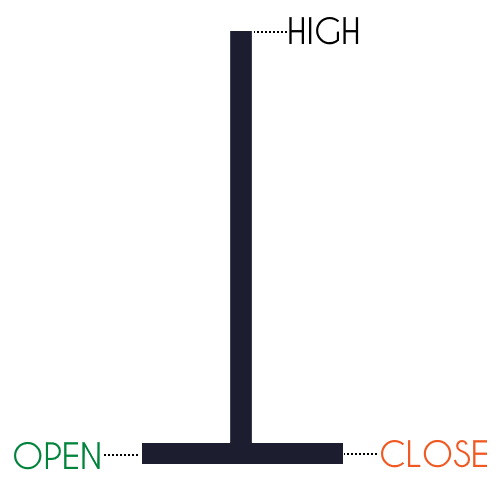
The Doji candlestick pattern is one of the most important Japanese candlestick. There are days when markets encounter indecisions and at such point market opens and closes at the same price rate and when such happens,a doji candlestick pattern will be formed.
Also we can say that doji candlestick pattern is formed when opening price equals closing price. There are three types of doji candlestick pattern which includes;
• Long-legged doji.
• Dragonfly doji.
• Gravestone doji.
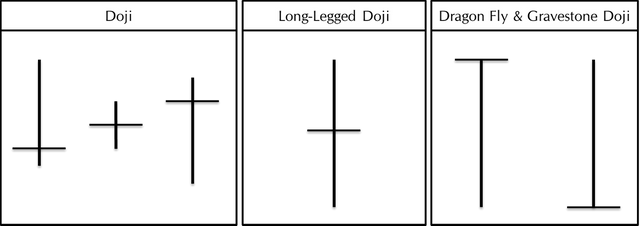
The long-legged doji.
This occurs when the market opens at a certain price,then the buyers comes and push the price up but the sellers interfered and push the price down but not below the opening price,still the buyers wouldn't back down and still try to push it up again bit at the end the market maintains its opening price because both the buyers and sellers has equal strength at this point.

The Dragonfly doji.
This occurs at the dominant sellers period,when a buyer with a big power comes and push the price up but not above the opening price .
%20(3).png)
Gravestone doji.
This occurs from a dominant buyers period when the seller comes and tries pushing the price down but not below the opening price.
C.
Psychology Behind the Hammer candlestick pattern.
The hammer candlestick pattern as the name implies, is a type of Candlestick Pattern which is in form of a hammer. It is formed after the price has been in a very downward momentum for sometime,so when this downward momentum is about to be shifted to upward momentum, the hammer Candlestick pattern forms. To further explain, this pattern is formed after the sellers drag price downward and because the buyers came in to the market with a very strong momentum which is greater than that of the sellers, they draw the price up significantly to an extent that it leaves a long tail. This long tail signifies rejection.
D.
Psychology Behind the Morning and Evening Star candlestick pattern.
The morning star candlestick pattern.
The morning star candlestick pattern is formed by 3 different candlesticks that looks like a curve. The psychology behind it is that at first,the sellers was in charge of the market which is the first bearish candlestick, but then a small bullish candlestick is formed. This small bullish candlestick announces the buyer's presence which is then followed by a very big bullish candlestick confirming that buyers are clearly the dominant party in the market. It is a very bullish candlestick pattern. the small candle in the middle can sometimes be a doji or hammer or inverted hammer.
.jpeg)
The Evening star candlestick pattern
The psychology behind the evening start candlestick pattern is that its an opposite of the morning star candlestick pattern. In the formation of the evening star candlestick pattern, the buyers were in control before the seller took charge of the market price. And in the formation of the evening star candlestick pattern, an uptrend signifies a strong downtrend (bearish) reversal pattern. Especially when formed at a resistance point.
.jpeg)
QUESTION 2.
Identify the candlestick patterns written in question one on any cryptocurrency pair chart and explain how price reacted after the formation.(screenshot your own chart for the exercise).

I will be explaining below the candlestick patterns listed in question one(1) on a cryptocurrency pair chart and the price reaction formation.
A. Bullish Engulfing Candlestick pattern.
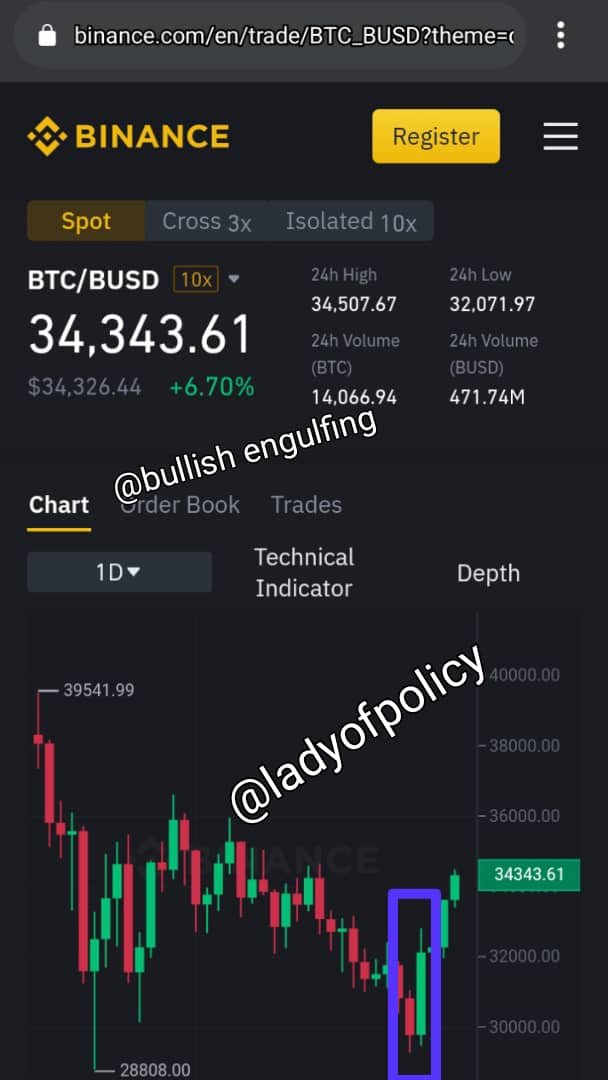
In the screenshot above, we saw a bullish engulfing candle form at a point and we saw price push up from there. it was a bearish candle followed by a very big green candle overshadowing it. This kind of pattern shows bulls making a big statement and taking the market away from sellers.
B. Doji candlestick pattern.
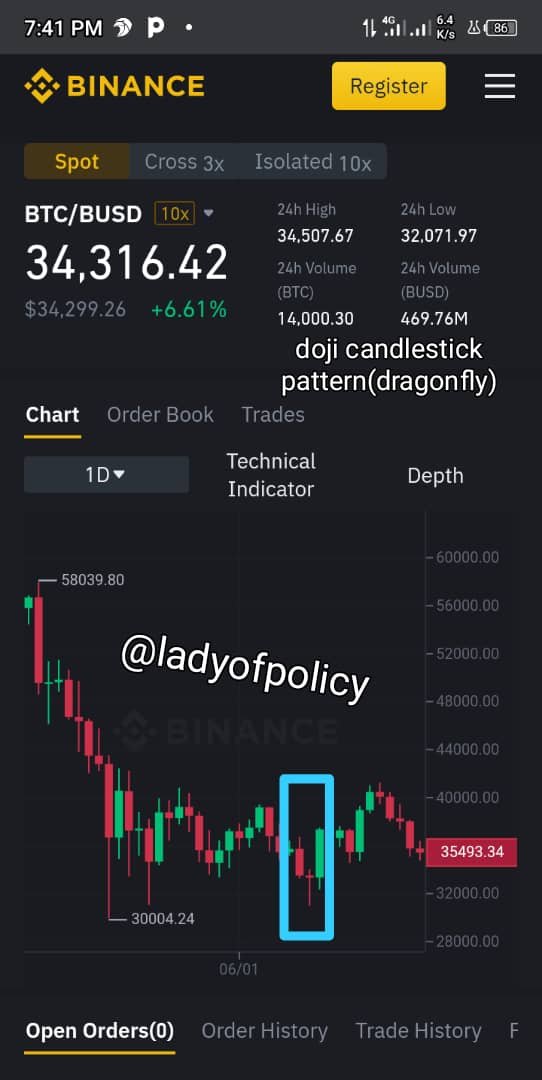
There are three different types of doji candlestick pattern but with regards to this assignment I will talk about the dragonfly candlestick pattern. The Dragonfly candlestick pattern gives the signal of a bullish reversal pattern, especially, when occurring in a downtrend.
As we can see in the above screenshot how there was a turnaround in price after the formation of a Dragonfly candlestick pattern, which occurs in a downtrend.
C. The Hammer Candlestick Pattern.
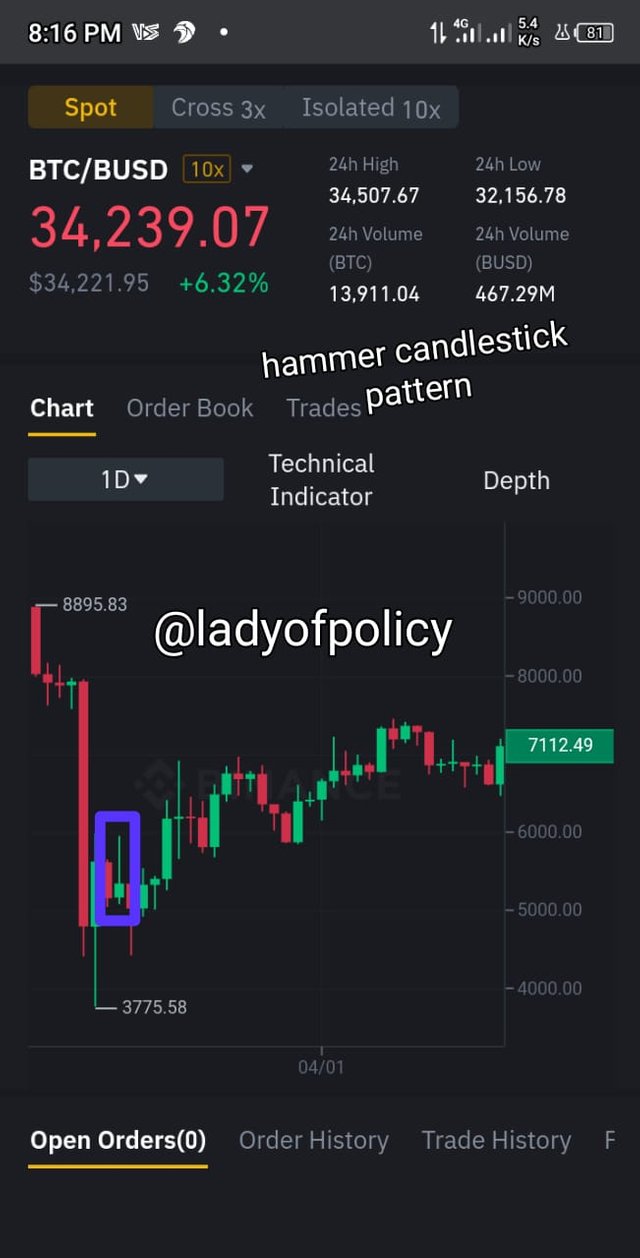
Hammer candlestick pattern is said to be a strong signal for price reversal when it occurs in a trending market, especially at a support level. Looking at the screenshot above, you can see that there was a change after the formation of the hammer candlestick pattern. Price reversal occurs in an uptrend after its formation. That is, the buyer was in control of the price after its formation.
The morning star Candlestick pattern.
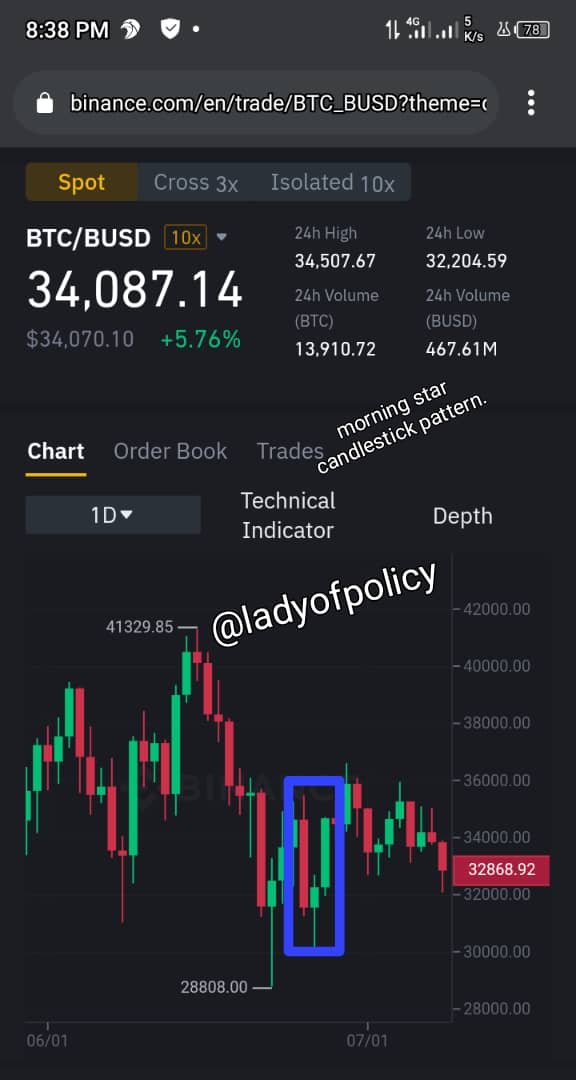
The morning star candlestick is made of three candles. It gives a strong signal of a bullish reversal candlestick anytime it occurs. But, it gives a stronger bullish reversal when it forms at the support area. Looking at the screenshot above, it shows that before there was a downtrend in the market price before the starting of the formation of the morning star candle which shows indecision of the traders (buyers and sellers) over the price. The formation of the morning star candlestick pattern brings about the bullish reversal of the price. As we can see that the morning star was formed at a key support level drawn and this was followed by a rapid move upwards.
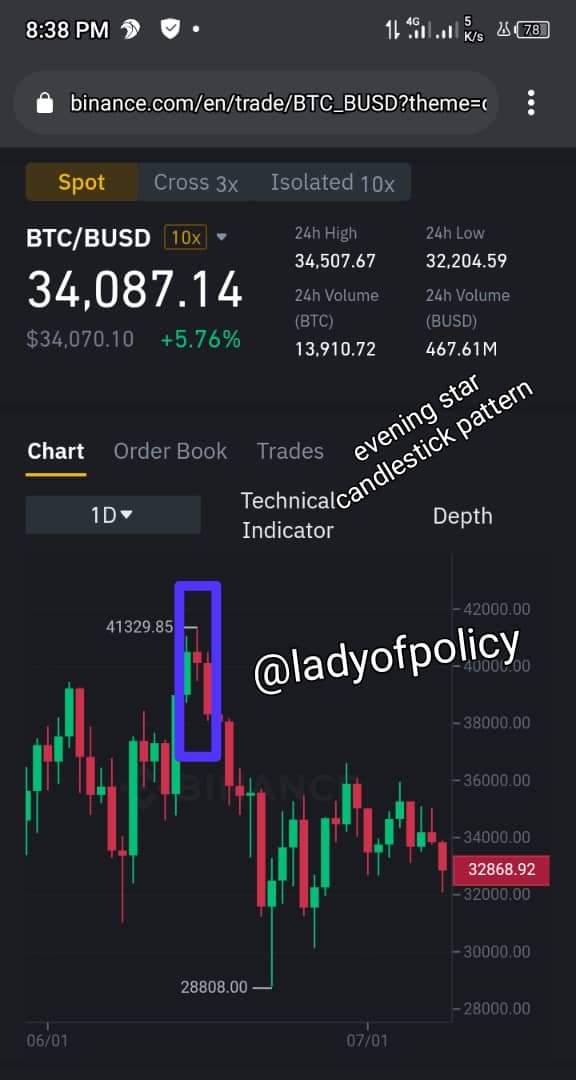
The evening candlestick pattern
The evening star candlestick pattern is an opposite of the morning star candlestick pattern and its also made up of three candlestick.
As we can see in the above screenshot, it shows an uptrend (bullish) of the market price before the formation of the evening star candlesticks pattern. But the formation of the evening star gives the signal of a strong bearish reversal of the market price, which occurs. That is, the sellers were in control of the market after the formation of the evening star candlestick pattern.
Using a demo account, open a trade using any of the Candlestick patterns on any cryptocurrency pair. You can use a lower timeframe for this exercise. (Screenshot your chart for this exercise).
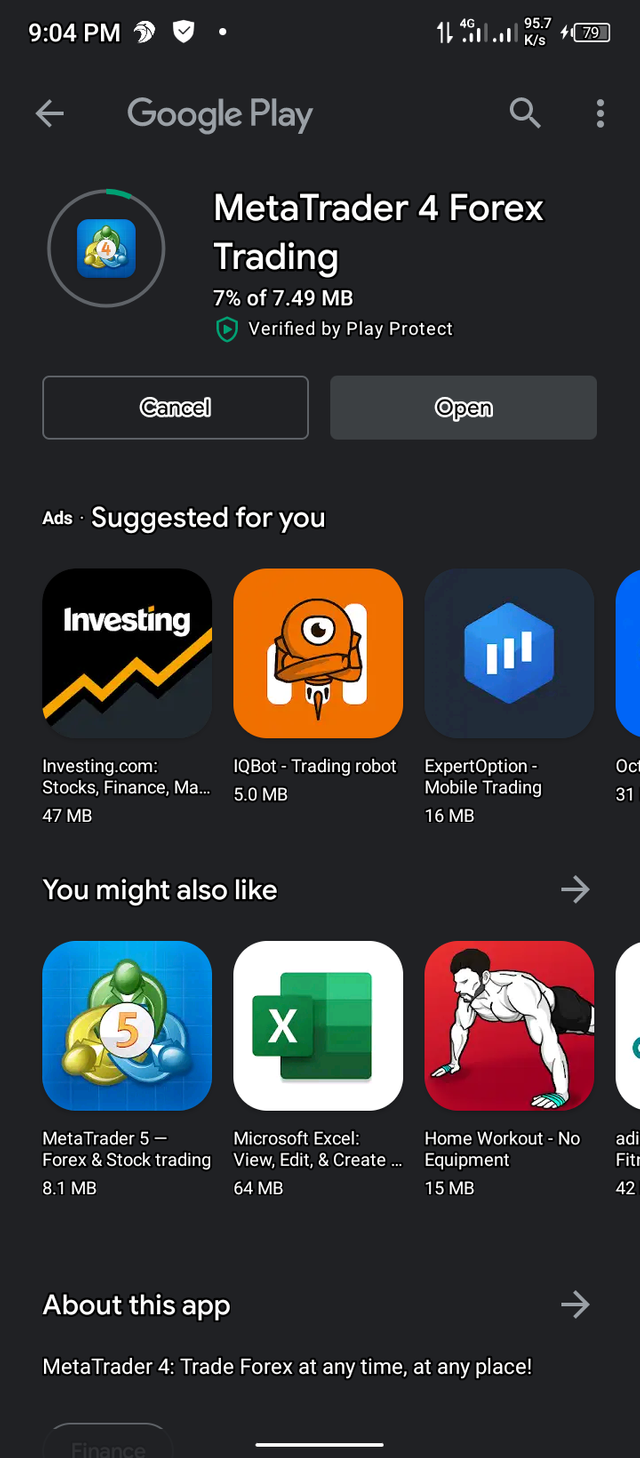
I will be using MetaTrader 4 demo account.
In order to carry out this exercise,I had to download the app from google play store first,then I opened a demo account.
My demo account.
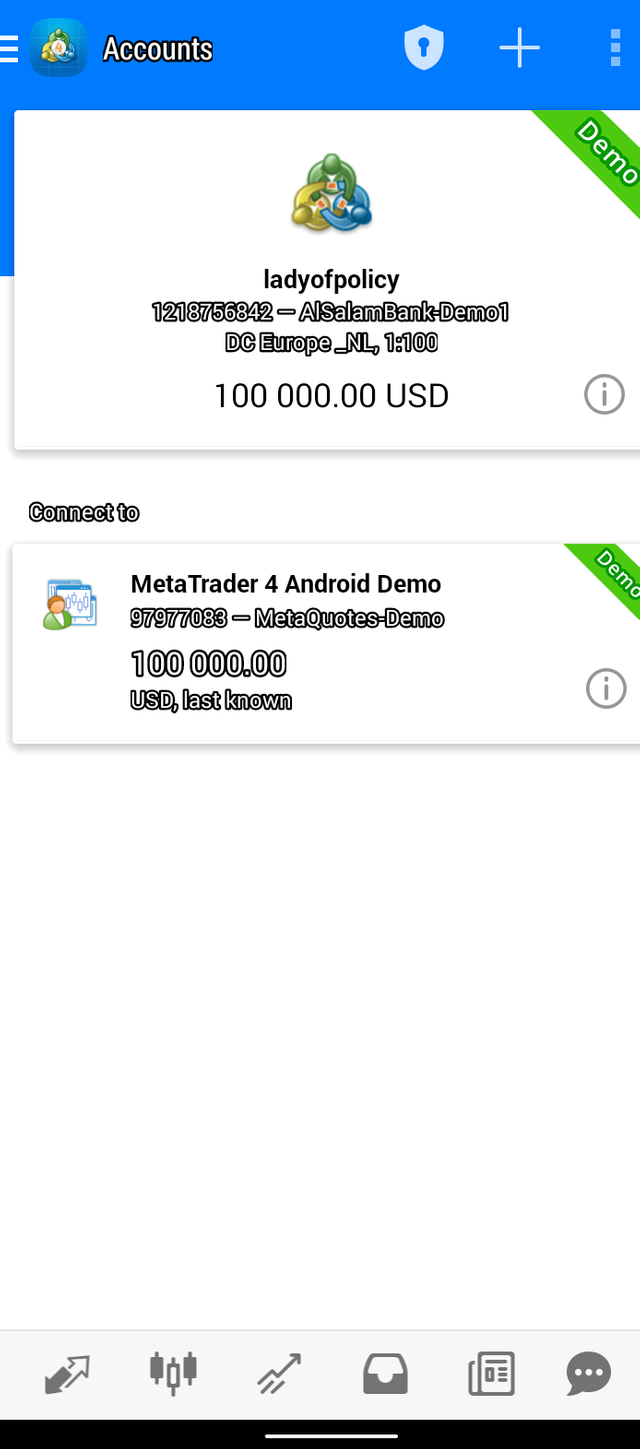
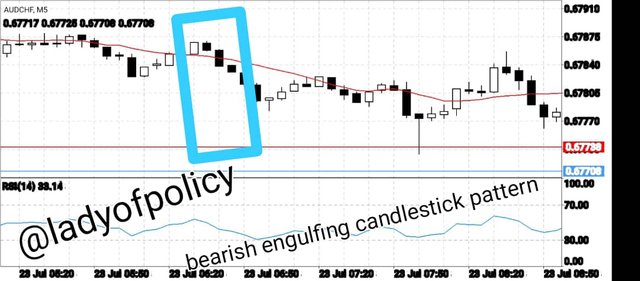
I created a demo account with the app with a 100,000 account. I opened up the chart of AUDCHF chart and we can see that bearish engulfing candlestick was formed. The black candlestick totally covered the white candlestick which led to a downtrend.
CONCLUSION
This class is indeed an eye opener for me on candlestick patterns together with types of candle sticks like ; doji, morning star, engulfing . Also,i learnt a lot of new things about how candle sticks are formed and I also learnt that these candlesticks can be formed anywhere but for it to be tradable, it must be formed at key levels.
Thank you so much professor @reminiscence01,though it was tough and time consuming but it worth it.