Crypto Academy Season3 Week3: Homework post for @lenonmc21| Trends, Supports and Resistances.
Thank you @lenonmc21 professor for this topic. It’s has really been an interesting one. According to my understanding, this is my homework research below.

1 Define In your own words what is a trend, trend lines and what is their role in charts
2 Explain how to draw an uptrend line and a downtrend line.(show a screenshot of each)
3 Define in your own words what supports and resistances are and how we can identify them.(screenshots required)
4 Explain in your own words at least two simple chart patterns with screenshots
Define In your own words what is a Trend, trend lines and what is their role in charts
A trend
A trend is the overall direction of the price of an asset. Trends are very important to traders during the trading process because trades are carried out according to Trend directions. Traders usually opt to trade in the direction of the trend with an aim of achieving profits from that trend. Traders normally identify trends using forms of technical analysis including trend lines, technical indicators and price actions.
Trends are useful to investors who use fundamental analysis because they have to first observe the trend in the market then decide whether or not to invest.
Trend lines
Trend lines are applied when identifying trends in the market prices. They are usually the uptrends and the downtrend that are looked at to determine and see how the prices are moving in the market. These trend lines are so important because they show the overall direction of trends . For example during an uptrend, the price seems to fall below the trend line but this doesn’t mean that the trend is over. The price may continuously move below the trend line and then continues rising to reflect a new price action in the market.
When establishing trend lines, a chart that is chosen has to be based on price interval periods that align with a trader’s trading strategy. There are different traders which include short term traders and long term traders. Short term traders use charts based on short interval periods that are usually not more than minutes.
Long term traders use price charts based on long term intervals such as hourly, daily, weekly, monthly or even yearly intervals.
Examples of trend lines
• Support trend lines
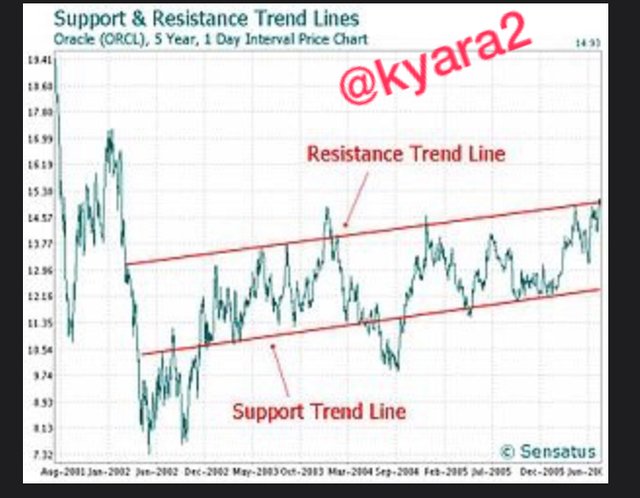
These trend lines are formed when an asset’s price declines and then rebounds at a middle point that aligns with at least two previous support middle points.
• Resistance trend lines
These trend lines are formed when an asset’s price rises and then rebounds at a middle that aligns with at least two previous resistance middle points.
Roles of trends and trend lines
• They are easily recognizable so that traders can use them when drawing them on charts to connect a series of prices together.
• They enable traders get good ideas of direction in which to follow so as to invest and the investment’s value is more weighable.
Explain how to draw an uptrend line and a downtrend line.(screenshot required)
Uptrend lines
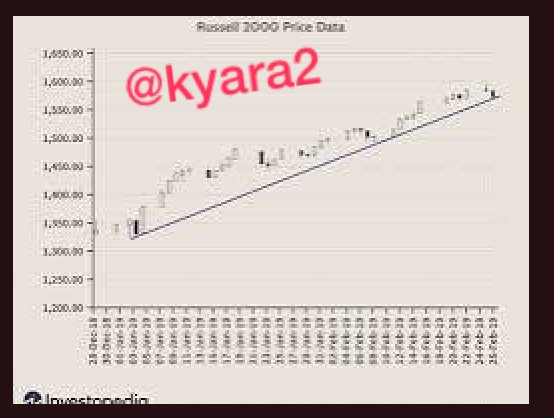
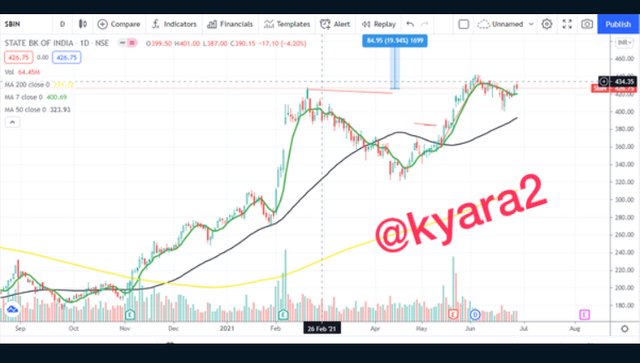
An uptrend line is drawn with consideration of uptrend in prices. You can draw an upward channel that has a support line at the bottom and then a resistance line at the top and middle line. It is better looking for buys when the market prices are below the support lines and look for sells when prices are above the resistance lines.
You should note that the more lines you put on your chart, the more you react. You have to identify uptrends in stock by considering the daily, weekly and monthly charts basing on your horizons and then this will help you be able to draw your uptrend line.
Downtrend lines
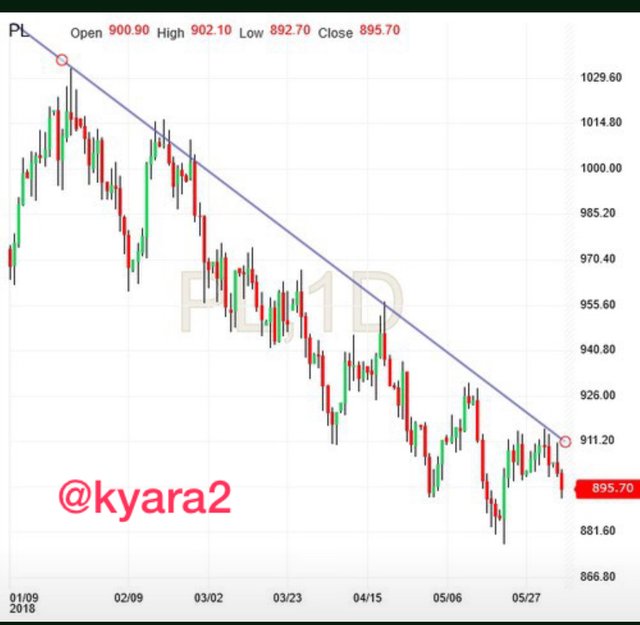
These are descending lines that connect lower highs during a downtrend. However, the upside penetration of downtrend lines is considered to be a technical buy signal.The break of the downtrend line signals an end of the trend and offers a trading opportunity to buy.
You can draw the downtrend lines by connecting lower highs and then matching the slope of the downtrend. A downtrend occurs when a stock makes lower lows and lower highs that lead to a fall in prices. The downtrend remains a trend until the series of lower highs and lower lows is broken. An upside penetration of a descending trend line is a buy signal and is usually the first indication that a downtrend is yet to occur.
Define In your own words “supports and resistances” and how we can identify them.(screenshots required)
Supports and Resistances are trend lines for price movements of a security. The trend lines are formed when a diagonal line can be drawn between a minimum of more than three middle points.
Support trend lines
They are formed when an asset’s price falls and then rebounds at a middle point that aligns with at least two previous support middle points.
Resistance trend lines
They are formed when an asset’s price roses and them rebounds at a middle point that aligns with at least two previous resistance middle points.
Their applications
• They can be used by traders when stock prices are moving between the support and resistance trend lines and then an investment strategy is used in purchasing stock at support and then sell it off at resistance.
• * When a price breaks through the principal trend line of an existing trend, the trend may fall so the trader considers trading in an opposite direction to the existing trend.
Support level
Is where the price finds support as it falls. This shows that the price is more likely to bounce off at this level rather than break through it.
Resistance level
This is a level where the price finds resistance as it rises. This shows that the price is likely to bounce off at this level rather than break through it.
Explain In your own words at least two simple chart patterns.(screenshots required)
A chart pattern is a pattern that is seen in a chart when prices are graphed. Chart patterns are integral aspects of technical analysis but they require some one to get used to them before they are effectively used. They take shapes within a price charts that help suggest what prices might do next basing on how they have done in the past. Example she of price patterns are as below.
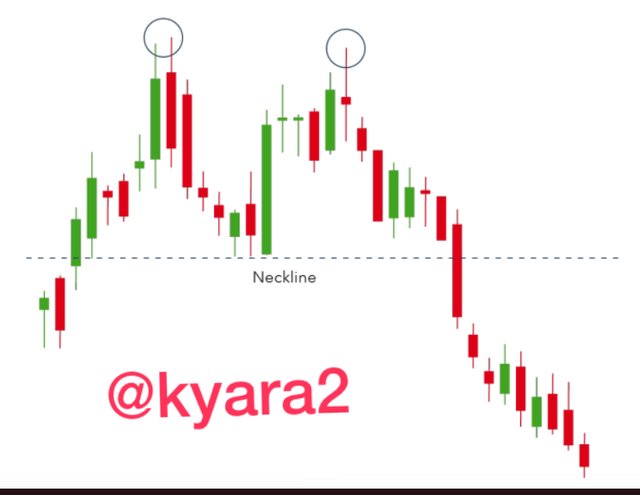
Double top
A double top pattern is used by traders to out spot trend reversals. In most cases an asset’s price will experience a peak before going back to the support level and then climb again before reversing back permanently against the prevailing trend.
Wedges
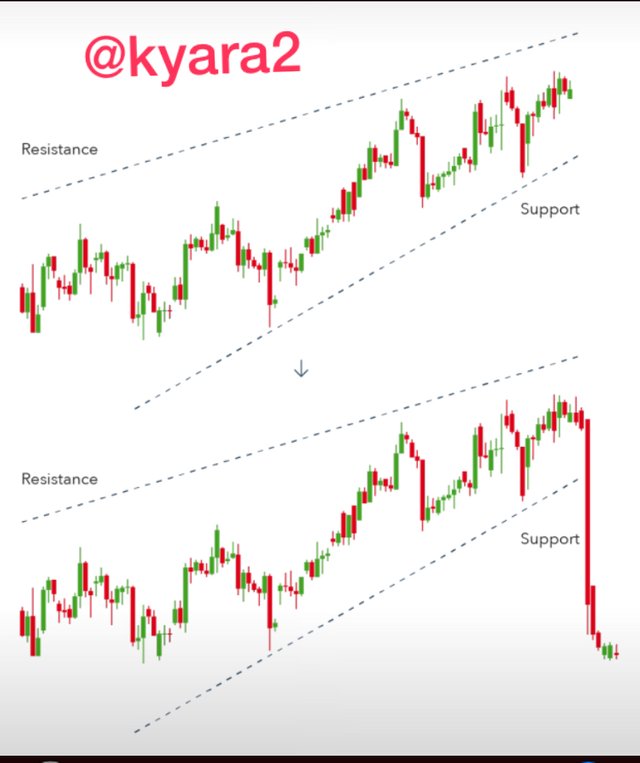
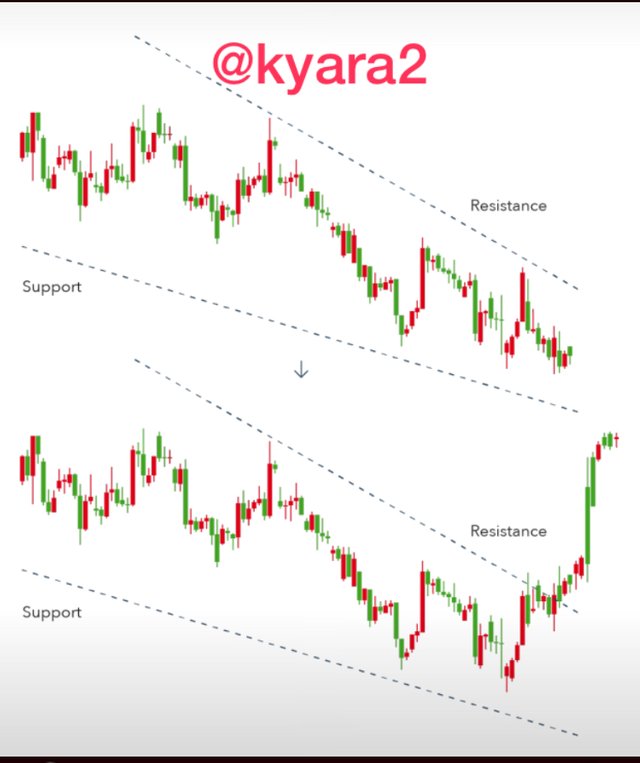
These form as an asset’s price tightens between two slopping trend lines. These are the rising wedges and falling wedges and they are seen below.
A rising wedge
The rising wedge is shown by a trend line between two upward slanted lines of support and resistance. The line of support is steeper than the resistance lines. This pattern generally shows that an asset’s price will eventually decline more permanently which is shown when it breaks through the support level as seen above.
A falling wedge
This one occurs between two downwardly sloping levels. A falling wedge is usually indicative that an asset’s price will rise and break through the level of resistance, as shown above.
