On-chain Metrics (Part 3)- Steemit Crypto Academy / S4W5- Homework Post for Professor @sapwood
.jpg)
(1) How do you calculate Relative Unrealized Profit/Loss & SOPR? Examples? How are they different from MVRV Ratio(For MVRV, please refer to this POST)?
(2) Consider the on-chain metrics-- Relative Unrealized Profit/Loss & SOPR, from any reliable source(Santiment, Glassnode, LookintoBitcoin, Coinmetrics, etc), and create a fundamental analysis model for any UTXO based crypto, e.g. BTC, LTC [create a model to identify the cycle top & bottom and/or local top & bottom] and determine the price trend/predict the market (or correlate the data with the price trend)w.r.t. the on-chain metrics? Examples/Analysis/Screenshot?
(3) Write down the specific use of Relative Unrealized Profit/Loss(RUPL), SOPR, and MVRV in the context of identifying top & bottom?

How do you calculate Relative Unrealized Profit/Loss & SOPR? Examples? How are they different from MVRV Ratio?

1. Relative Unrealized Profit/Loss
Whenever ever the word Relative is used it signals that one element is being compared to another. Relative Unrealized Profit/Loss is essentially about the ratio of the Unrealized Profit or Loss to the Market Capitalization of a cryptocurrency asset on the market. Before we consider the RUPL, a recap of Unrealized Profit/Loss is deemed appropriate.
Every cryptocurrency asset on the market has its Market Capitalization or value that is derived by multiplying the gross number of the coins or tokens supplied by the current asset price. This estimate of the asset's value is flawed because some coins are lost and may never be spent because users sometimes lose the keys to their wallets. Also, several cryptocurrency assets are not circulating because they are stored on cold wallets; hence, they are not available on the market for trade.
There is also a metric referred to as the Realized Capitalization. Realized Capitalization addresses the flaws inherent in the calculation of Market Capitalization. This metric determines the gross value of cryptocurrency coins or tokens through the multiplication of the number of coins by the mean price of those coins since they were last transferred between different wallets.
The deduction of the Realized Capitalization from the Market Capitalization is what is termed as Unrealized Profit or Loss. It is alluded to as unrealized because it is still hypothetical or a paper profit or loss. An Unrealized Profit is when the resulting value after the subtraction is positive, whereas an Unrealized Loss is a negative resulting number from the deduction.
Now, when the Unrealized Profit or Loss is further divided by the Market Capitalization, that is what we call the Relative Unrealized Profit/ Loss. It highlights the ratio between the potential profits or loss of cryptocurrency asset owners to Market Capitalization.
Relative Unrealized Profit/Loss = (Market Capitalization - Realized Capitalization) / Market Capitalization.
The Relative Unrealized Profit or Loss metrics are a good indicator of the emotional state of the market concerning the traders involved. A positive value can signal a euphoric or greed sentimental state. These states usually foreshadow a possible reason for traders to sell their assets to secure profits on the market. A negative value, on the other hand, signals sentiment such as stress and fears. Numeric values above 0.75 and below 0 are respectively called Top and Bottom. The negative value, especially when below 0, is a good signal for traders to purchase and accumulate assets on the markets.
A hypothetical instance based on Relative Unrealized Profit/Loss is as follows:
On 14th March 2021, the Market Capitalization of Cryptocurrency coin ABC is $450,000, and its Realized Capitalization is $320,000.
RUPL = ($450000 - $320000) / $450000
RUPL = 0.2889
The positive 0.2889 value positions the RUPL of crypto ABC in the Optimism or Denial Range on a graphical representation of the RUPL of the asset within a specified period.
2. Spent Output Profit Ratio
The Spent Output Profit Ratio, also shorthanded as SOPR, is one of the key on-chain metrics. The SOPR metric is primarily used to determine whether the cryptocurrency assets that are spent are done accordingly in a profitable manner or at a loss with respect to a selected time frame. It is also a good market liquidity indicator as it can communicate the trend of the asset’s supply movement. More importantly, the Spent Output Profit Ratio highlights the intensity of the Realized Profits or Loss on the chain as well as local Tops and Local Bottoms.
SOPR is a ratio of the value of the coins that were spent within a specific period to the value of those coins when they were last transferred(UTXO).
If the resulting value of the computation is less than 1, it means that most of the coins were spent or moved at a loss and also highlights a possible bullish reversal. Hence, traders buy and accumulate the coins. On the other hand, a SOPR value that is higher than 1 indicates profitable sales of the coins as highly valued cryptocurrency assets will be sold and evoke a bearish market trend. Furthermore, when the resulting numeric value is 1, this shows that the sales of the coins result in neither a profit nor a loss and that the trades end up breaking even.
With respect to liquidity, when the value of a SOPR is in an upwards trend, it suggests that more coins acquired realized profits. This usually hints at imminent sales where stagnant coins may return to the liquid supply of the market for circulation. A downward trend, nonetheless, hints at more realized losses, and a possible increased trend of non-liquid coins.
A hypothetical instance based on Relative Unrealized Profit/Loss is as follows:
The individual value of 18 Unspent Transaction Output (UTXO) of cryptocurrency ABC is $20. On 15th September 2021, crypto ABC was spent at the market price of $50.
Gross value of UTXO = 18 * $20
Gross value of UTXO = $360
Gross value of Spent Output = 18 * $50
Gross value of Spent Output = $900
Hence SOPR = $900 / $360
SOPR = 2.5
Since 2.5 is higher than 1, the transaction is of a Realized Profit.
3. How are they different from MVRV Ratio
The MVRV bases its computation on the ratio between the Market Capitalization of a cryptocurrency asset and its Realized Capitalization. The MVRV metric gives a good indication of how fairly the price of assets is on the market. It is additionally used to identify the tops and bottoms of a Spot market.
A SOPR, on the other hand, bases its calculation on the ratio of the spent value of a cryptocurrency asset to the UTXO value of those coins. It mainly signals if the assets are being spent at a loss or profit on the markets, and is instrumental in determining the local bottoms and tops.
RUPL conversely measures the unrealized profit or loss with a strong emphasis on its relationship to Market capitalization. Most importantly, RUPL is used for the identification of cycle Tops and Bottoms.
Consider the on-chain metrics-- Relative Unrealized Profit/Loss & SOPR, from any reliable source and create a fundamental analysis model for any UTXO based crypto
Relative Unrealized Profit/Loss
The GlassNode platform was used for the demonstration of this section. I selected the Ethereum cryptocurrency, and the RUPL chart for a period of 5 years, from 30-07-2015 to 4-10-2020, is shown as below.
%20(1).jpg)
On 16th June 2017 GMT, a cycle top on the RUPL chart has been highlighted accordingly. Its value as shown in the box is 0.9095, which is clearly above the 0.75 margins classified as the Euphoria range. The Ethereum cryptocurrency asset was selling at a price of $349.60. As mentioned earlier, a euphoria sentiment hints at a close bearish trend as holdlers would sell their asset to secure Realized profits.
The chart also shows the bearish movement that followed suit. The downwards trend furthered its course and entered a Capitulation range, which is denoted by red color. The orange color signals a sentiment of Hope/Fear, whereas the yellow ones communicate Optimism/Anxiety. Additionally, the green portions of the chart demonstrate Belief/Denial sentiment on the market.
%20(1).jpg)
On 14th December 2018 UTC, a cycle bottom on the RUPLchart above has been demarcated. The RUPL numeric value as shown in the box is-2.5, which indicated Capitulation. The Ethereum cryptocurrency asset was selling at a price of $84.32. As stated early on, a capitulation sentiment foreshadows an impending bullish trend as investors and traders would be seeking to acquire and accumulate their holding at a cheap price.
The chart also shows the upward movement that followed afterward as highlighted. The bullish trend was able to sustain until with significant fluctuations before entering the Optimism/Anxiety zone, after which another bearish trend took place.
Spent Output Profit Ratio
The GlassNode platform was used for the demonstration of this section. I selected the Ethereum cryptocurrency, and the SOPR chart for a period of 5 years, from 07-08-2015 to 4-10-2020, is shown as below.
.jpg)
On March 4th, 2016 GMT, a local top on the SOPR chart has been emphasized. The SOPR value is 1.388. Since the value is greater than 1, it was an incidence of a profitable selloff. Such events are followed by a bearish market movement because the traders begin to sell the assets. At the highlighted local top, Ethereum was selling at $10.34. It can also be seen that the local tops are frequently followed by bearish trends.
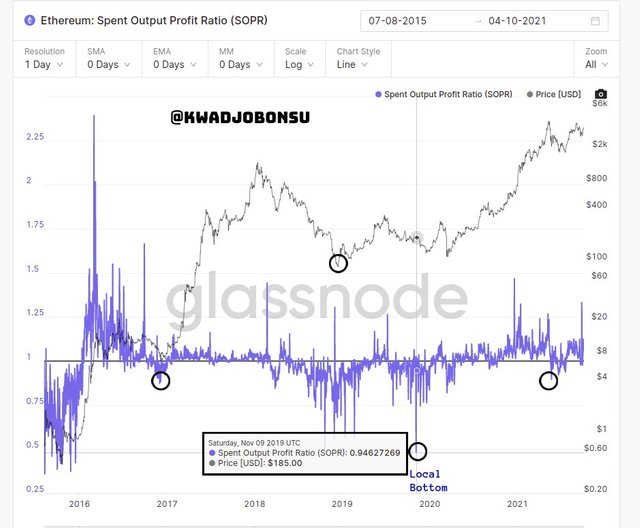
On November 09, 2019, a local bottom on the SOPR chart has been highlighted. The SOPR value is 0.946. We can infer straight away that the asset was sold at a low since the value of the SOPR is lower than 1. The local bottom is also known to be followed by bullish market trends because traders and investors take advantage of the market condition to acquire more assets at affordable prices. This event then drives up the price of the cryptocurrency asset. The Ethereum asset was sold at $185, and a bullish trend indeed followed after the local bottom.
Write down the specific use of Relative Unrealized Profit/Loss(RUPL), SOPR, and MVRV in the context of identifying top & bottom
The MVRV ratio, which is the resulting value of the Market Capitalization divided by the Realized, signals how overvalued or undervalued a cryptocurrency asset is by showing its mean profits or loss on the market. It, accordingly, can be used to determine the tops and bottoms. A value lower than 100% or 1 communicates a Bottom. This means that the asset is undervalued. Bullish reversals are common occurrences after the incidence of a bottom. Additionally, an MVRV value of 3 or 300%, indicates Tops. Since the asset is overvalued at this point, a selloff is always close and leads the market into a bearish trend.
The SOPR ratio, which is based on the division of the Spent Output by the Value of the UTXO, is also useful in determining Tops and Bottoms. A SOPR value is lower than 1 means that the cryptocurrency assets were spent at a loss. Hence, a Bottom is identified. Bottoms, as already established are followed by a bullish trend as many traders would want to purchase and acquire the asset at an economical price point. Alternatively, a SOPR value greater than 1 means there is a Realized Profit situation. This circumstance leads most traders to sell their assets, and a repercussion of such action is a bearish market movement. Tops are identified in zones with values greater than 1.
The RUPL ratio is achieved by dividing the Unrealized profit or loss by the Market value of the asset. It has key essence in identifying the Tops and Bottoms. A value of 0.75 or greater signals a Top. Tops are respectively followed by downward price movement on the market as violent selling of the asset takes place. On the other hand, a RUPL value of 0.25 or less highlights a Bottom. These ranges are also followed by bullish trends as traders accumulate more assets at cheaper prices.
Conclusion
Traditionally, cryptocurrency traders relied on Price Actions and Technical indicators to predict the direction of the price of an asset on the market. These strategies have their best days and certainly many flaws. The addition of the On-chain analysis adds a new breadth to the analytic scope of cryptocurrency assets. It has various metrics for assessing the conditions of the market. Some of them include RUPL and SOPR ratios.
These ratios have their distinct formula for computation as discussed in this article. The RUPL additionally highlights cycle tops and bottoms, while SOPR highlights local tops and bottoms. There are also other on-chain metrics such as the MVRV, which is also Top and Bottom indicator. The beauty of it all is that all these metrics can be considered as long side the signals of technical indicators and price action for strong signal confirmation.
I am grateful to Professor @Sapwood for this challenging, fun, and educative piece.