Hello Everyone. I am well, and I hope so are you. This article is my assignment for Professor
@asaj’s incredible lesson on Crypto Assets and the Random Index (KDJ). I had a fun time reading the lesson notes and a more fun time researching to complete the homework. This lesson has added to my knowledge concerning trading tools. I believe it has made me a better person. I thank Professor
@asaj for this great opportunity to learn from him.
The assignment was given as follows:
In your own words define the random index and explain how it is calculated
Is the random index reliable? Explain
How is the random index added to a chart and what are the recommended parameters? (Screenshot required)
Differences between KDJ, ADX, and ATR
Use the signals of the random index to buy and sell any two cryptocurrencies. (Screenshot required)

In your own words define the random index and explain how it is calculated

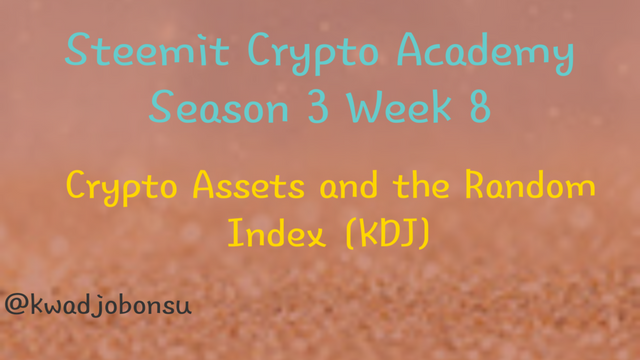
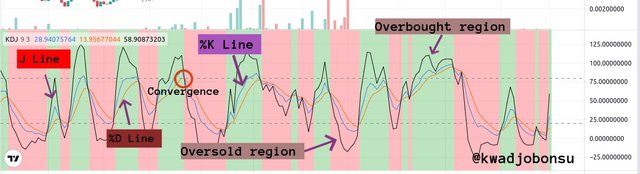
KDJ or better known as Random Index is one of the commonly used technical indicators by traders. It is a derivative of the Stochastic Oscillator and hence shares some functional resemblance. KDJ as a technical indicator is primarily utilized for performing analysis and forecasting the breakout price trends of assets or stocks on the market. Its name KDJ is an abbreviation of its three major components: the %K line, %D line, and the J line. By default settings, the %K line is usually assigned a blue color, while the %D line is assigned a red color. The J line is usually black in color by default preset. %K line is a fast stochastic line and is more sensitive to prices changes compared to the %D line. KDJ indicator is often a great tool for scalping profits on an active market but can render wrong signals to traders in the event of a flat market. As such, traders and investors take precautions with its usage.
The KDJ, in contrast to the regular Stochastic Oscillator, possesses the third line as mentioned earlier. This is the J line. Its purpose is to signal the divergence between %K and %D lines respectively. Divergence is the event when the fast and slow stochastic lines are unable to keep up with the market price. For instance, a stock on the market dips to a new lowest low, but the respective stochastic lines fail to follow suit. This usually represents a possible reversal on the markets and is of essence to traders and investors. So with the KDJ technical indicator, the J line demonstrates how the %D line is diverging from the %K line on the chart.
The three lines are calculated as below:
%K Line = (the Closing asset price – the minimum price of the asset within a specific time period) / (the highest asset price - the minimum price of the asset within a specific time period)
%D Line = SMA of 3 Periods of the %K line
%J Line = 3 %K - 2 %D
As a derivative of the Stochastic Oscillator, KDJ or Random Index is bounded between a range of 0 to 100. The 0 line represents the lowest asset or stock price recorded in a specific range of time, whereas the 100 line represents the highest stock or asset price reached in a given period of time. In the same manner, as the Stochastic Oscillator Indicator, the random index can also be used to identify Overbought or Oversold assets. Overbought assets go beyond the 80% range as the default setting, and an Oversold asset is a stock or financial asset that travels below the default designated 20% region. These regions are key alerts to traders as they project a viable period to sell an asset as in the case of an Overbought one or buy an asset as in the case of an Oversold one. Hence, KDJ is a useful indicator for determining the exit and entry period for an asset on the market. The Overbought and Oversold levels are also open to user configurations.
The KDJ indicator also informs traders of the trending movement of asset prices on the market. Pragmatically, if the market is experiencing a bullish direction, the J Line rises beyond the %D and %K lines on the chart. On the other hand, the J line recedes below the %K and %D lines in a bearish market movement scenario. Furthermore, KDJ is useful for identifying convergence on the market. During convergence, the %D line, %K line, and J Line are all equal. However, the direction of the J line after the crossover could hint at a sell or buy action. This helps traders and investors to make formidable and sound investment decisions to increase profits and regulate their losses.
Is the random index reliable?
First, from a general perspective, no technical indicator is one hundred percent reliable all the time. Even the most highly regarded indicators fail to prove their purpose under some circumstances. The Random Index or the KDJ indicator as a derivative of the Stochastic Oscillator Indicator inherited the parent lagging factor. Therefore, it can produce misleading or delayed signals which can hamper the productivity of traders. Random Index is well known for its ability to produce wrong trading signals to traders during flat markets. This event can lead to traders incurring huge losses on their investments.
The merit of the KDJ indicator is self-evident in active trades and for analyzing the respective trends and movements of the market. Since KDJ Indicators are prone to rendering false signals when used alone, experienced traders combine it with other technical indicators for a more fairly accurate market performance analysis. Examples of accessory indicators include the Average True Range Indicator, the Average Directional Index, and many others. These additional indicators are of significant resource to the KDJ Indicator even during situations like the flat market.
How is the random index added to a chart and what are the recommended parameters?
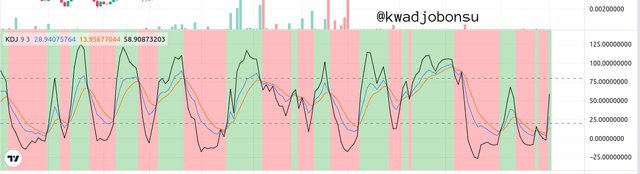
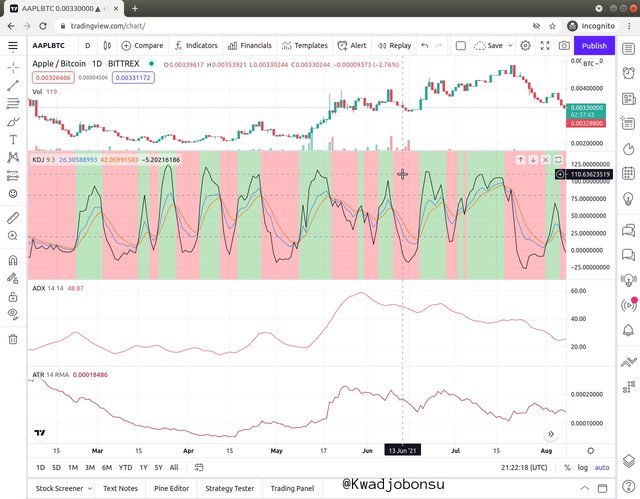
- First, click on the Chart button on the navigation bar of the landing page. It will open a chart for the default select asset, which in my case is Apple Inc stocks.

- Click on the Indicators and Strategies button on the topmost toolbar to get access to the Indicators.
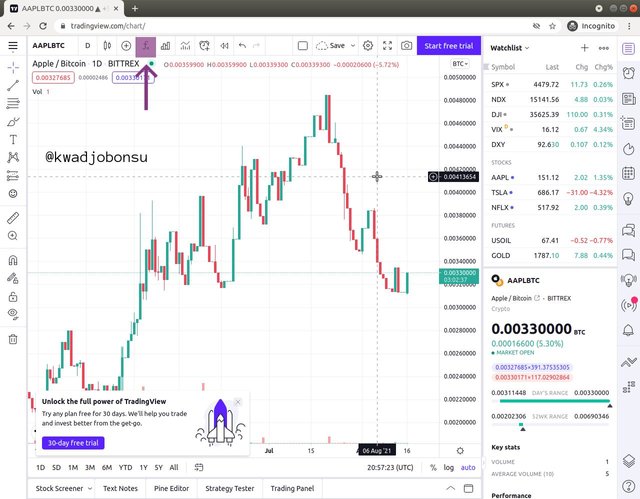
- The Indicators and Strategies dialog box displays offering a variety of in-built indicators.
- Indicators are arranged alphabetically. So users can scroll to the K column to located the KDJ Indicator. I, however, in this case, searched for the KDJ Indicator using the search bar.
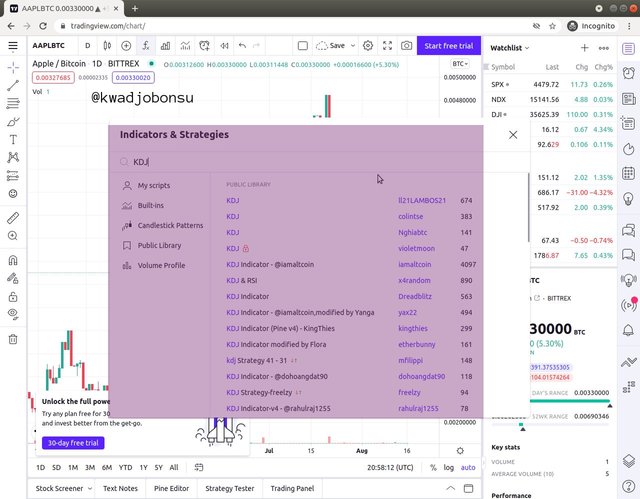
- The KDJ Indicator by ll21LAMBOS21 was selected.
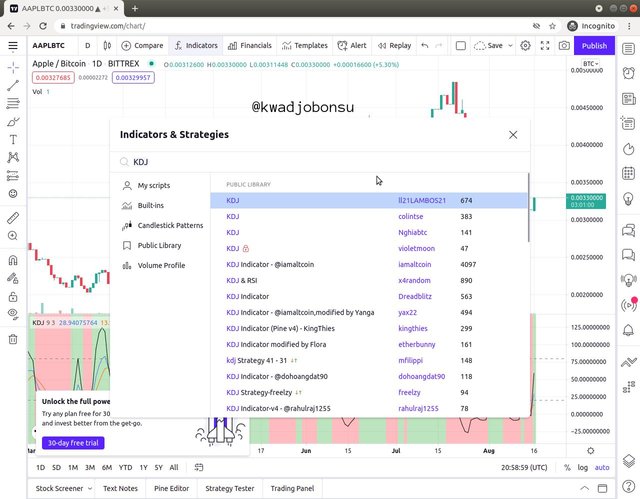
- It was displayed below the main chart with red and green highlights which represent price dip and price growth respectively.
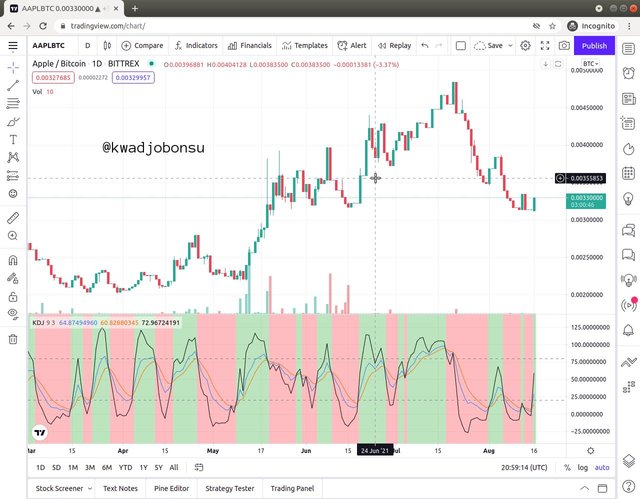
- The corresponding identifications of the respective parameters have been identified in the last image.
.jpg)
Differences between KDJ, ADX, and ATR
Average Directional Index, also known as ADX, is an indicator whose chief purpose is to assess the strength of a trend of a financial asset’s price on the market. Trends are of particular importance because they aid traders in making decisions that lead them to accrue more profits and mitigate the gravity of their losses. ADX takes into consideration the MA of an asset’s price within a specific duration of time. The respective ADX value of a trend denotes the momentum of its trend. Thus, An ADX value between 75 and 100 signifies an intensely strong trend, whereas a value bounded between 0 and 25 indicates a seriously weak trend movement. Additionally, a value engulfed between 25 to 50 and 50 to 75 has a strong and very strong trend respectively. To conclude, the Average Directional Index is mainly utilized to determine how weak or strong the trend of a stock or asset’s price movement is on the market. It is graphically represented by a single line.
Average True Range, also known as ATR, is a technical analysis tool that is used to determine the movement of stocks or financial assets on the market with regards to their volatility. To this end, when a financial asset on the market has a high ATR value, it indicates high volatility, while a low ATR value signifies low asset volatility on the market. Seasoned traders use it to guide their exits and entrances into the market. Unlike KDJ, ATR does not show the direction of a stock or asset’s price on the market. It is primarily concerned with the volatile nature of the asset. Therefore, Average True Range values are equivocal when it comes to trend prediction, and its computations are heavily dependent on previous market data. ATR is graphically represented on the chart with a single line.
Random Index in comparison to the two indicators above is graphically represented by three lines. KDJ can signal possible breakouts or trends through the line's position within the 100 to 0 boundary. It forecasts a possible bullish trend when the lines fall below the 20 marks, which is characterized as the Oversold region. Alternatively, the movement of the line above the 80 marks, also known as the Overbought level, foreshadows a likely bearish trend. KDJ Indicator can be used to determine entry and exits points in the market. It, however, fails to produce an accurate signal in flat markets, thus when volatility is low. As a result, it is often used in conjunction with other indicators to render more accurate trading services.
A Screenshot showing the three Indicators at the same time
Use the signals of the random index to buy and sell any two cryptocurrencies.
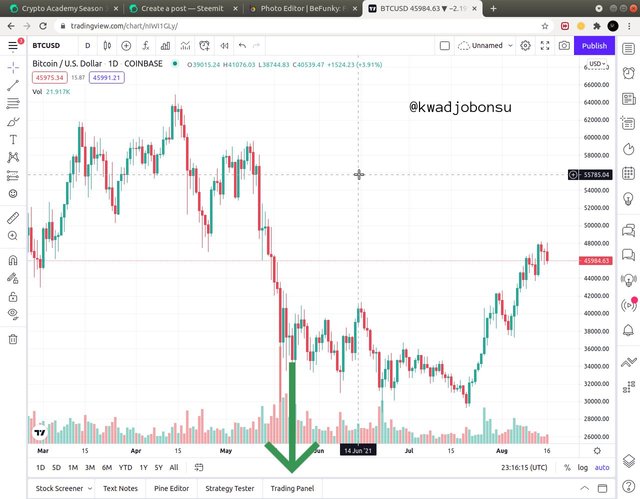
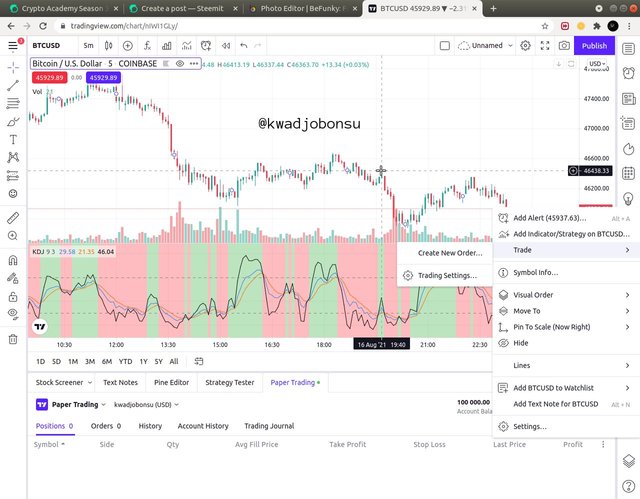
- BTC/USD Chart was selected. I then clicked on Trading Panel
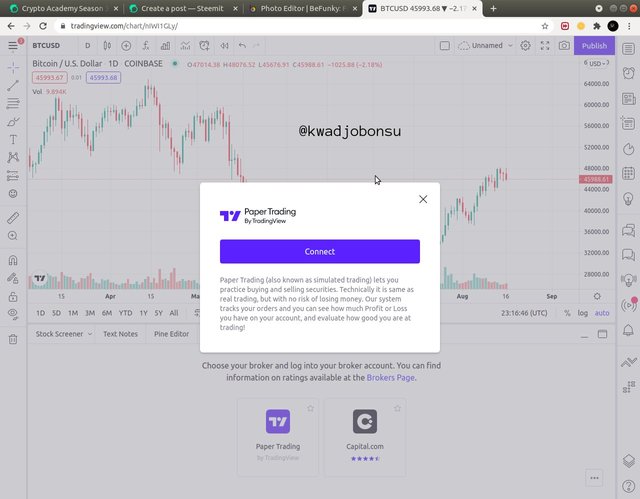
- Next, I connected my account to Paper Trading, which is basically a Demo Account.
- The time period for the chart was 5 minutes
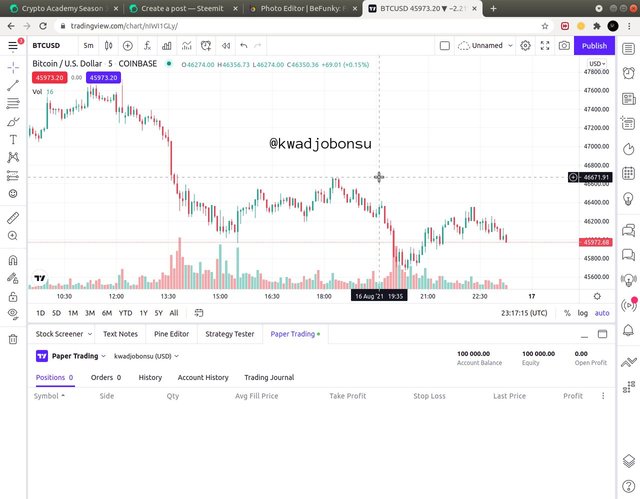
- I then added the KDJ Indicator and opened a new order where I Bought BTC/USD because the J Line was in the Oversold region.
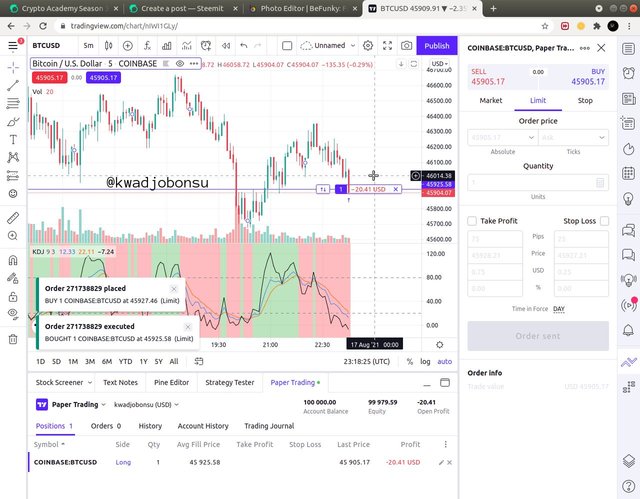
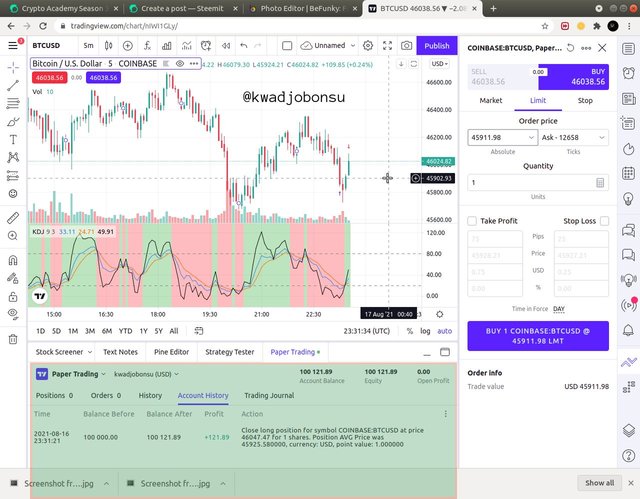
- After patiently waiting for some time, I closed the order with a net profit of $121.89
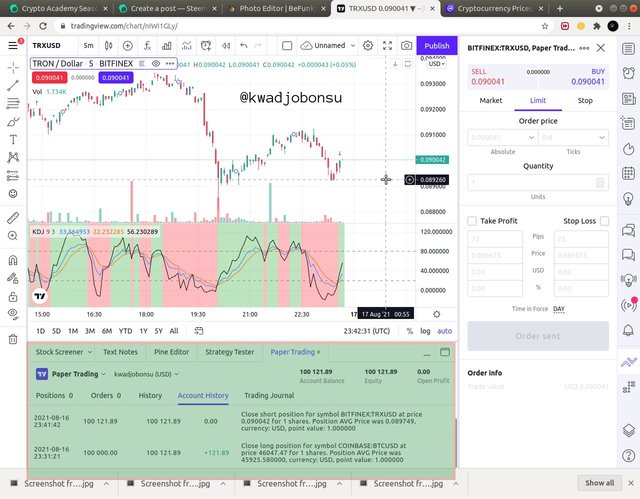
The next Crypto pair was Tron/USD.
- The %K and %D Line for the chart were now entering the Oversold region. So I clicked Sell.
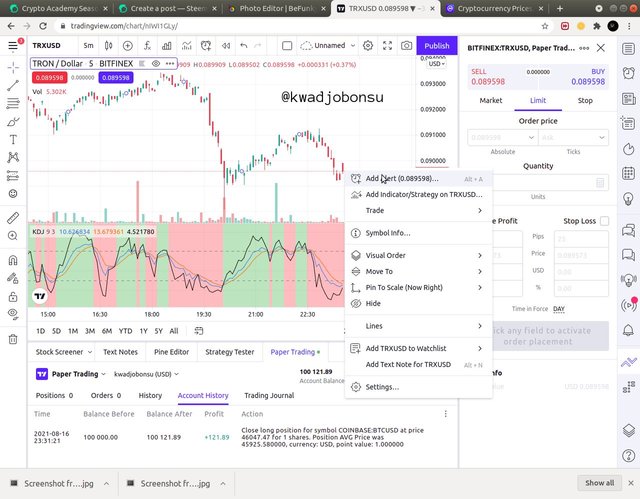
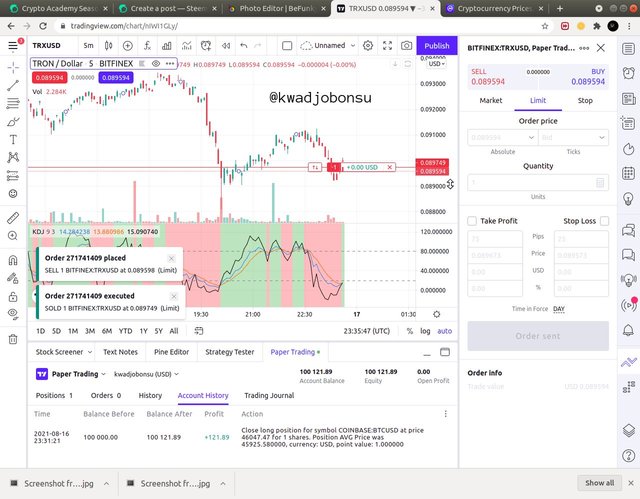
- I closed the order with a 0 profit/loss
This has been an interactive lesson. I have learned about different Indicators and their application to make profits on the markets. Thank you, Professor, @asaj


.jpg)


Superb performance @kwadjobonsu!
Thanks for performing the above task in the eighth week of Steemit Crypto Academy Season 3. The time and effort put into this work is appreciated. Hence, you have scored 10 out of 10. Here are the details:
Remarks
Overall, you have done great explaining the random index and its reliability. You have also been able to differentiate the random index from the average directional index and the average true range.
Although you did not provide a conclusion nor provide the recommended parameters of KDJ, the manner in which you performed the tasks has earned you some bonus points. As a suggestion, a conclusion serves as a summary of what have been discussed.